Rates as of 06:00 GMT
Market Recap
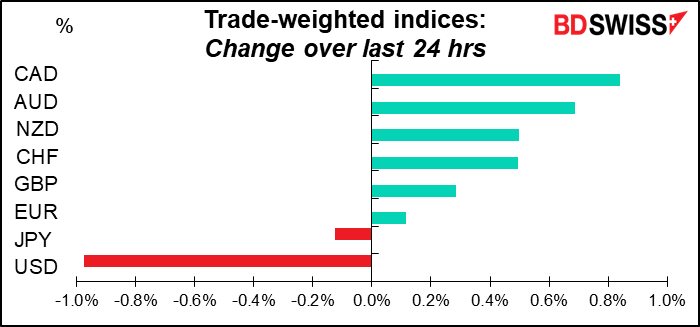
Yesterday was proof of the old saying, “buy the rumor, sell the fact.” The US consumer price index (CPI) rose to a 40-year high, the first time since 1982 it had a 7-handle, and what’s the result? Inflation expectations fall and USD is the weakest currency of the bunch.
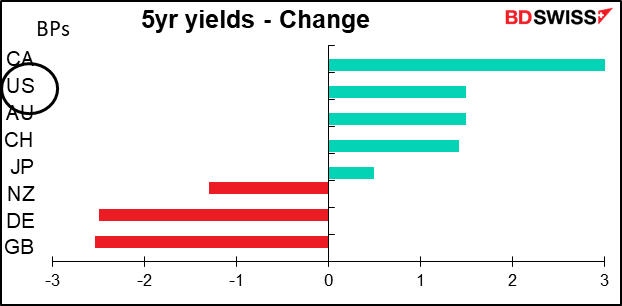
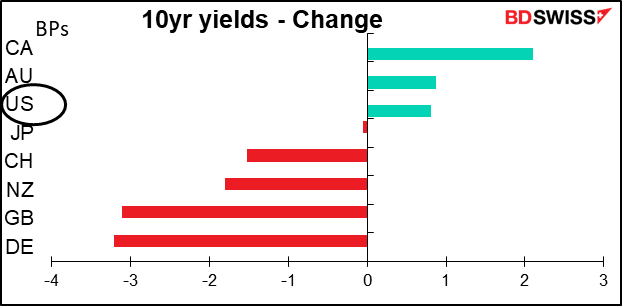
US bond yields rose only slightly in reaction to the news.
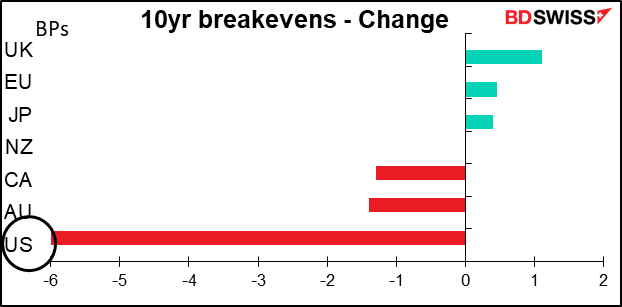
But inflation expectations fell sharply! One might have thought that higher inflation would push inflation expectations higher, but the market had had a week to price in increased Fed hawkishness after last Wednesday’s release of the minutes of the December FOMC meeting.
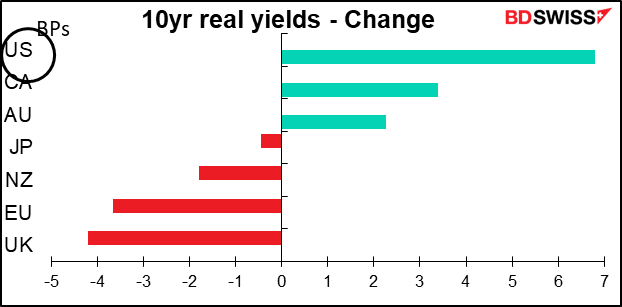
That pushed US real yields sharply higher, which in theory should’ve supported the dollar, but no dice.
Apparently the market either has faith in the Fed’s ability to control inflation or in the Fed’s earlier pronouncements that higher inflation is just “transitory.” The Bloomberg consensus forecasts for US inflation show it gradually falling back down toward the Fed’s 2% target over the next year-and-a-half.

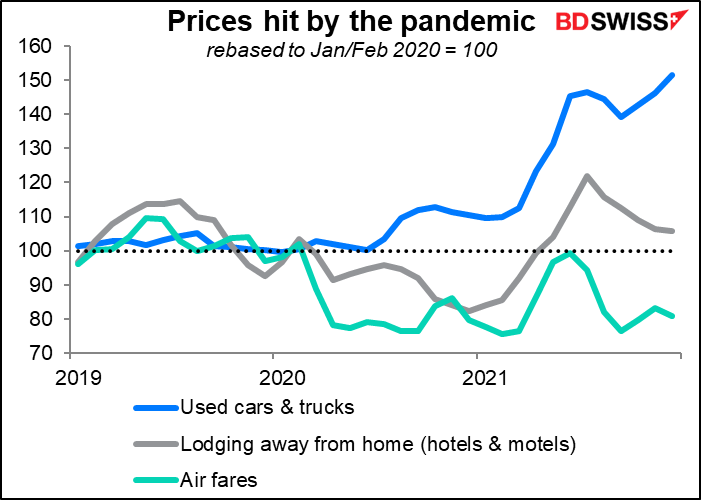
Is this forecast realistic? There was some good news on some of the items hit by the pandemic, like hotels and airfares. But used cars and trucks, the source of much evil recently, continued to move higher.
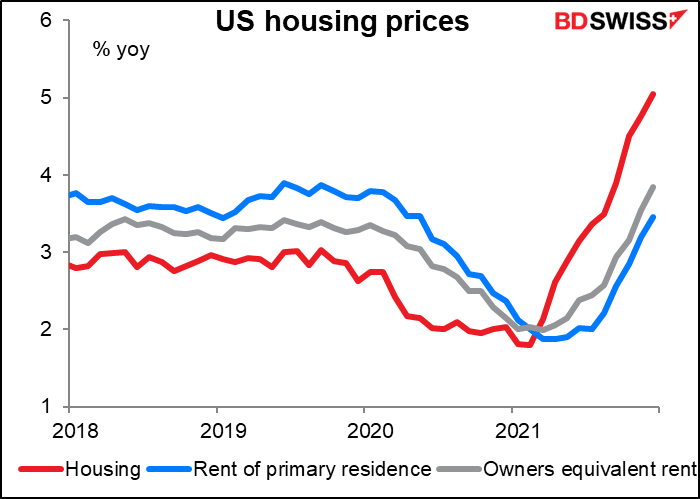
Furthermore, housing costs – which aren’t affected by a shortage of chips or shipping costs from China – continued their seemingly inexorable rise. This is crucial to the inflation outlook because primary rents and owners equivalent rent make up around a third of the CPI and 40% of core CPI.
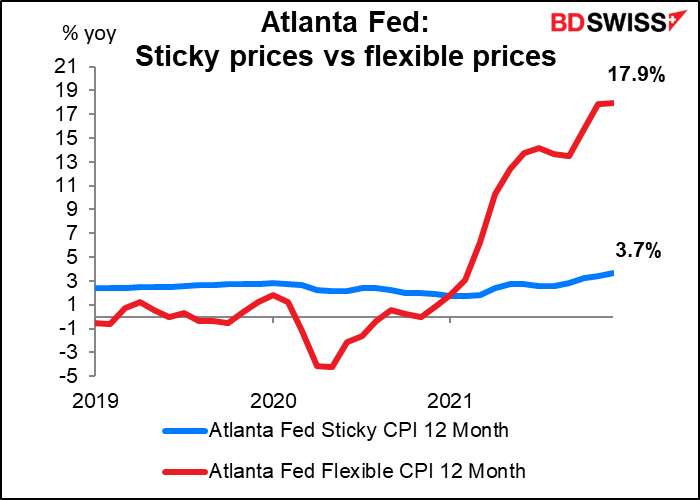
And the Atlanta Fed’s index of “sticky” vs “flexible” prices – those that are slow to change (eg things with written sticker prices) vs those that change rapidly (eg gasoline) showed both rising. Of particular concern is the rise in “sticky” prices by 3.7% yoy, up from 3.4% in the previous month and 1.7% at the beginning of 2021. Once they get going, what will it take to stop them?
If the Fed has to move faster and further than the market expects, then the dollar could get some support from the move. But stocks could suffer.
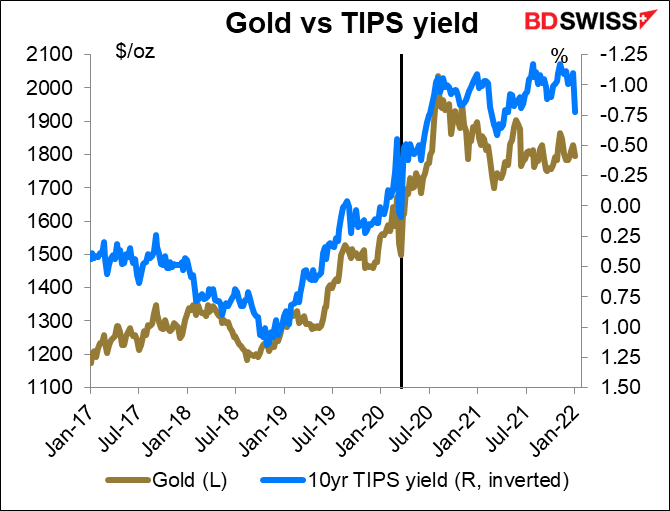
What about gold? Gold recently hasn’t been moving as an inflation hedge – it’s been moving in line with the yield on Treasury Inflation-Protected Securities (TIPS). That bodes ill for the yellow metal if inflation moves higher.
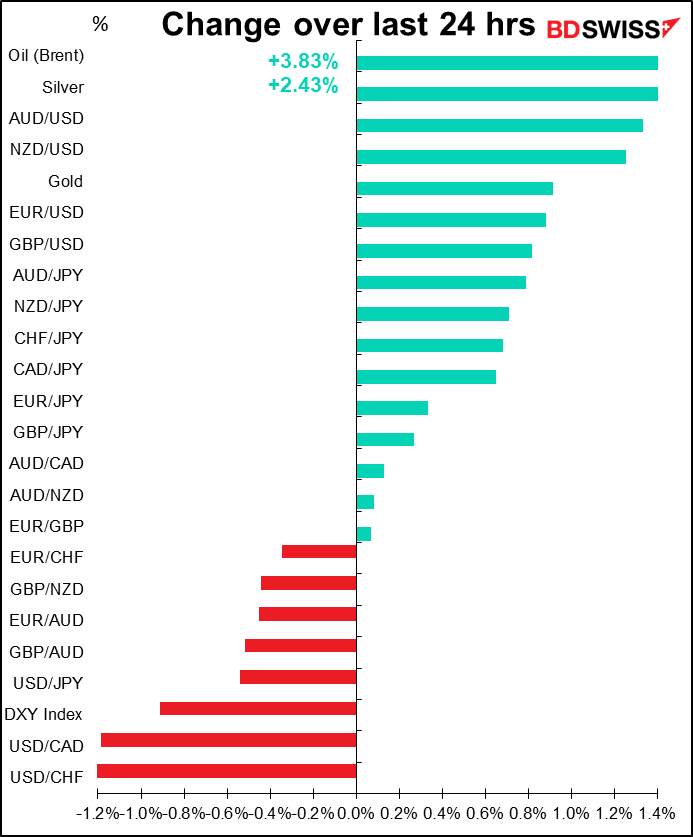
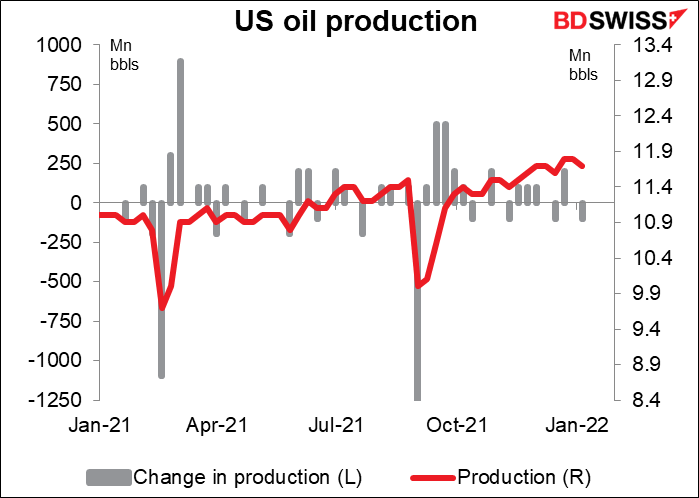
Oil moved higher as the US Dept of Energy report confirmed that crude oil inventories fell in the latest week, the seventh consecutive week of decline. The DoE reported at 4.6mn bbl fall in inventories in the latest week, far more than the 1.1mn bbl decline reported by the American Petroleum Institute. So far over the last seven weeks the DoE says inventories have fallen by 20.7mn bbl while the API says -18.9mn. Meanwhile, the DoE reported a 100k fall in US oil production to 11.7mn b/d, which is going nowhere fast.
Now that I’ve explained why oil was up, there’s no need to explain why CAD was the best-performing currency, is there?
Today’s market
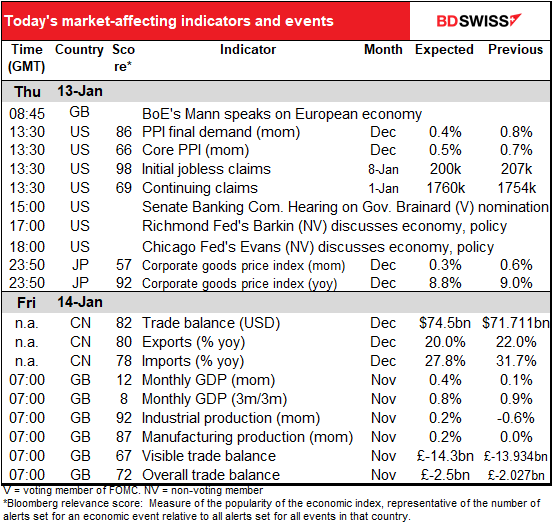
Note: The table above is updated before publication with the latest consensus forecasts. However, the text & charts are prepared ahead of time. Therefore there can be discrepancies between the forecasts given in the table above and in the text & charts.
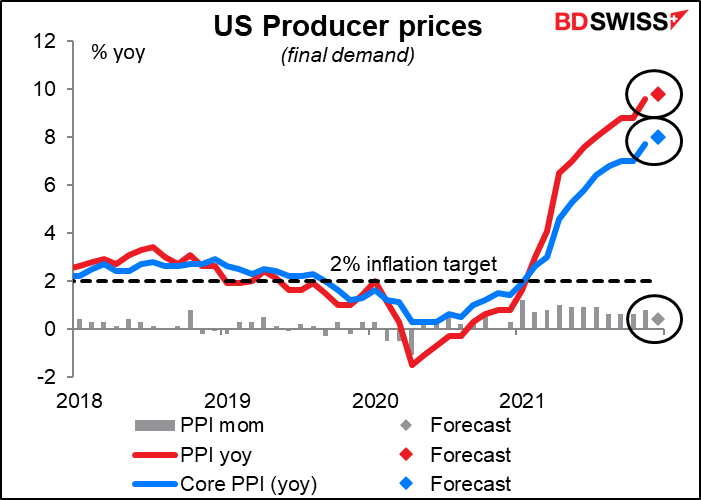
The theme in the market nowadays is inflation. That means a lot of folks will be interested in today’s US producer price index (PPI). Many people assume that a rise in producer prices will eventually feed through to a rise in consumer prices, but not necessarily – sometimes the causality goes the other way, too. (For more information see The PPI and the CPI: what’s the connection?) In any event, a further rise in the PPI will only encourage thoughts of further rises in the CPI later on. What that does to the dollar though isn’t clear after yesterday’s surprise reaction to the 7% US CPI.
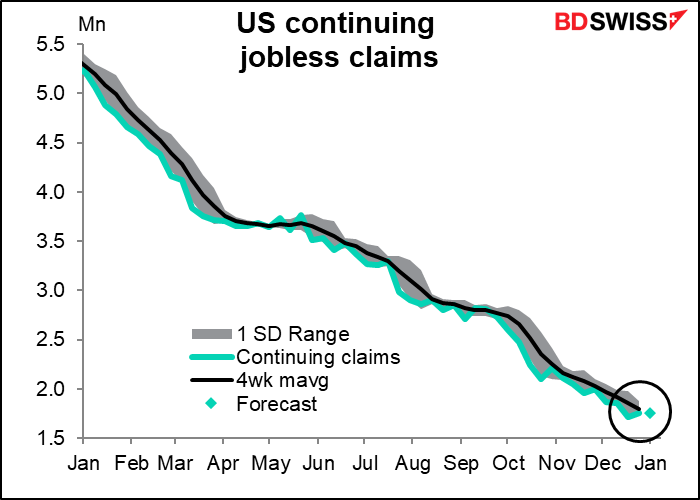
US initial jobless claims have been oscillating around the 200k mark for several weeks, ranging from 188k on Dec. 3rd to 207k last week. I think they’ve probably bottomed out for now. The December low of 188k was a near-record low (lowest was 162k in November 1968, when the working-age population was about half what it is today) so it would be amazing if it were to break through that. On the other hand, given the difficulty companies are having in hiring people, perhaps they’ll be reluctant to let people go. So we could hover around this level for some time.
This week’s figures will be important to see how companies and workers are faring as the omicron variant spreads. Has it caused an increase in job losses?
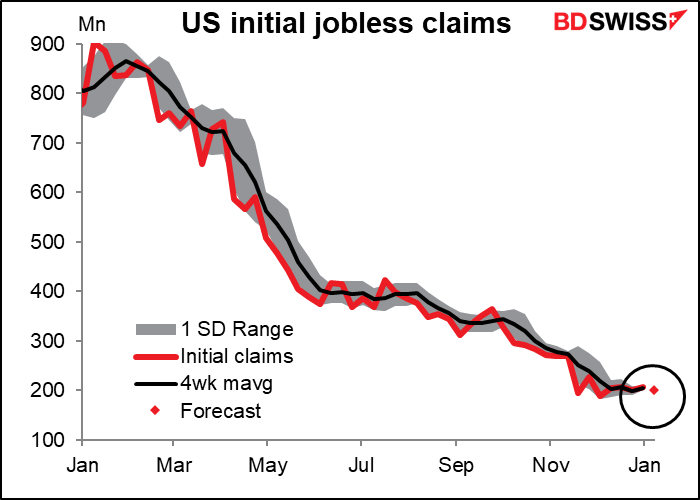
Continuing claims too seem to be stabilizing.
Later in the day the Senate Banking Committee will hold a hearing on the nomination of Gov. Lael Brainard for Vice Chair of the Fed. She may get more pushback from Senators as she’s the only known Democrat among the Governors, but she’ll no doubt get approved at the end – Senators don’t seem to play politics as much with Fed appointments as they do elsewhere. Like on Tuesday with Fed Chair Powell, she’s likely to be asked about where she thinks inflation is going (remaining high in the near term, falling over the medium term) and what the Fed is going to do about it (fight it resolutely, no doubt).
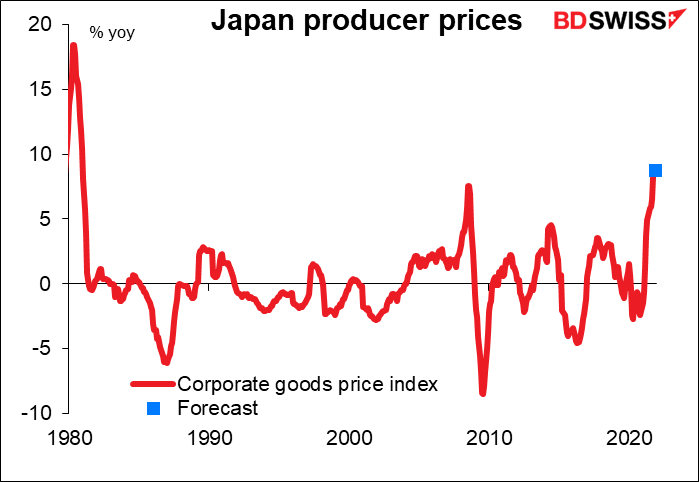
Then overnight we get the indicator you’ve all been waiting breathlessly for I’m sure: Japan’s corporate goods price index (CGPI), known in other countries as the producer price index (PPI). Bank of Japan Gov. Kuroday Wednesday said he expects the country’s underlying inflation to pick up gradually over the long-term after moderate near-term gains led by energy prices. This was basically nothing more than a rehash of the Bank’s view of prices from its policy statement in December.
I discussed the CGPI in some detail in my Weekly Outlook, but since I get paid by the word I’ll repeat everything and even fluff it up a bit more so I can afford to turn the heat up a few degrees in my house during the winter.
The FX market hasn’t paid much attention to this index for the last 20 or 30 years, but we’re now watching it closely. In November it was up 9% yoy, the highest rate since the early 1980s. It’s expected to rise by 8.8% yoy in December, not much of a change.
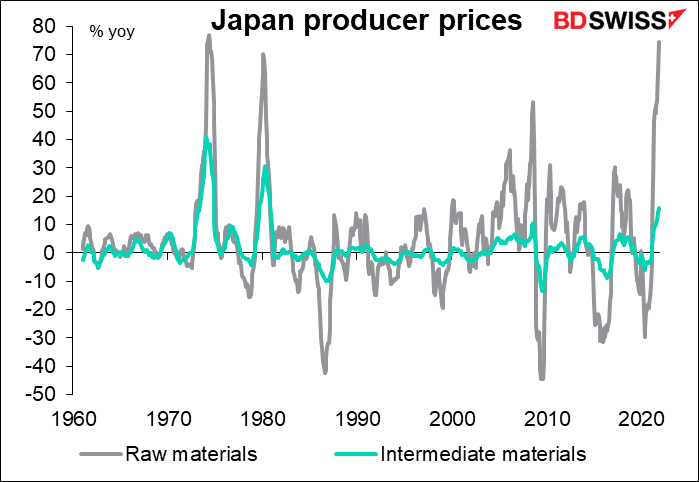
The rise is being driven by raw material prices, which were up an astonishing 75% yoy. Intermediate goods prices were up 15.7% yoy.
Up to now companies have managed to absorb higher input prices in their margins, but the Bank of Japan’s short-term survey on economic conditions (tankan) shows that more and more companies are passing them on to consumers. The prices diffusion index (DI) shows what percent of companies are raising prices minus what percent are lowering them. For the previous decade, the input prices DI was usually positive (more companies were seeing a rise in prices of their inputs than a fall), but the output price DI was mostly negative (more companies were cutting their prices than raising them). That’s changed; more and more companies are willing and able to pass through those higher prices to consumers.
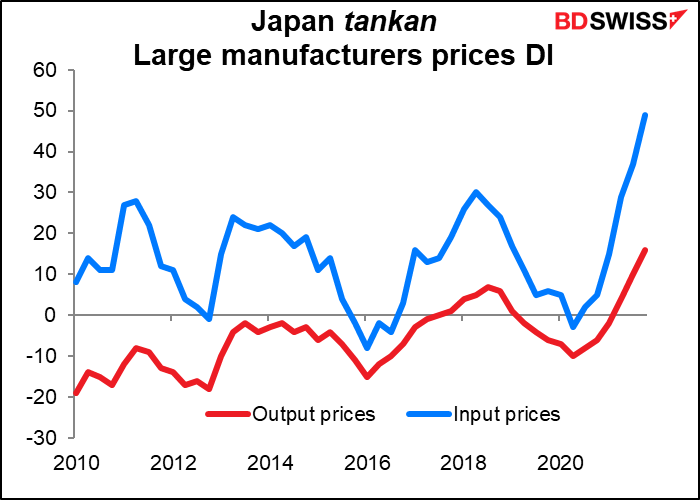
If they were to pass just a small part of these higher prices on, Japan might hit its 2% inflation target and the Bank of Japan could start to rein in its extraordinary monetary policies. That would be a major shift for the financial world, which has gotten used to Japan being a never-ending source of zero-cost money. That could mean a stronger yen and a weaker euro or Swiss franc as investors switched their funding currencies.
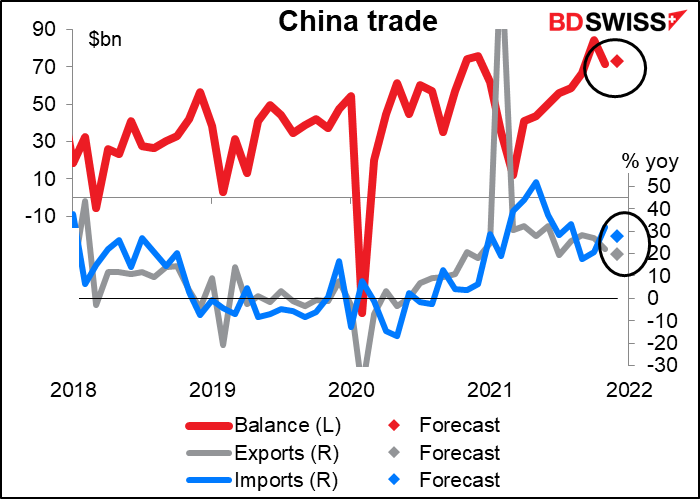
China’s trade surplus is expected to stay effectively the same. Exports and import growth are both forecast to show slightly while remaining well above pre-pandemic rates. That should be good news for the countries that export to them, particularly Australia and New Zealand.
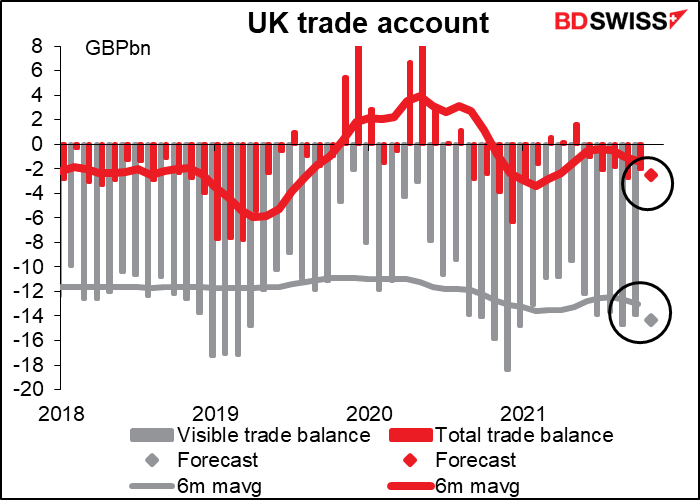
Then we wait until early in the European day and the dawning of UK short-term indicator day, which includes the industrial & manufacturing production, trade figures, and the all-important monthly GDP.
November GDP is expected to be up notably from a relatively weak October as the service sector rebounded. Testing and vaccination count as health services in the GDP figures too you know! Retail spending also rose during the month thanks to people doing their Christmas shopping early out of fear that stores might run out of what they wanted. With luck, output will be back to its pre-pandemic level.
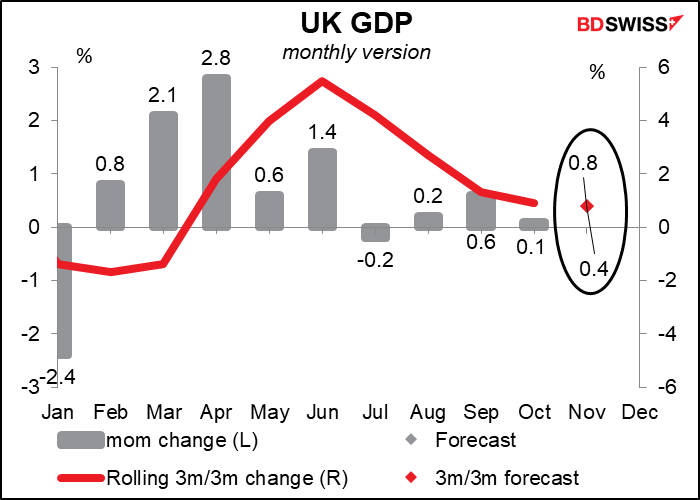
The problem is, with “Plan ‘B’” restrictions starting in early December, November may mark the high water mark for the time being even though those restrictions aren’t particularly onerous.
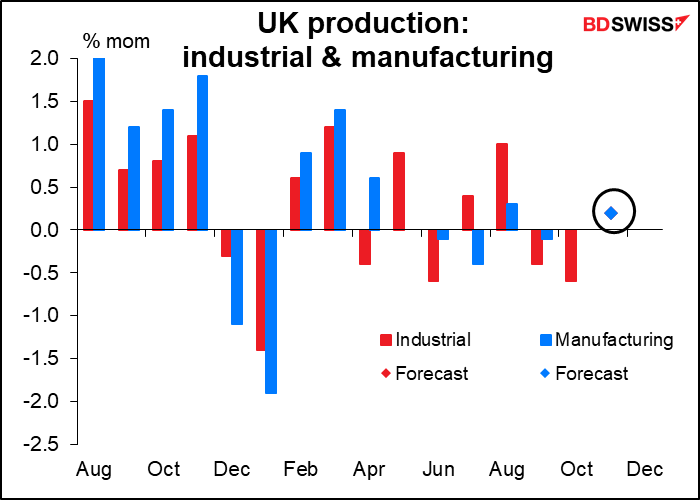
Industrial and manufacturing production are both expected to be up 0.2% mom, which is why it looks as if there’s only one dot on the chart. This modest increase isn’t particularly impressive, given the decline in the previous two months. Energy demand increased during the month (good), but crude oil production fell around 10% (bad).
Meanwhile, the nation’s trade deficit is forecast to widen, both for goods only and for goods & services. I suspect this is going to be a continuing story for 2022 as the reality of Brexit settles in and Britain discovers that perhaps cutting ties with its largest trading partner wasn’t the greatest idea. Over time the widening trade deficit is liable to be a negative for the pound, IMHO.