


We’ve talked a lot about inflation, the impact of the pandemic, the impact of labor shortages, used cars and microchips, whether it’s “transitory” or whether prices are “sticky,” etc etc. Today I’d like to talk about the long-term trend in inflation. I’m worried that one reason inflation might be higher than we expected for longer than we expected could be climate change. That’s a big problem for central banks. Higher interest rates can do nothing o increase the supply of food, just choke off demand.
I was struck by this graph of the UN’s Food and Agriculture Organization’s world food price index. It’s up 20% yoy. Last May it was up 41% yoy. That’s a tremendous strain on peoples’ budgets.
The index climbed to its highest level since 2011, when skyrocketing costs contributed to political uprisings in Egypt and Libya. The price of meat, dairy, and cereals rose, while the price of oils reached the highest level since the index began in 1990.

Many of the essentials of life have become more expensive since the beginning of last year. We’ll have to start drinking cocoa (-4.2%) instead of coffee (+84%) – but don’t put milk (+34%) in it!


The poster child for crazy agricultural prices recently is not a foodstuff but rather lumber. Lumber futures hit a peak of $1,686 per 1,000 board feet on May 7th last year. They’re down a lot since then – most recently trading at $980 — but before 2021 that would’ve been the record high.

Here’s a shorter time span so you can see what’s been happening recently

This surge in lumber prices is not directly connected to the US housing market. Housing starts averaged a 1.6mn monthly pace in 2021 vs 2.07mn monthly pace in 2006, when lumber averaged $615. Even if we adjust for inflation (1986 = 100), lumber averaged 92 in 2006 and 209 over the last 12 months, i.e. more than double the inflation-adjusted price.

The reason for such high lumber prices was described recently in several articles in The Atlantic, a general-interest US magazine. Pardon me if I crib shamelessly from them.
Part of the lumber story is a pandemic story. When the pandemic hit, people had to work from home. Many decided they needed to add on a new room to work in. Or since they were spending more time at home, they decided to expand their house rather than take a vacation. So even if the number of housing starts didn’t increase, demand for lumber did.
But as the graph shows, in the past the lumber market was able to accommodate surges in demand without prices soaring. When lumber hit $500 per 1,000 board feet they just cut down more trees. No more.
“The lumber-price story is a climate story,” according to a lumber trader quoted in the magazine. The increase in demand hit up against a series of disasters that prevent the industry from expanding supply. These disasters include:
The story is similar for other agricultural commodities.
Again, part of it is a pandemic story. As people stopped going out to eat and cooked more at home, the industry discovered that supply chains designed to get food into restaurants can’t easily be diverted to get food to supermarkets. Some producers were forced to destroy their crops (milk, potatoes). Abattoirs shut down due to a shortage of workers, forcing farmers to cull their herds and raising meat prices. A shortage of truck drivers makes everything worse.
At the same time there are also underlying climate factors at work, too.
Wheat and corn. Last summer was the hottest ever recorded in the US. The heat combined with record-setting drought not only damaged crops but gave rise to swarms of grasshoppers, which devoured the wheat crop. Corn also suffered.
Coffee: Brazil suffered from its worst drought in 91 ears last year. Water levels fell so low in some rivers that shipping was disrupted. Then a surprise frost hit Brazil’s coffee belt, damaging not only the current crop but also the buds that will become next year’s coffee beans. (Like in Canada, the trees were already weakened by heat stress.) Coffee futures are up 84% from a year earlier.
Peas: As “fake meat” becomes more popular, demand for peas has risen. Alas, the worst drought in Canada since 1961 hit the pea crop there and helped prices to double. Coincidentally, unusual rains in France also damaged their pea crop.
The same story could be repeated across a wide variety of foodstuffs.
There are several issues with food inflation:
- Raising interest rates cannot do anything to increase supply. It can only restrain prices by depressing demand. But demand for food is not price-elastic. People have to eat something. They can substitute chicken for beef if beef prices rise too much, but with potato prices up 245% since the beginning of 2021 it’s hard to see how far down the food price ladder people can go. At some point the high price of food will curb demand for other goods & services.
- Food inflation hits the poor hardest, since they tend to spend the largest amount of their income on food. It therefore hits developing countries harder than the industrialized countries, too. Poor people there may spend 50%-60% of their incomes on food. Food has a 13.9% weight in the US consumer price index basket but 17%-21% for China, 20.7% for Brazil and 23.2% for Mexico.
By the way, climate change is also affecting the prices of other goods. More than half of the world’s semiconductors are made in Taiwan, where the world’s largest contract chipmaker, Taiwan Semiconductor Manufacturing Co Ltd (TSMC), uses more than 150,000 tons of water a day (approximately 80 standard swimming pools). Usually the island gets plenty of water, but the counterpart to the freak floods elsewhere in the world has been the absence of the usual monsoon rains in Taiwan. The resulting water shortage has been one of the factors hindering semiconductor production.
The coming week: US CPI, Japan PPI, UK “short-term indicator” day
The second week of the month is usually quiet but this week seems to be unusually usually quiet, if that makes sense.
The main focus as always will be on the US consumer price index (CPI) out on Thursday. In theory this shouldn’t matter as much as the personal consumption expenditure (PCE) deflator, which is what the Fed uses to define inflation, but in practice this is what the market pays most attention to.
It’s expected to be grim: a further rise to 7.3% yoy. It’s not all energy & food either as core inflation is expected to rise further, too.

Nor can we blame base effects. If we look at the three-month change annualized to get feel for short-term inflation trends, headline inflation is expected to slow but core inflation is forecast to move even higher. (So why did I just spend hours writing about food inflation, which is excluded from the core measure? Bad choice, Marsh.)
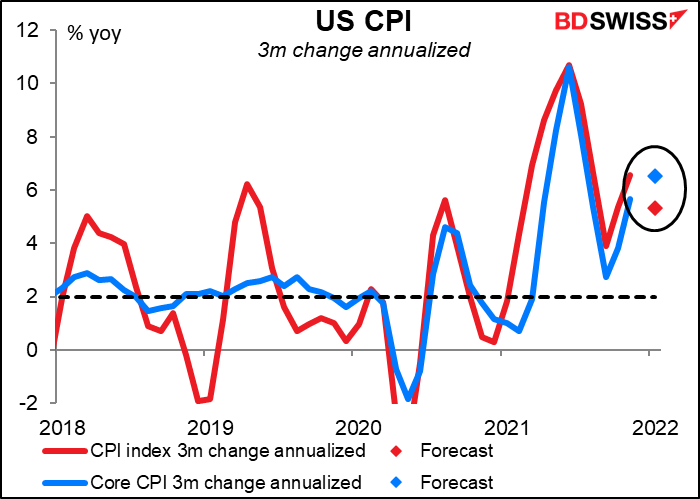
Most of the increase has been in goods with so-called “flexible” prices, i.e. those that change regularly (think gasoline & air fares). But “sticky” prices, those that don’t change very often, have been rising too. They’re up 3.7% yoy, which is almost double the Fed’s target. Flexible prices are flexible on the downside too but sticky prices are going to remain stuck at high levels.

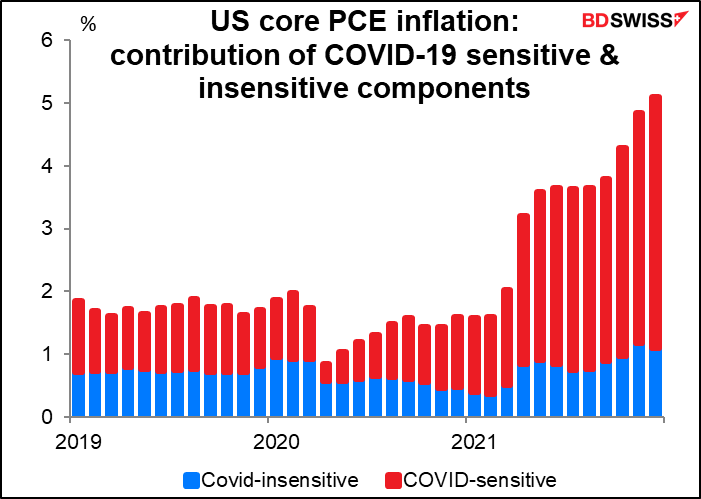
There is some hope, though. The San Francisco Fed slices & dices the PCE deflator figures to discern which goods are sensitive to the disruptions caused by the pandemic and which aren’t (mostly by looking at which prices collapsed or soared at the beginning of the pandemic). What they find is that goods & services sensitive to COVID-19 are still contributing the bulk of the increase in inflation (about 4.0 percentage points vs 1.1 ppt for insensitive goods & services). However the contribution from COVID-19 insensitive goods & services has risen sharply from around 0.4 ppt at the beginning of the year. So it does appear that inflation is spreading out from areas that were immediately impacted by the pandemic. This is why central banks have to act to get inflation and inflation expectations under control.
Other US indicators out next week, such as they are, include the trade balance on Tuesday and U of M consumer sentiment index on Friday.
One central bank that doesn’t have to worry about getting inflation down – yet – is the Bank of Japan (BoJ). On Thursday we’ll get the Japan corporate goods price index (CPGI), known elsewhere as the producer price index (PPI). It’s expected once again to show an unusually high rate of increase in producer prices, although less of an increase than in the previous two months (at least on a yoy basis).
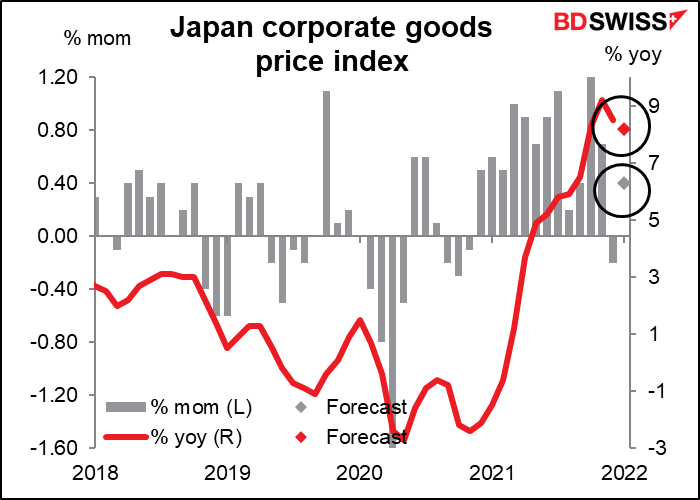
Many people with nothing better to do, like me, are watching this indicator closely. The unprecedented 77% yoy increase in raw material prices in November led to an unusually high 16.1% yoy increase in intermediate goods prices (the highest since Nov. 1980).

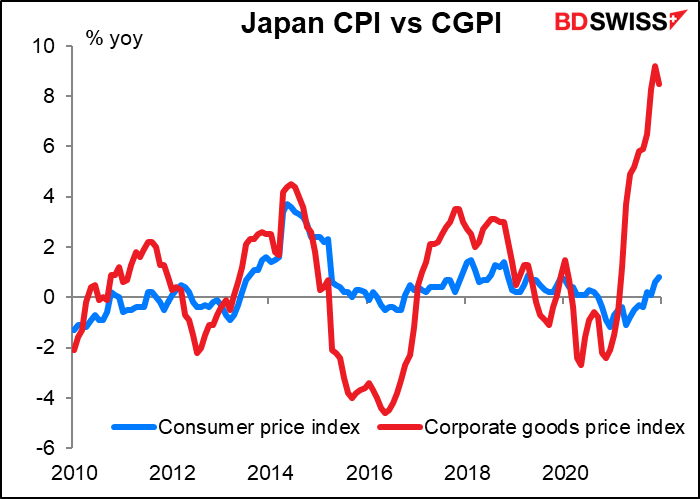
Now we’re all wondering: how long before the 8.5% yoy increase in the overall CGPI starts to feed through to the +0.8% yoy consumer price index in Japan?. The last time intermediate goods prices were rising at this rate, final goods prices were rising about 7% a year and the CPI was rising 8% a year. Or will companies just keep absorbing the higher prices in their margins? This is why this previously obscure indicator has recently become a hot one, at least for those of us who live & die by the spreadsheet.
Japan also releases its current account balance on Tuesday.
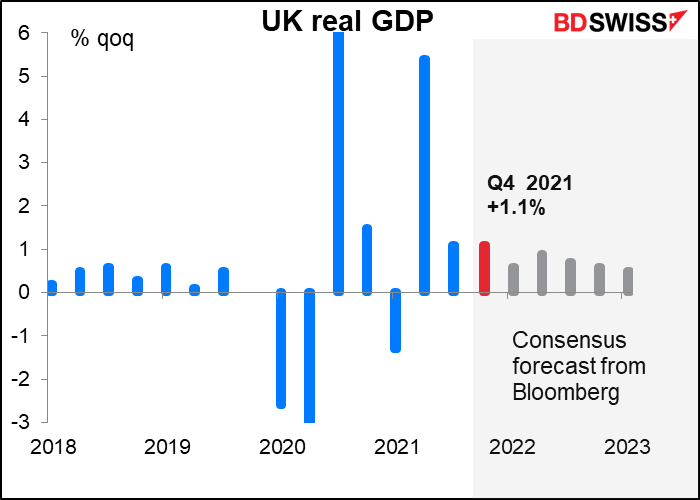
The biggest day for indicators during the week will be Friday, when Britain enjoys the monthly “short-term indicator day,” consisting of industrial & manufacturing production, trade data, and the star of the show this month, Q4 GDP. The market is looking for +1.1% qoq, the same as in Q3. According to the Bank of England’s February Monetary Policy Report, GDP was up 1.1% in the three months to November but fell in December and January due to the pandemic. I therefore think 1.1% could be a bit optimistic.
In any case the market seems to agree with the Bank that activity is likely to slow in following quarters, “driven mainly by slower growth in demand,” as the Bank put it. Gee I wonder why that is, if they’re raising interest rates while inflation is expected to hit 7.25%! According to the Bank’s calculations, real post-tax labor income – perhaps the best measure of standards of living since it accounts for the rising tax burden as well as inflation and earnings – will fall by 2% in 2022. This is the biggest fall since records began in 1990.
So why are they raising interest rates, which will compound the problem? “The reason is: if we don’t take this action it will be even worse,” Gov. Bailey said. “It’s a hard message. I know it’s a hard message.”


