Rates as of 05:00 GMT

Market Recap
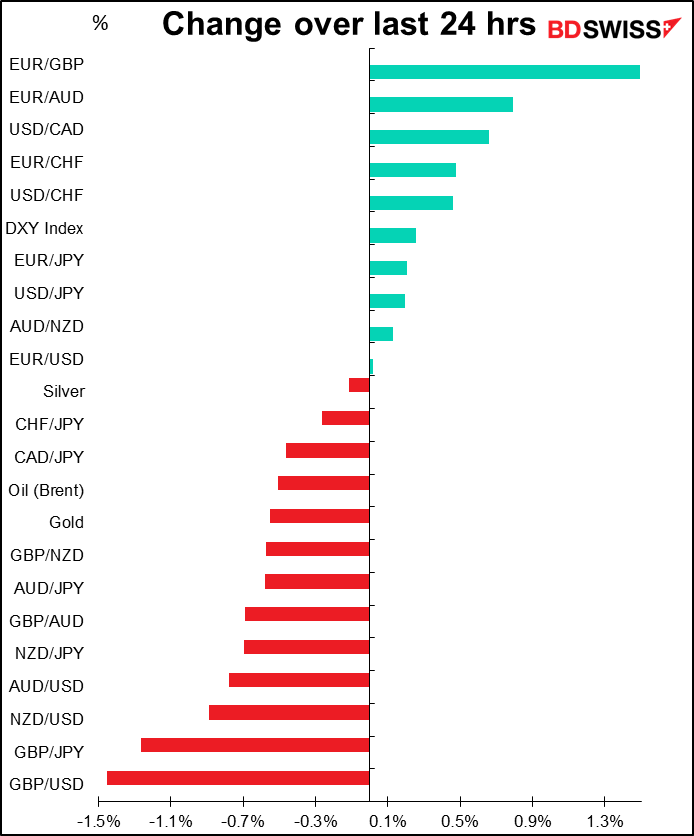
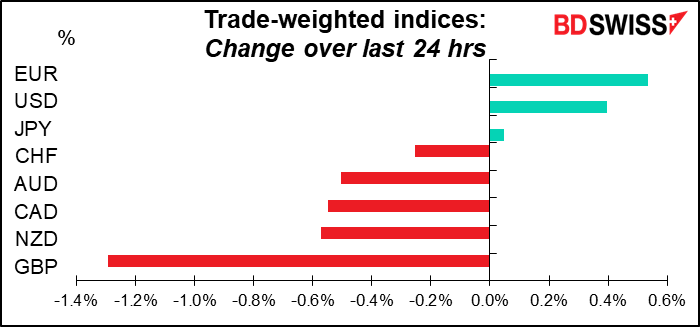
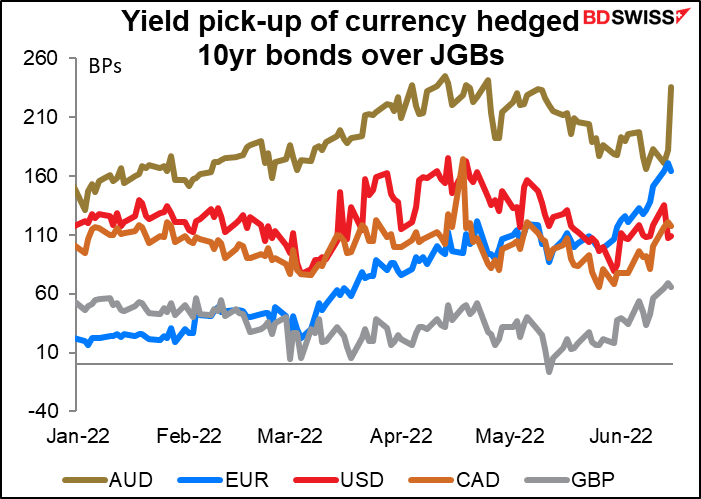
Currencies are really moving! The widening Japan rate differential with the rest of the world has lifted USD/JPY to the highest level since Oct. 2, 1998, while GBP/USD, which has been the worst-performing G10 currency for three days in a row, momentarily broke through 1.20 on the downside, the first time since March 2020.
The Bank of Japan hasn’t done anything to narrow the rate gap. On the contrary, yesterday it bought a record JPY 2.2tn in Japanese government bonds (JGBs) through its fixed-rate operation to keep the 10-year yield within its target range of ±25 bps of 0%.
The BoJ doubled down on Wednesday. As the JGB futures fell by the most since 2013, the BoJ announced unlimited purchases of cheapest-to-deliver (CTD) 10-year bonds Thursday and Friday – the Friday purchase being particularly significant as that’s the day of the Bank of Japan meeting.
(CTD bond: A wide variety of bonds can be delivered against the futures contract. The cheapest-to-deliver bond is the one that’s the cheapest to use if you sell futures and choose to deliver bonds instead of closing out your contract before it expires. The price of the futures therefore tends to trade in line with the price of the CTD bond, because otherwise an arbitrage opportunity arises.)

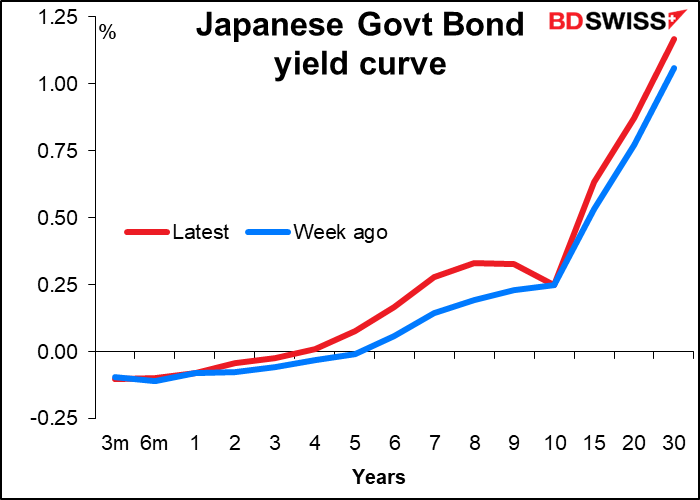
Notice though how the yield curve is bulging in the 7-9 year sector. These rates are higher than the 10-year bond, which is what the BoJ’s yield curve control (YCC) program targets. It’s an indication of where the 10-year bond would trade if it were to trade freely. This kind of distortion and the amount of firepower that the BoJ has to muster to keep the market in line raises the possibility that they might have to change the YCC program at Friday’s Policy Board meeting. That would be positive for JPY.
Last week, my Weekly Outlook was entitled “Is 50 the new 25?” meaning, previously central banks generally hiked by 25 bps at a time but it looks like now 50 bps increments are getting to be the norm. That’s already being gazumped (a British term meaning to top something, usually used with regards to buying houses). Now 75 seems to be the new 25! Not only is the Fed expected to go 75 bps in June and July (see below), but also ECB Governing Council member Klaas Knot yesterday hinted that the ECB could also hike by 75 bps in September. (“If conditions stay the same as they are today, we should increase the rate by more than 0.25 percentage points. The following level is to go up again by 0.50 points, but our options are not necessarily limited to that,” said Knot, who is also head of the Dutch central bank.)
Given that ECB President Lagarde and some of her closest associates are still sticking with 25 bps, Knot is going out on a limb, but we’ll have to see. If other central banks start moving by 75 bps too (I’m looking at you, Reserve Bank of Australia) perhaps the ECB will have to move by 75 to keep the euro from weakening too much.
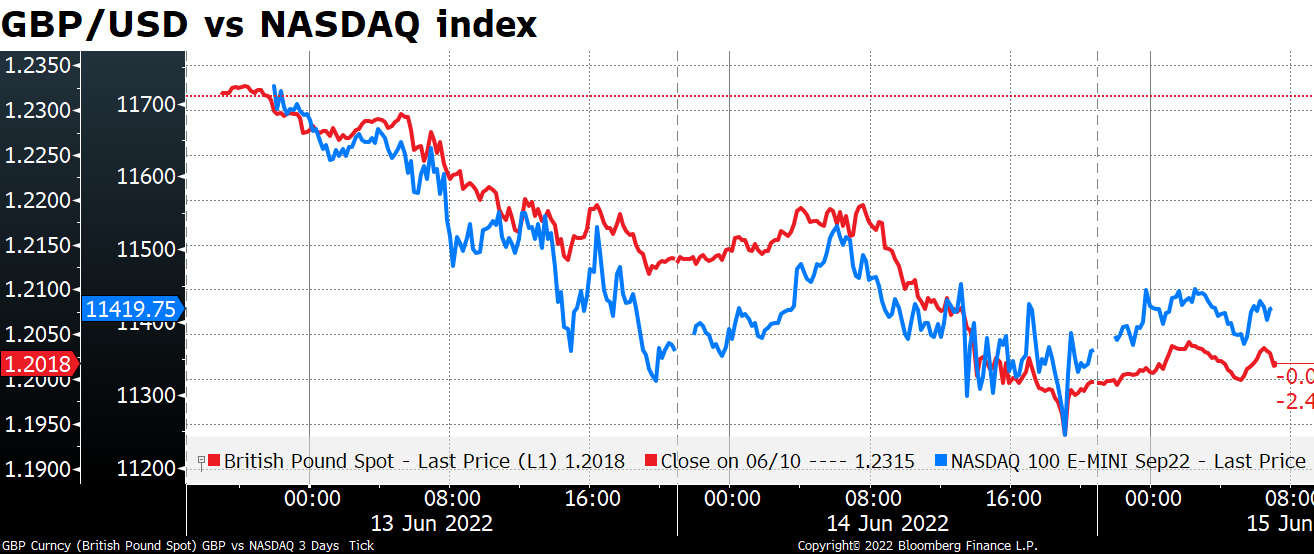
Elsewhere, GBP was once again the worst-performing currency of the day. Again, no particular UK news to explain yesterday’s 2.5 standard deviation fall, just GBP/USD following risk sentiment. I suspect some technical traders may have been targeting 1.20 on GBP/USD. Now that it’s bounced back above that level, will people give it another try? I expect so.
Today’s market
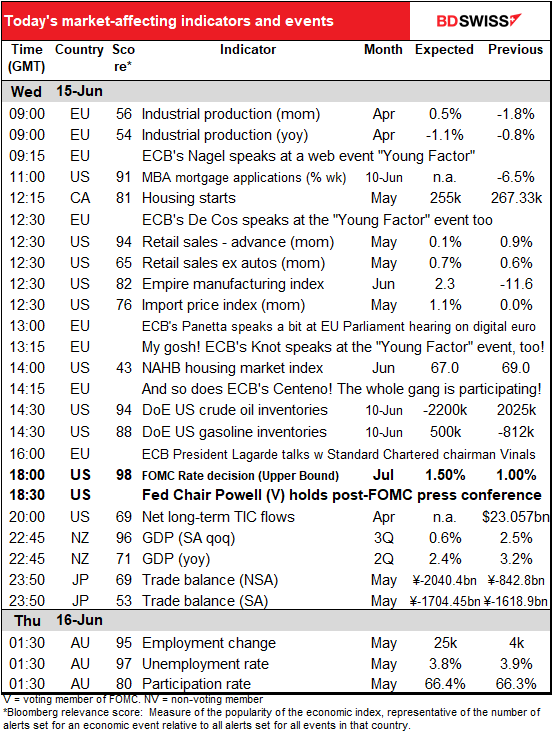
Note: The table above is updated before publication with the latest consensus forecasts. However, the text & charts are prepared ahead of time. Therefore there can be discrepancies between the forecasts given in the table above and in the text & charts.
Two features today: the meeting of the Federal Open Market Committee (FOMC), the rate-setting body of the US central bank, and US retail sales. Being an economic indicator, the retail sales will be dealt with in its appropriate chronological order. The FOMC meeting however we’ll get to right away.
Up until Friday there was little doubt about what the FOMC would decide. Several Fed officials, including Fed Chair Powell, had said they intended to hike the fed funds rate by 50 bps from its current 0.75%-1.0% range. That seemed like a certainty.
However, Friday’s shocking news that the US consumer price index (CPI) rose to 8.6% yoy in May instead of remaining at 8.3% yoy as expected has upset everyone’s plans. A report in Monday’s Wall Street Journal suggesting that the Fed would consider hiking 75 bps was the last straw.
The market interpreted “consider” to mean “carry out” and repriced the fed funds rate futures accordingly. Fed officials are currently in “purdah,” that is, they’re not allowed to make any public comments on policy for two weeks before the meeting, so there was no official response. But “the dog didn’t bark in the night” –no articles appeared anywhere else saying anything different. If they wanted to push back on this idea they could’ve leaked something to another paper, such as the FT.
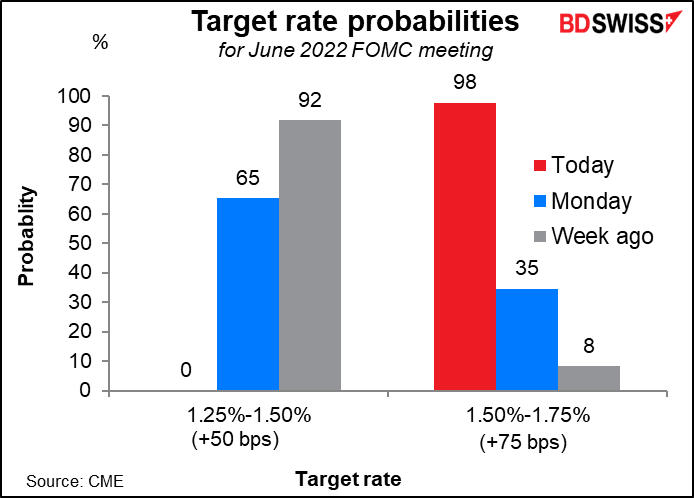
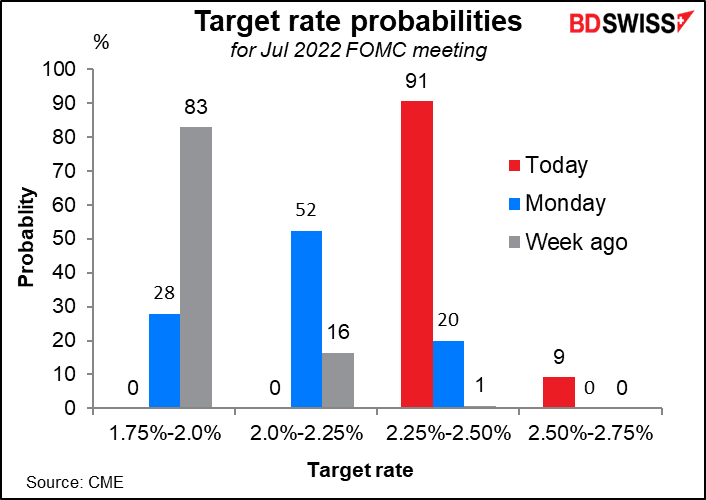
Fed Chair Powell’s comments about a 50 bps hike in both June and July had left the market wondering about September, but now everyone will be thinking, what about July? The market is now focusing on 2.25%-2.50% for July, which, if they hike 75 bps to 1.5%-1.75% today, would be another 75 bps hike, with zero chance of anything less but a small (9%) chance of 100 bps. I think that will be the main question at the press conference.
I would expect Fed Chair Powell to stress that “getting inflation down is our most important task” and that the Committee has yet to see any “clear and convincing evidence” that inflationary pressures will recede without further tightening. I don’t expect him to commit to anything now, even July. He will probably leave all options open — something about being “data dependent” is the usual response — while indicating that they will probably have to tighten beyond neutral (estimated at around 2.5%). (The minutes from the May meeting stated that “They [participants]also noted that, depending on economic and financial developments, a move to a tighter policy stance could be warranted.”). The June CPI comes out on July 13th, well before the July 27th FOMC meeting. They’ll have lots of time to look for evidence that inflationary pressures are receding – or not.
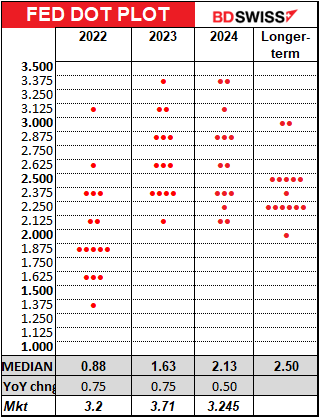
There are likely to be a lot of changes in the Summary of Economic Projections (SEP). With regards to the fabled “dot plot,” showing each Committee members’ forecasts for the fed funds rate at the end of each year, the median dot is likely to rise to somewhere around 3.5% for this year – 100 bps above neutral — and 3.75% or higher for next year. The most important figures will be a) what they see as the “terminal” rate, the highest that they expect the fed funds rate to go, and b) what they see as the “neutral” rate. That’s been 2.4%-2.5% since June 2019. If it moves up, then they’ll have to tighten further to achieve “neutral.”
The median economic projections in the SEP will probably be revised down somewhat but only to a “soft landing” rather than a recession. The unemployment rate will probably be revised up to show the Fed’s determination to tighten even if it causes some pain in the economy.

Market reaction: Given all the foreshadowing of a 75 bps hike, if they hike by 50 bps it will seem to be less than expected and the dollar may fall. A 75 bps hike, although largely discounted by the fed funds market, may not have been fully discounted by other markets and could result in a stronger dollar and lower stocks. And a 100 bps hike…
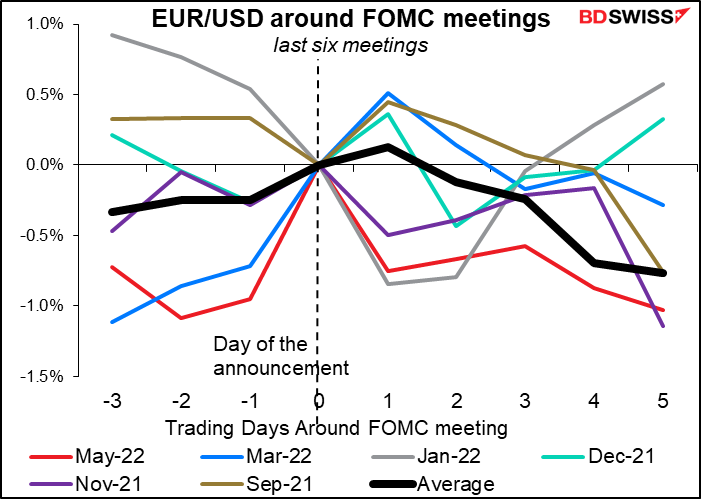
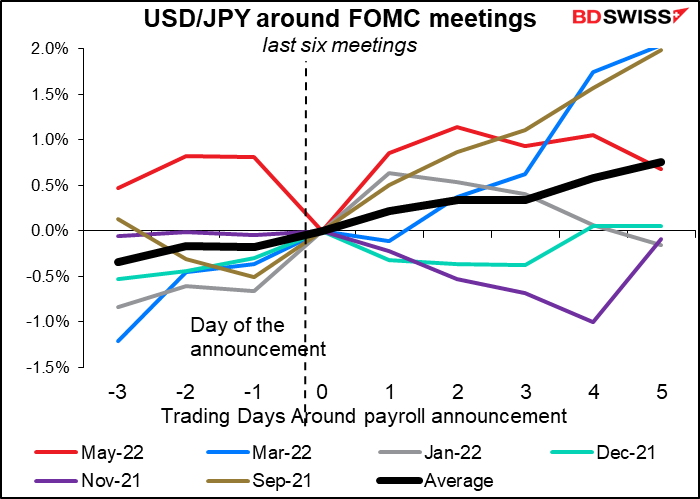
What we’ve seen over the last six meetings is that while the reaction on the next day may be mixed, in the days following the meeting the dollar has generally appreciated. I would expect the same this time too as I expect Chair Powell to make clear his willingness to do “whatever it takes” to get inflation down.
Today’s indicators
The day starts with Eurozone industrial production. Not the biggest indicator on the monthly schedule but I have seen it move the market. It’s expected to show a modest month-on-month gain.

This isn’t spectacular, but the EU as a whole is recovering better than the UK, Japan, or even the EU powerhouse Germany. So it probably won’t be negative for EUR although perhaps not that positive, either.

Next we start a series of European Central Bank (ECB) and other illustrious speakers at the “Young Factor” symposium, which lasts today and tomorrow. The website describes the meeting as
Convinced of the importance of always knowing how to look ahead, the protagonists of the economic and financial world, including the Vice President of the European Central Bank and 6 Governors of central banks, meet young people to discuss the future together.
Well, I guess I won’t be attending.
I doubt whether this is an appropriate venue for central bankers to release a bombshell, but we could have some revelations during the next two days.
Later in the day, ECB President Lagarde will participate in a conversation with Jose Vinals, the Chairman of Standard Chartered Bank, hosted by Baroness Minouche Shafik, Director of the London School of Economics. If you’re interested in watching it you can register here.
US mortgage applications as reported by the Mortage Bankers’ Association (MBA) have been falling precipitously. Fewer mortgages = fewer home purchases. This portends a slowdown in the US housing market.
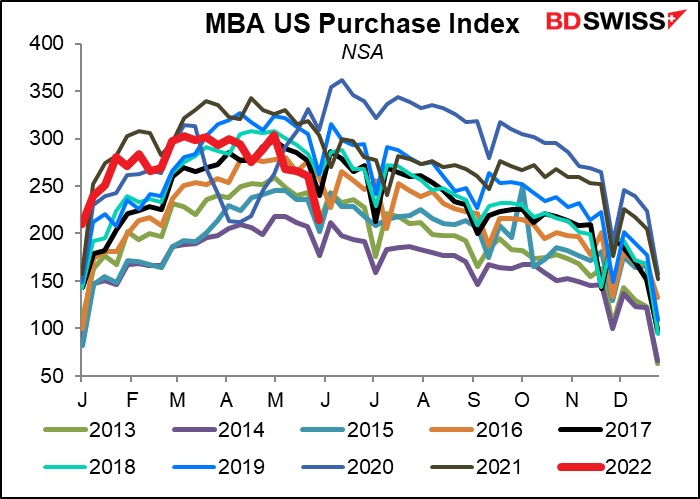
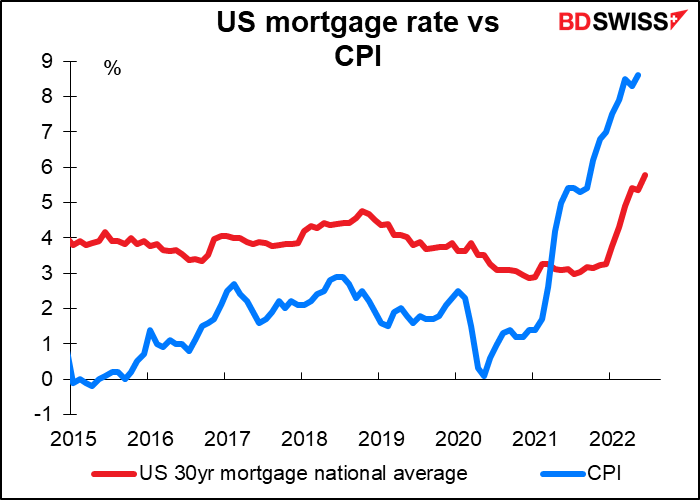
In fact last Friday, after the higher-than-expected US consumer price index (CPI) came out, the US mortgage-backed securities market reportedly went “no-bid,” i.e. there were no buyers at all. The result was a 20 bps jump in the average 30-year mortgage rate to 5.78%. This is up from 3.30% at the beginning of the year. The bond market has been doing a lot of the Fed’s work for it.
On the other hand, it could be that this is a great time to buy a house – you can get a mortgage at an incredibly low negative real interest rate!
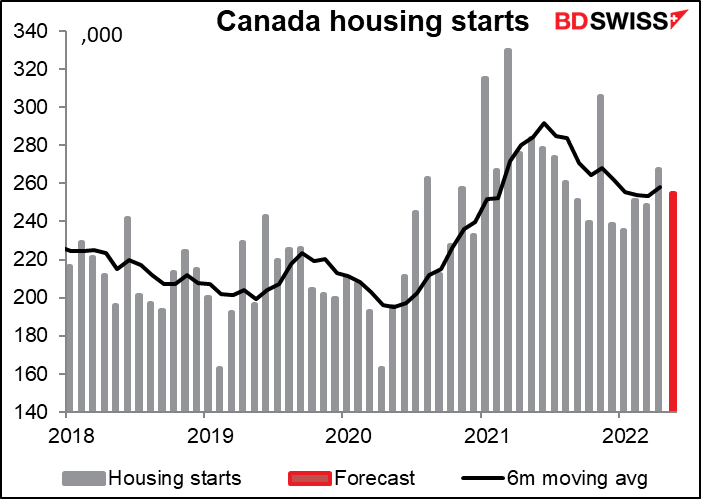
Canadian housing starts on the other hand still seem to be on a tear. May is expected to be down a bit from April, but only a little bit below the six-month moving average. Permits have been growing, with multi-units accounting for a lot of the increase. In any case, even if housing starts are slowing, it’s slowing from “exceptionally high levels,” as the Bank of Canada said, so it shouldn’t worry anyone.
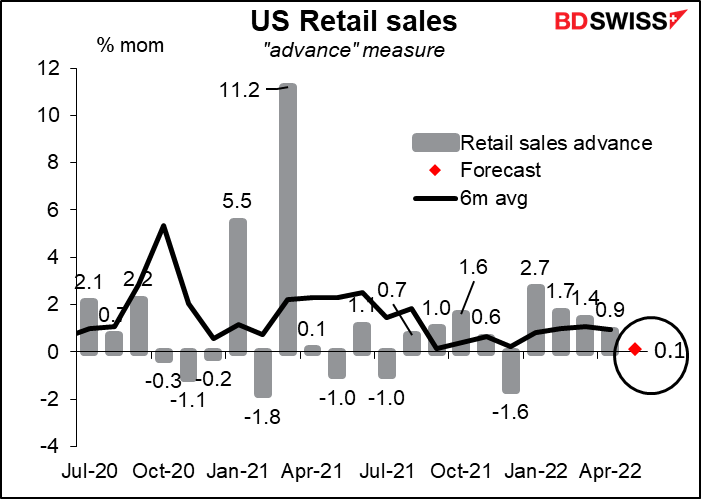
US retail sales is the last data point that could influence Committee members’ forecasts for the SEP. The drop in auto sales during the month will weigh heavily on the headline figure, which is expected to show only a small increase.
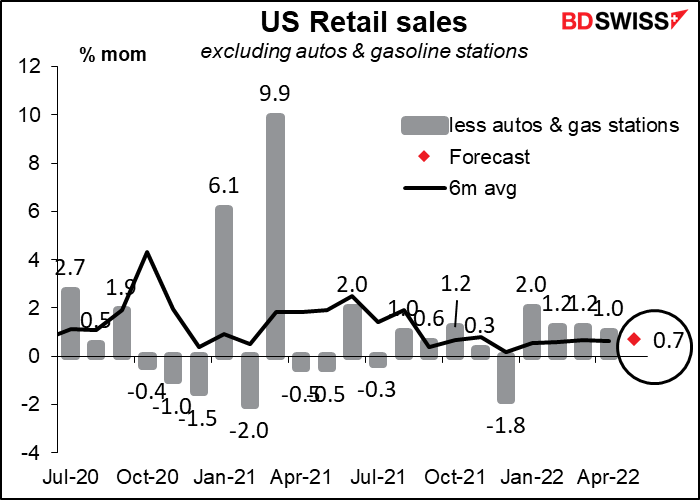
Sales excluding autos should perform significantly better – although the figure will be artificially boosted by a 5.9% rise in seasonally adjusted gasoline prices. But even if we exclude sales at gasoline stations, the market is looking for a fairly healthy rise equal to the six-month moving average. That may help to reassure people that even though consumer sentiment is very low, consumers are still out there…well, consuming.
Although this is a major indicator for the US, the FX market’s reaction isn’t straightforward.


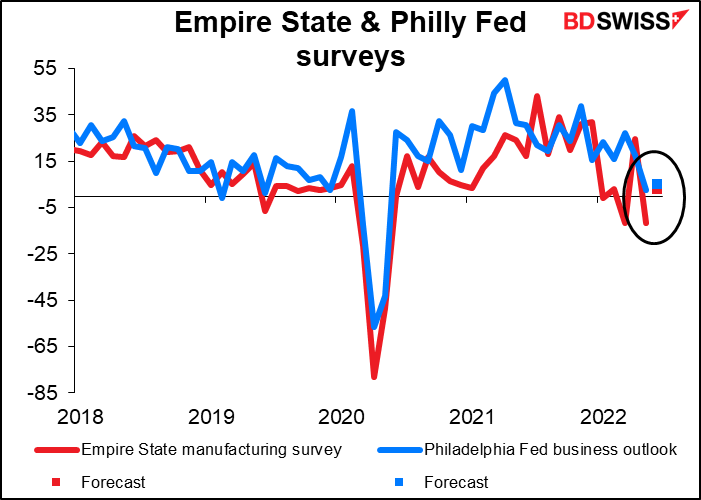
Despite the massive 36.2-point plunge last month, the market is looking for a rebound in today’s Empire State manufacturing survey back into positive territory. It’s also expecting a small rebound in Thursday’s Philadelphia Fed business outlook.
OK that should be enough for one day…
There’s a lot going on overnight too! New Zealand is the last of the G10 countries to release its Q1 GDP figure. It’s always the last. The market is going for +0.6% qoq, which is slightly softer than the 0.7% qoq forecast that the Reserve Bank of New Zealand (RBNZ) had in its May Monetary Policy Statement. Economic activity during Q1 was mixed, while the omicron wave in February and March weighed on consumer spending.
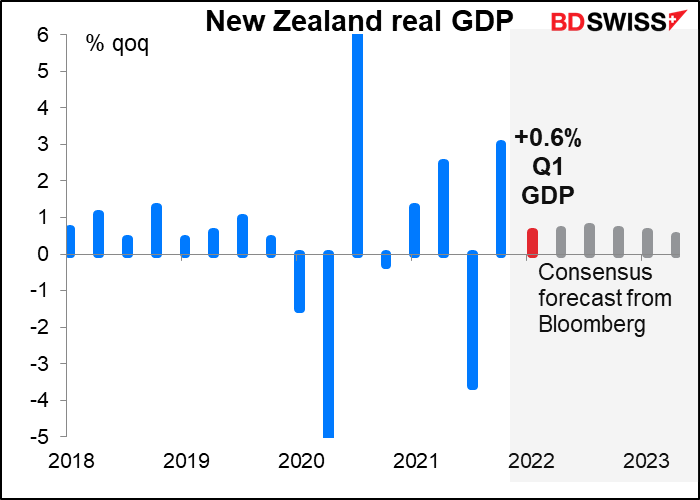
New Zealand’s recovery so far has kept pace with Australia’s although they are expected to diverge in coming months. They are both surpassing Canada, the other commodity currency country.

Japan’s trade balance is expected to plunge further into deficit.
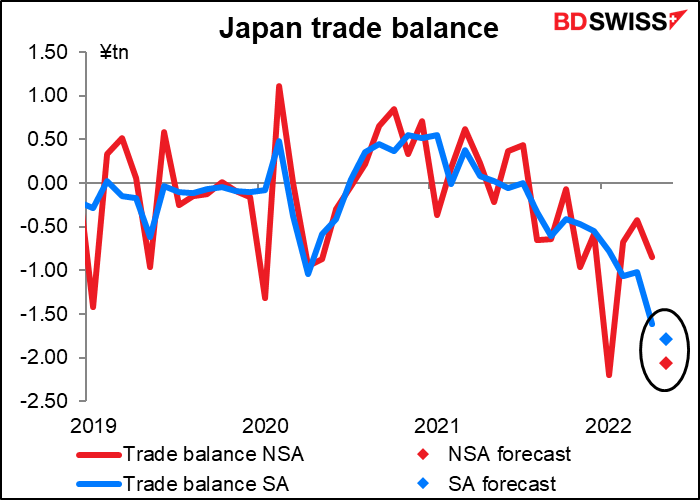
What’s going on here? Both exports and imports are rising from their year-ago level, but imports are rising much faster than exports. Part of that is no doubt changes in price rather than changes in volume.

The value of imports has risen above exports and is expected to rise further this month.
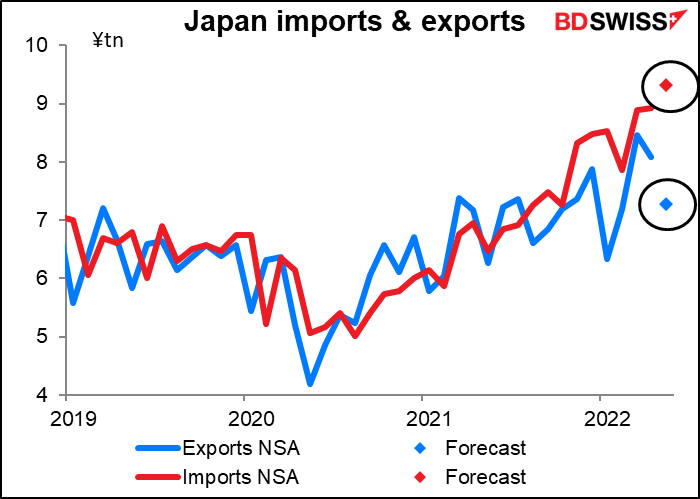
But if we look at the Bank of Japan’s indices of real exports (stripping out the impact of prices) exports have risen much more than imports. So there is a large element of price changes here.

In short, Japan’s terms of trade are getting worse. (Terms of trade = the price of what the country exports relative to the price of what it imports.) The country’s terms of trade have been deteriorating since the pandemic began. This is another factor dragging the yen down.

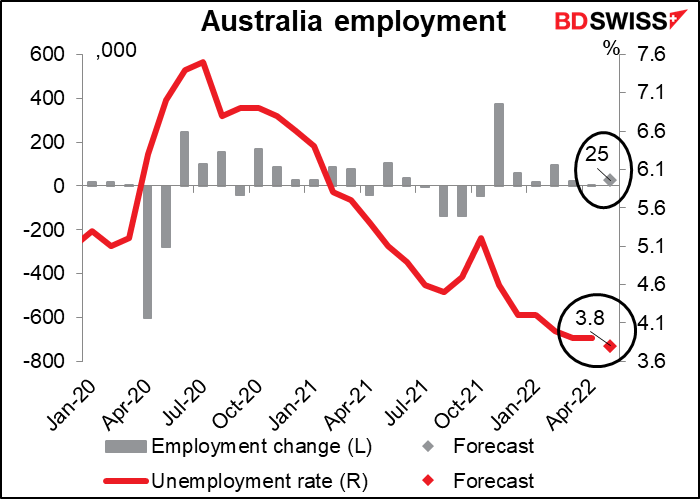
Finally, Australia releases its employment data. This is the last noteworthy data point before the Reserve Bank of Australia’s July 5th meeting. However it probably won’t have much effect on their decision because Australia, like the US, has effectively hit full employment. The unemployment rate in March and April was at a record-low 3.9% (data back to 1978) and is expected to fall a further 10 bps this month. Thus employment is not constraining the RBA from tightening policy. Instead they’ll focus on inflation. Nonetheless a further fall in unemployment to a record low could be construed as positive for AUD.