Rates as of 05:00 GMT
Market Recap
Conflicting signs.
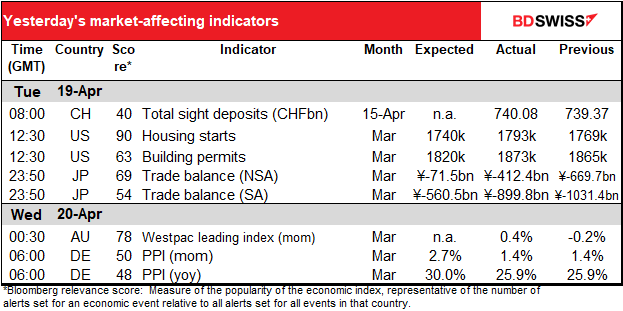
On the one hand, investors were encouraged about the US economy yesterday thanks to higher-than-expected US housing starts. As the table above shows, they were expected to fall but instead rose slightly to the highest level since 2006.
The US housing market seemed to have shifted into a new equilibrium that depended on low interest rates, which made it likely that the Fed’s tightening would cause the market to crash and send the US economy into recession. Yesterday’s figure gives hope that housing may be shifting back into the previous pre-Global Financial Crisis state, when demand depended less on low interest rates. That reduces the odds that the Fed’s tightening will send the US economy crashing.

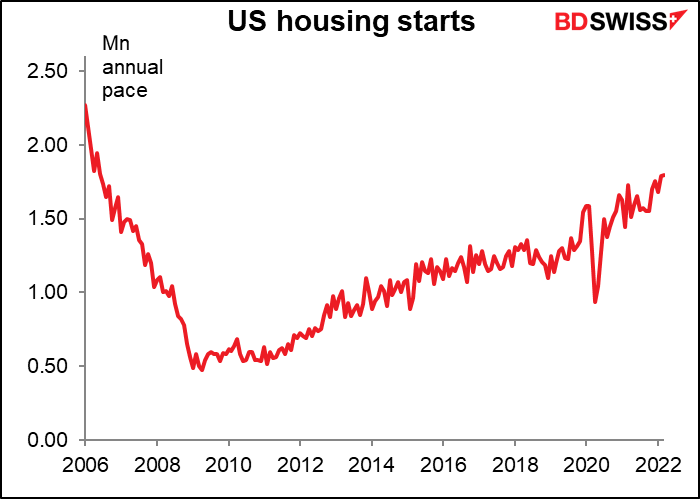
What surprises me though is just how low housing starts are. While they are above the long-term average of a 1.43mn annual pace, they are still well below the 2.27mn peak pace of 2006 not to mention the all-time peak of 2.48mn in 1973, when the population of the US was around 215mn vs over 330mn today. This explains why housing is so expensive in the US. It also suggests that starts can continue to rise if builders can find workers and materials (a big “if”).
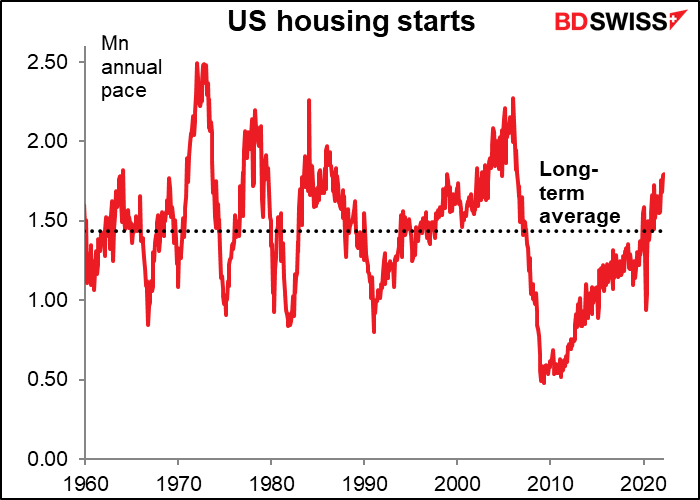
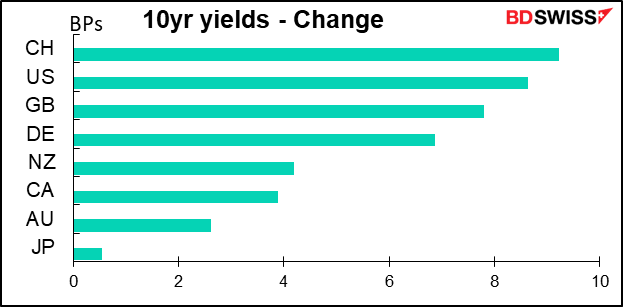
US yields moved sharply higher as a result. US 30-year yields rose 5.4 bps to poke their nose over 3.0% intraday for the first time since early 2019. Ten-year German Bunds rose to 0.91%, the highest since 2015. They were negative as recently as March 7.
Without a similar surge in inflation expectations, this meant a big rise in real yields globally – except of course in Japan, helping to fuel the decline in the yen. The US real 10-year yield briefly traded in positive territory for the first time since the pandemic hit.
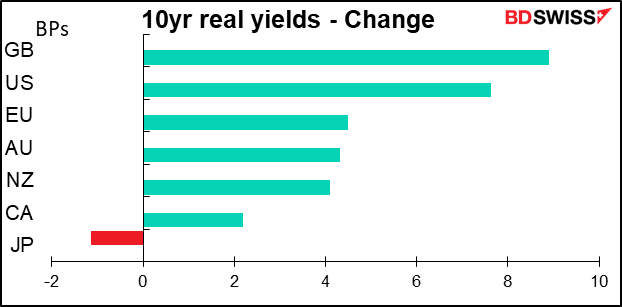
The surge in CHF yields may be due to yesterday’s comments by Swiss National Bank President Jordan, who said he thought the recent rise in Swiss inflation was temporary, but added that “there is a relatively big risk that some of this temporary inflation the feeds into permanent inflation…” It’s then a mystery why CHF was the worst-performing currency on the day when its 10-year yields jumped so much. Perhaps this represents a “catch-up” move on the part of CHF after JPY has weakened so much? Maybe it reflects the polls showing that French President Macron is likely to win in Sunday’s second-round election, which reduces the need for a safe-haven in Europe? Or maybe it’s just resurgent USD strength. USD/CHF rose to the highest level since June 2020.
On the other hand, markets were stunned by the International Monetary Fund (IMF)’s downward revision to its growth forecast. Its new World Economic Outlook cut the forecast for global growth this year to 3.6% from 4.4% estimated just in January and their forecast for next year to 3.6% also, down from 3.8%. The IMF revised down its forecast for the Eurozone by an especially steep 1.1 percentage points to 2.8% due to the indirect effects of the war.
Oil prices were falling ahead of the release and the fall accelerated afterward.

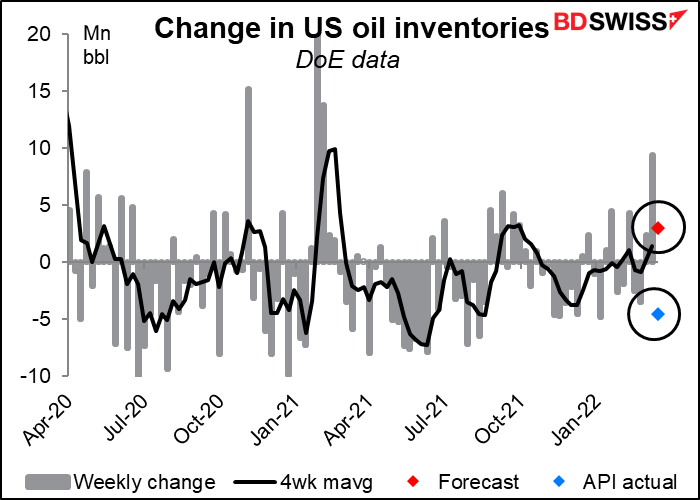
A report from the American Petroleum Institute (API) that US oil inventories had fallen by 4.5mn barrels during the latest week helped to stop the decline in prices. Falling inventories suggest that demand for oil is exceeding the supply and is therefore bullish for oil.
The US Department of Energy will release the official figures later today – analysts had expected to see an increase in inventories of around 3.0mn barrels (see table below). It’s not unusual for the two series to diverge week-to-week although over the longer term these differences tend to even out and the two series trend together.
Today’s market
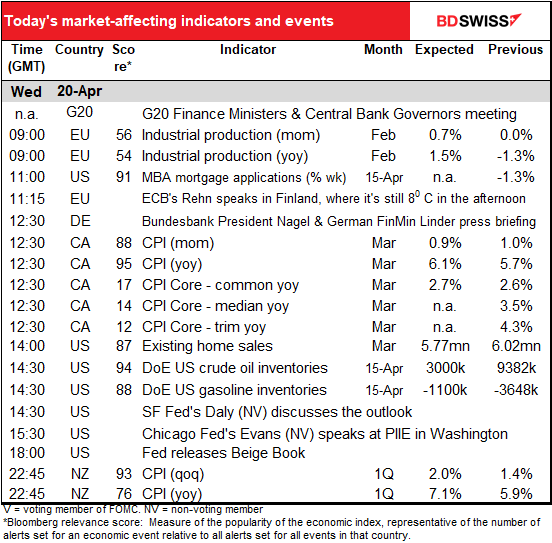
Note: The table above is updated before publication with the latest consensus forecasts. However, the text & charts are prepared ahead of time. Therefore there can be discrepancies between the forecasts given in the table above and in the text & charts.
The day starts out with the Eurozone industrial production figures, which do occasionally move the FX market.
Eurozone IP hasn’t been doing all that well recently. The six-month moving average of the month-on-month changes (not shown) is a mere +0.1%. So today’s expected result of +0.7% mom could be seen as a big improvement.
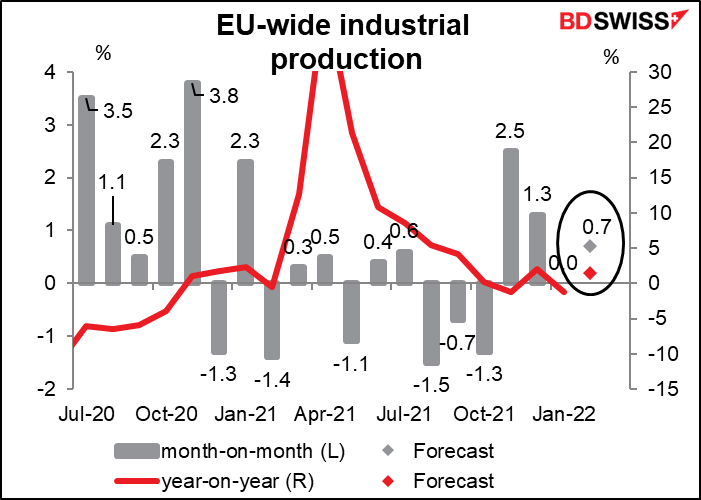
Even so, the year-on-year forecast of +1.4% yoy is below what the manufacturing purchasing managers’ index (PMI) would suggest.

That may be because the Eurozone bounced back faster than most other regions after the pandemic began. Even with the relatively weak figures out recently, the Eurozone’s industrial output has been doing better than the UK or Japan, or even Germany for that matter (although not better than the US).

This is one of those statistics where the market takes some time to pay attention, thereby providing the patient trader with some opportunities. The reaction to the figure after one hour is clearly more correlated with the data than the reaction after five minutes (even if we knock out that anomalous 0.37% decline in EUR/USD one month). As always, remember that past performance is no guarantee of future performance though.

Sometime during the US day there will be a meeting of the G20 Finance Ministers and Central Bank Governors in Washington “to discuss the impact of the conflict in Ukraine on global economic conditions.” US Treasury Secretary Yellen will attend but may boycott some of the meetings because Russia will attend. Last week she said Russia should be expelled from the group. G20 host Indonesia said there was no way not to invite a member of the group so they couldn’t dis-invite Russia, but they said that they were thinking of inviting Ukraine too. I expect that this meeting will be significant mostly as a “roll call” of countries’ views on Russia. I don’t expect any market-affecting decisions, especially with the group so split.
(The Group of 20, you may know, is an intergovernmental forum comprising 19 countries and the European Union. It works to address major issues related to the global economy, such as international financial stability, climate change mitigation, and sustainable development. Originally there was the Group of Seven major industrial countries but then it was realized that they no longer controlled the world by themselves so another group was created that included major developing and non-Western countries too, such as Russia, China, India and Saudi Arabia.)
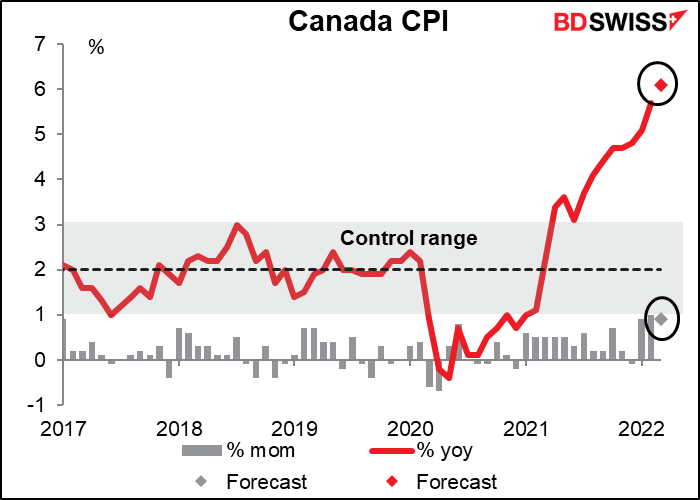
Canada’s consumer price index (CPI) is wildly above the Bank of Canada’s target range and is expected to move even higher. This will be no surprise to the Bank of Canada, which last week forecast that “CPI inflation is now expected to average almost 6% in the first half of 2022 and remain well above the control range throughout this year.” Nonetheless, a further rise could still affect the FX market.
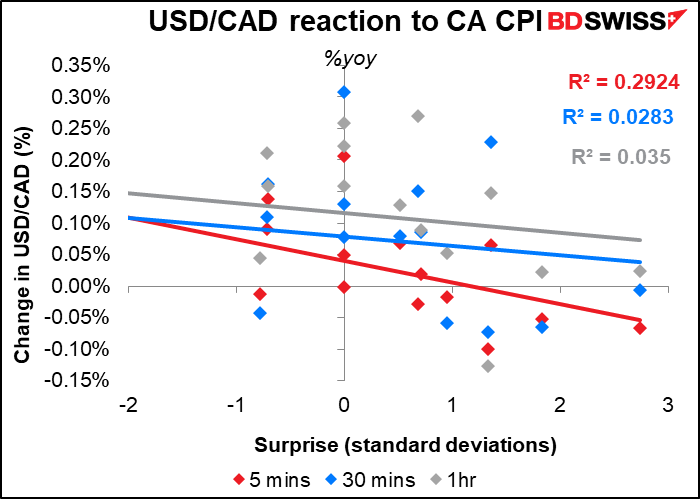
Should you watch the mom or yoy figure? The reaction is slightly better to the miss or beat in the yoy figure, which has the higher Bloomberg relevance score, but the difference isn’t significant. The impact seems to fade rather quickly though so this indicator might be best for short-term scalping.
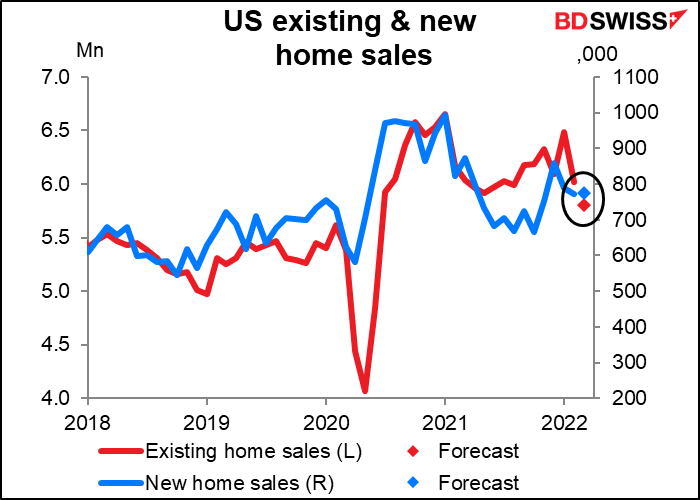
US existing home sales are expected to be down 3.7% mom while new home sales, due out next week (April 26th) are expected to be up 0.4%. I have no idea why the difference except to note that since 2010 they’ve only moved in the same direction 54% of the time so it’s quite normal for one to be down and other to be up.
Existing home sales are estimated to be 5.8mn, which is getting close to the 5.62mn in February 2020, the month before the pandemic hit. This suggests that the post-pandemic rush to move to the suburbs may be finishing up and the market is getting back to normal – although I say that without knowing anything about changes in where the houses are being sold, which would make a big difference.
The Fed releases the “Summary of Commentary on Current Economic Conditions,” aka The Beige Book as always two weeks before the next FOMC meeting. It’s significant for the market because the first paragraph of the statement following each FOMC meeting tends to mirror the tone of the Beige Book’s characterization of the economy. The Beige Book is largely anecdotal – there’s no official “Beige Book index” or other number associated with it –so you’ll just have to watch the headlines as they come out.
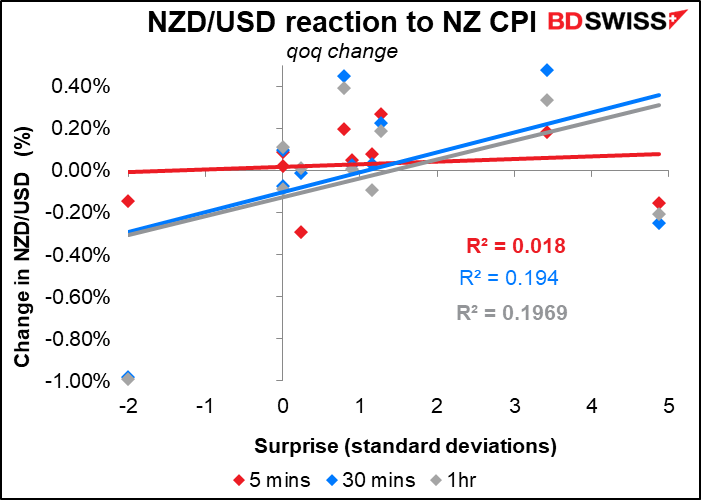
Overnight New Zealand announces its consumer price index (CPI), always a biggie these days and especially for New Zealand, which only announces the data quarterly.
The figures are expected to be wildly out of line with the Reserve Bank of New Zealand (RBNZ) 1%-3% target range. Indeed, the expected quarter-on-quarter increase of +2.0% qoq would be right on target for a year-on-year increase! Needless to say the RBNZ has already noted the above-target inflation and has hiked its official cash rate from 0.25% to 1.5%, most recently with a 50 bps hike last week.

For those interested in trading this indicator, I suggest trading AUD/NZD rather than NZD/USD as the former is better correlated with the miss or beat than the latter. Watch the qoq change, not the yoy change. (These charts cover 2019, Q1 2020, and 2021 on – they eliminate Q2, Q3, and Q4 2020 as the RBNZ was on hold then.)