Rates as of 05:00 GMT

Market Recap
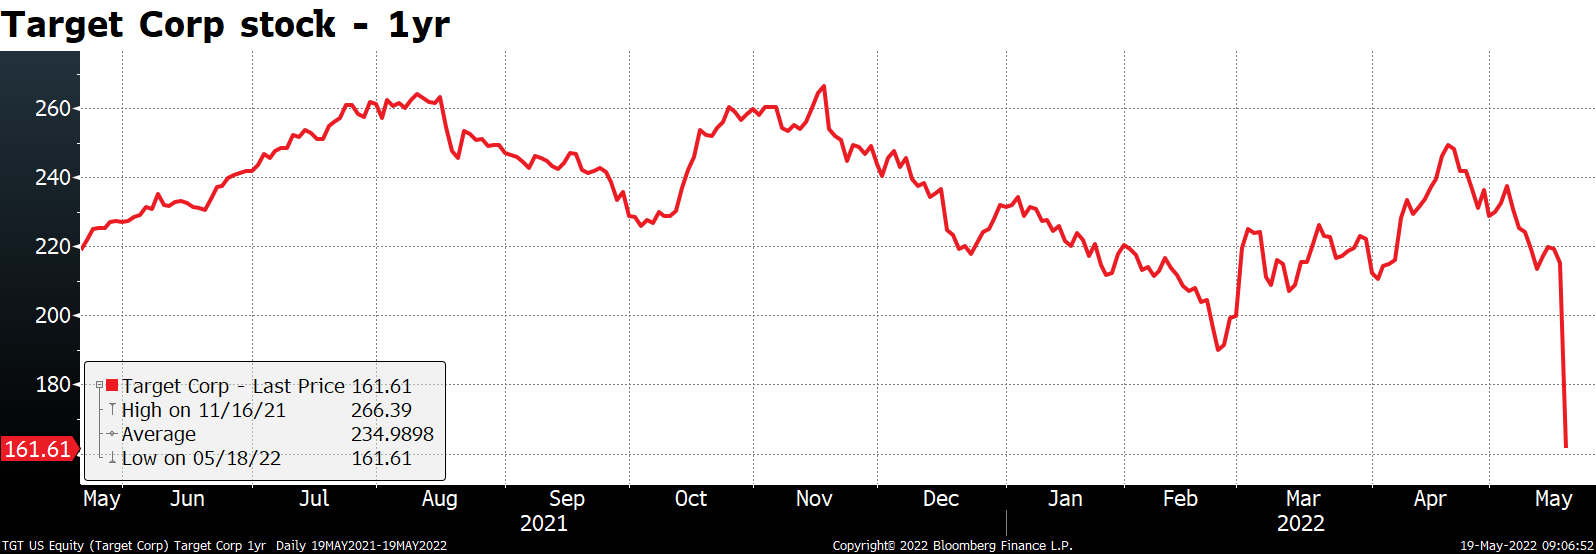
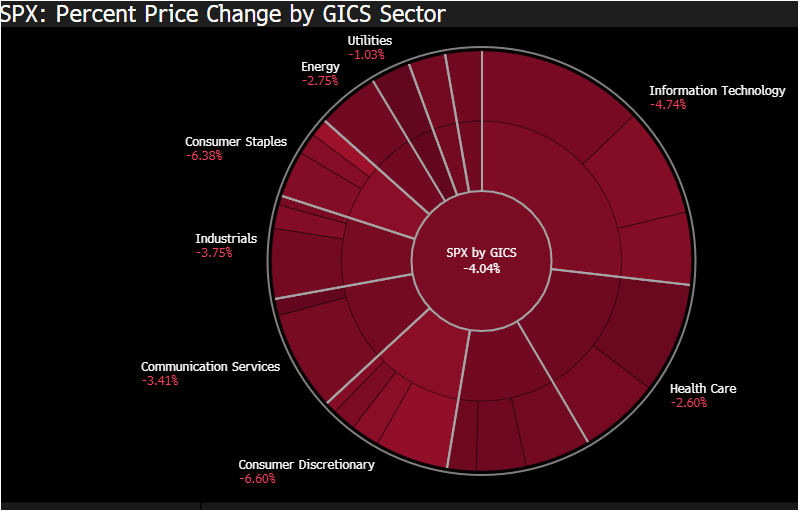
A profit warning hit the target – Shares in US retailier Target Corp. were down as much as 28% at one point yesterday after the retailer missed profit forecasts and warned of a hit to margins from sales slowdown and excess inventory plus rising fuel and freight costs. It also noted a larger-than-expected shift in consumer spending away from stay-at-home categories like furniture and TVs as people resume spending money on services (Wednesday’s retail sales figures for example showed record spending at bars, restaurants, and cafes). That in turn weighed on the share prices of other leading US retailers, especially after Walmart had also highlighted margin risks the day before. Consumer staples (-6.4%) and consumer discretionary (-6.6%) were the worst-performing sectors in the S&P 500.
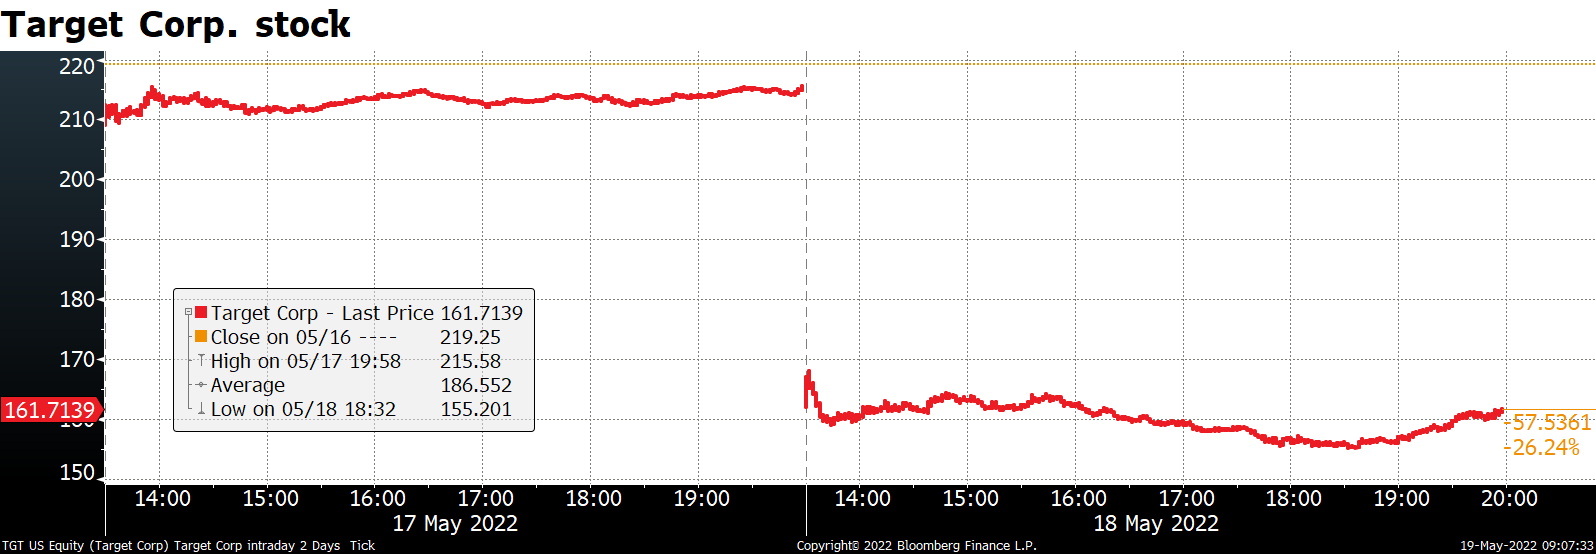
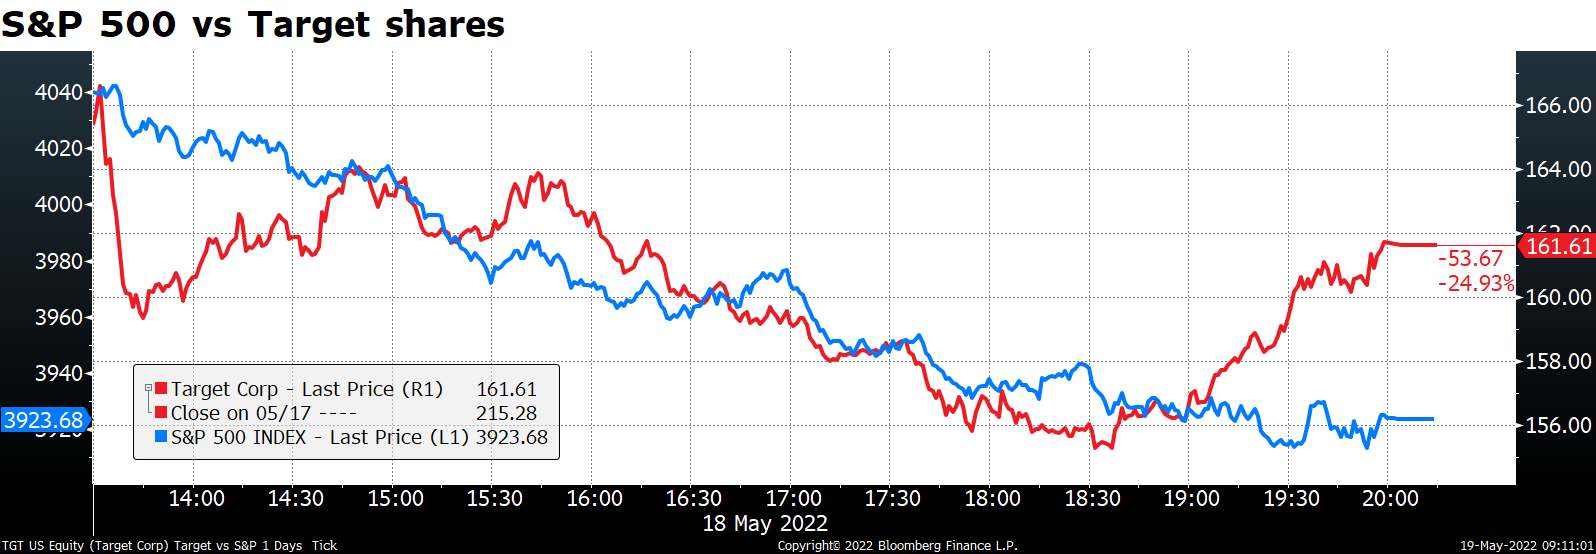
The anxiety over the impact of high inflation on corporate earnings and consumer demand sent the whole market down. Note that while the S&P 500 followed Target stock price for much of the day, Target started to recover a bit near the close but no such luck for the market as a whole.
Kind of strange – shares in service-sector companies should be rallying on this news, because after all if people aren’t spending their money on TVs they must be spending it on something else — but every sector was down. In fact only eight stocks in the entire S&P 500 were up on the day!
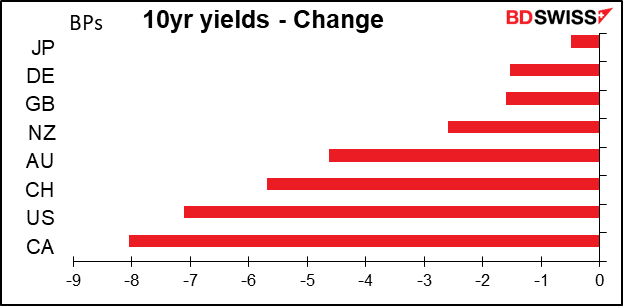
This time though the fall in stocks was met with a rally in bonds, unlike previous sell-offs that have been driven by fears of Fed tightening.
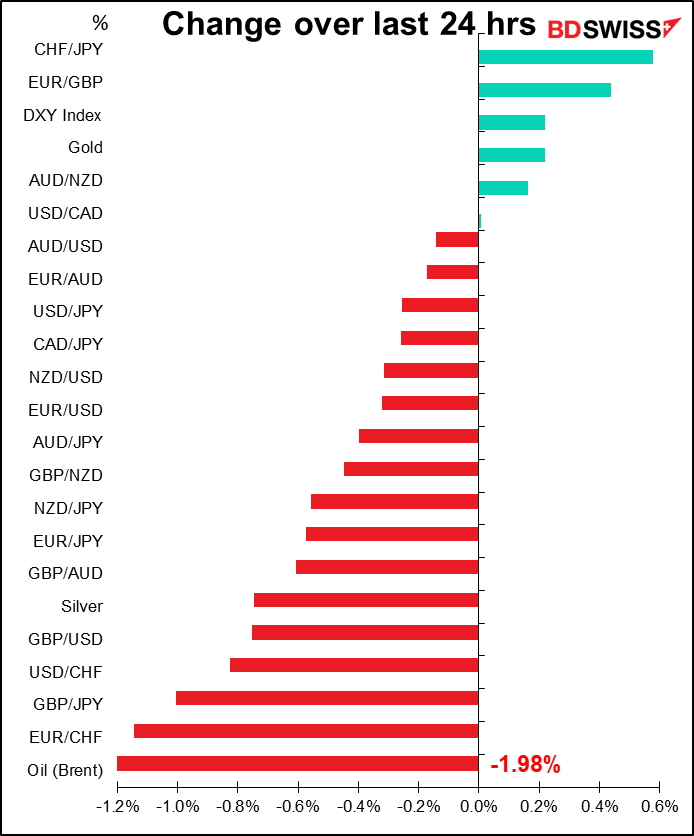
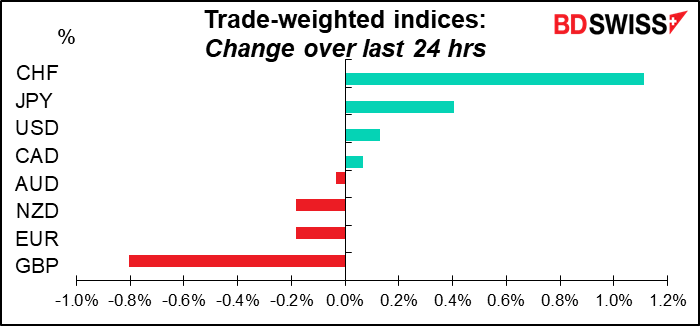
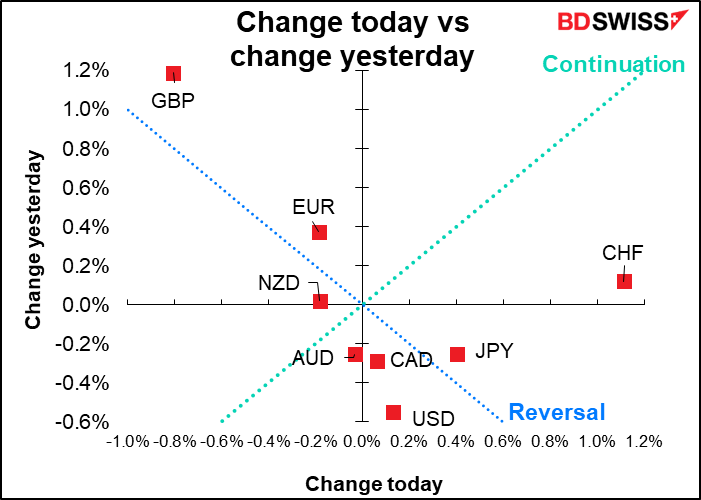
One might’ve thought that the rally in CHF was due to risk aversion, but apparently not. It started moments after Swiss National Bank (SNB) President Jordan got up and started speaking (a speech that I failed to note in my daily calendar of events, much to my eternal shame). He said that he sees stable Swiss prices despite shocks, but that “the SNB will take care to maintain price stability.” “We see the risk of second-round effects,” he noted.
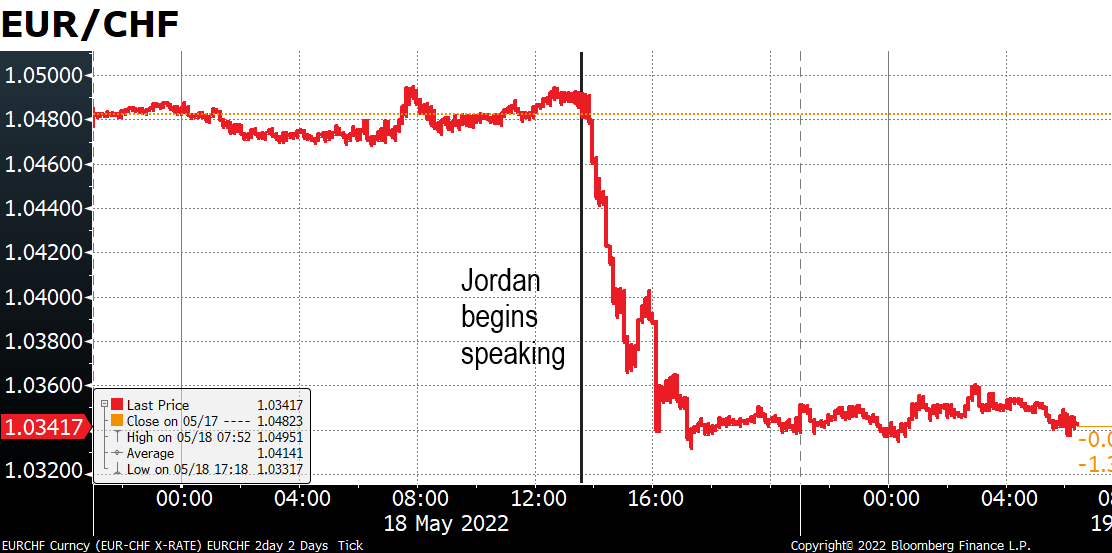
Jordan didn’t say what the SNB would do in response, but the last time inflation in Switzerland was this high the policy rate was around 2.75%, not -0.75%, the lowest in recorded history. They could raise rates or they could let the currency appreciate further, which would lower the cost of imported goods, especially energy.

Jordan didn’t say what the SNB would do in response, but the last time inflation in Switzerland was this high the policy rate was around 2.75%, not -0.75%, the lowest in recorded history. They could raise rates or they could let the currency appreciate further, which would lower the cost of imported goods, especially energy.
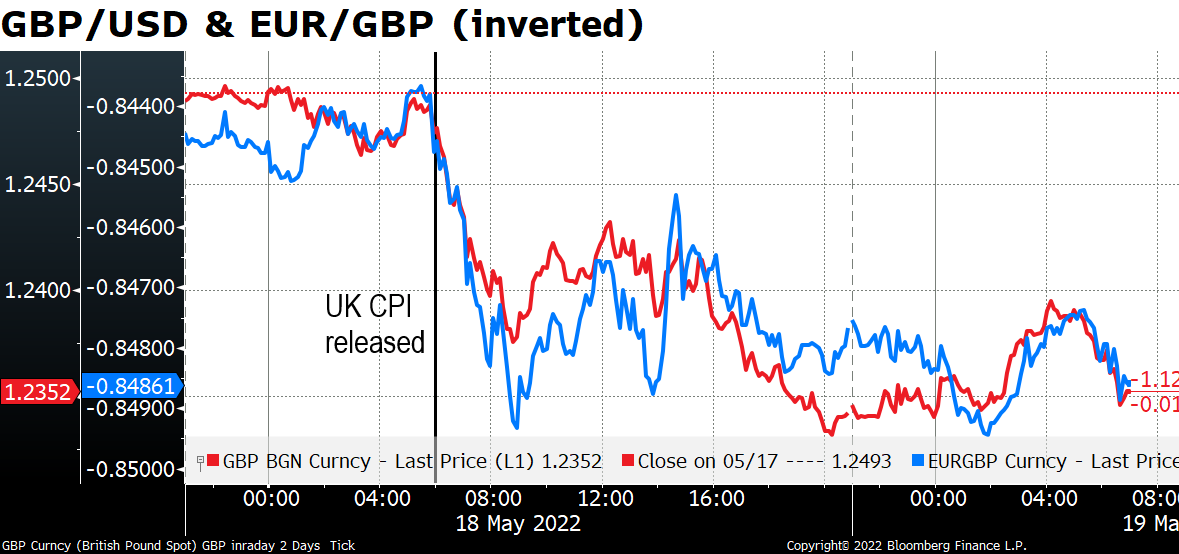
Elsewhere, GBP fell after the UK CPI for April missed estimates. I wouldn’t have thought that the tiny difference between the forecast 9.1% yoy and the actual 9.0% yoy was that significant. I mean, 9.0% is still a 40-year high (since March 1982) and the highest rate in the G7, not to mention in line with the Bank of England’s forecast. Once inflation is up at that level who cares about 10 bps? Apparently someone does.
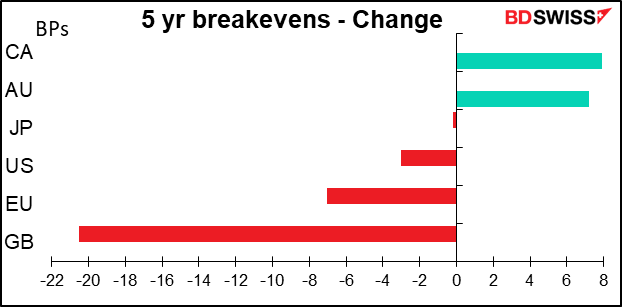
The news caused a major rethink of the outlook for UK inflation and UK breakeven inflation rates fell sharply, a move not echoed elsewhere. This too is kind of bizarre, because in addition to energy, higher services and food prices also were major drivers of inflation. Higher service prices connect the CPI print to the Target earnings results – as the pandemic unwinds, people are buying fewer goods and instead buying more services. Services are more labor-intensive and therefore more sensitive to the tight labor market that many countries, including the UK, are currently experiencing. This shift may entrench relatively high inflation into economies for some time even as the pandemic supply chain difficulties unwind.
Nonetheless, I agree with the pound’s direction. Not because of the CPI but because of the impending showdown between Britain and the EU over the Northern Ireland protocol.
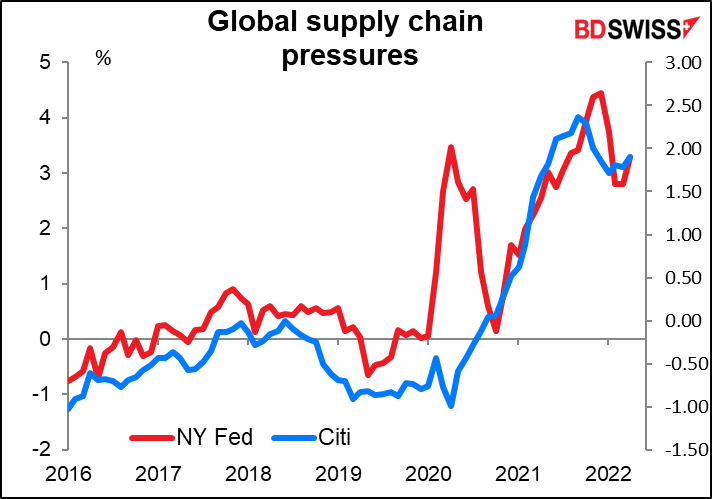
Speaking of supply chain pressures, the New York Fed has updated its “Global Supply Chain Pressure Index.” It peaked in December, fell in January and February, was steady in March, but unfortunately started rising again in April, probably due to the lockdown in Shanghai. In any case it remains far from normal, which suggests upwards pressure on goods prices is likely to remain for some time and central banks will have to confront the “inflation vs growth” trade-off.
Do you trade the pound? If so you might be interested in this video, which shows how the portrait of Queen Elizabeth on the pound note has aged over the years.
And yes, I do spend entirely too much of my time scrolling through Twitter.
https://twitter.com/nocontextviral/status/1525967824375762946
Today’s market
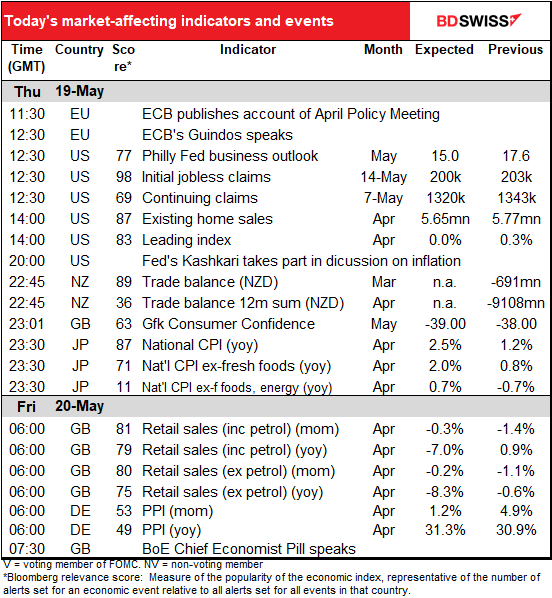
Note: The table above is updated before publication with the latest consensus forecasts. However, the text & charts are prepared ahead of time. Therefore there can be discrepancies between the forecasts given in the table above and in the text & charts.
The European day starts with the account of the European Central Bank (ECB) April Policy Meeting. They didn’t change any policies at the meeting so there’s a limited amount that we can glean from the minutes. During the press conference and Q&A session ECB President Lagarde seemed to emphasize the upside risks to inflation more than the downside risks to growth. There was also a higher conviction that the ECB would end its quantitative easing under the Asset Purchase Programme (APP) in Q3. As usual they stressed gradualism, flexibility, and optionality, but they didn’t rule out a rate hike in July.
Since the meeting, we’ve heard from a number of Council members who have indicated that there’s widespread support for ending the APP net purchases in June or the start of July and hiking rates at the July 21st meeting. The accounts will therefore be scrutinized for insight into any conditions that could delay or even derail this process.
One other point to watch for: at the press conference, ECB President Lagarde gave the clearest hints so far that the ECB would be willing to develop a “stability purchases tool” to counter fragmentation in the bond market if it occurs.* (“We will design whatever additional instrument is appropriate in order to deliver the flexibility that we believe is useful,” she said.) However, President Lagarde said that this new tool would be “something that will be incorporated if warranted,” i.e. it won’t be prepared in advance. The market will therefore be looking to see what conditions could lead the ECB to activate it and step in against market fragmentation. That will help the market evaluate the sustainability of the hiking cycle.
*The problem is that the ECB’s main bond purchase program is required to buy bonds of the various member states in particular ratios, which ties their hands if one or two countries such as Italy or Greece get into trouble and need more attention than the others.
When the US starts up, we’ll get the Philadelphia Fed business outlook survey. The market usually looks for the Empire State and Philly Fed indices to converge every month, that is, for the higher one to fall and the lower one to rise. The forecast this time was for both to fall and converge at 15. WRONG! The Empire State index collapsed from 24.6 to -11.6, a massive 36.2-point move. (Of course, this followed a 36.4-point increase the previous month, bringing the index back almost exactly to where it was, so maybe it’s not that surprising.)
Looking at the graph, the Empire State index looks a lot more volatile than the Philly Fed index. It’s quite possible that the Philly Fed will see a much smaller move. That might reaffirm the message from Tuesday’s US retail sales and industrial production that the US economy remains healthy, which could be good for stocks and good for the commodity currencies. Whether it’s good for the dollar seems to be in doubt at this point though.
The two only move in the same direction 53% of the time, which is pretty much a coin toss, so there’s no guarantee that the index will be down at all.

Initial jobless claims last week missed estimates. Did anyone care? Not really. They’re still at a historically low level so plus or minus a few thousand doesn’t matter. If the uptrend continues it could start to be a topic of conversation again sometime but I’m not concerned yet.

Today’s US existing home sales are expected to be down 2.1% mom while next week’s new home sales are forecast to be down 0.7% mom. This data is for April. Tuesday’s big drop in the National Association of Home Builders (NAHB) index (-8 to 69) was for May; in April the index only fell two points (to 77), so a modest drop in sales is consistent. Housing is an important indicator because it’s one of the main ways that the Fed’s monetary policy is transmitted to the economy. If it slows the housing market, then the Fed won’t have to tighten so much, but if housing keeps roaring, then they’ll have to tighten further. Thus a steady sale of new homes would tend to be positive for the dollar.
However the odds are in the opposite direction. Yesterday’s US housing starts were lower than expected while the previous month was revised down sharply. Perhaps housing is already starting to turn?

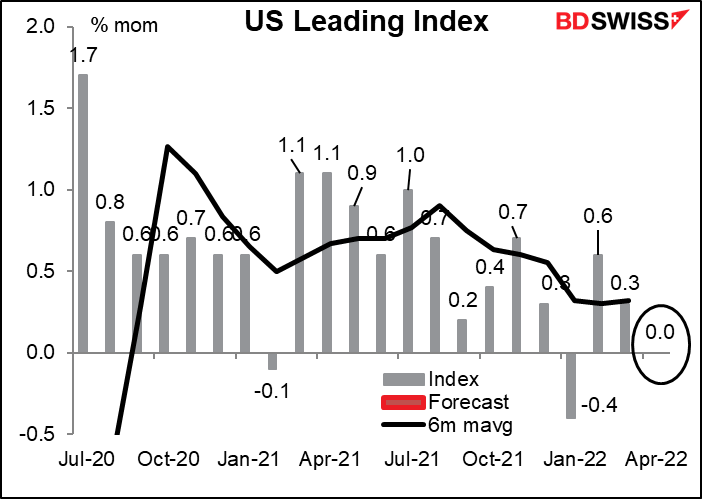
The US leading index is expected to be a worrisome zero. The index is calculated from other indices that have already been released so I don’t see what the big deal is, but it does seem to have a following. A zero reading would be worrisome as people mull over the possibility of stagflation: sluggish growth but with continued high inflation. As you can see from the chart, one month doesn’t make a trend, but then again, the index has been trending lower. One redeeming feature: zero isn’t a negative number.
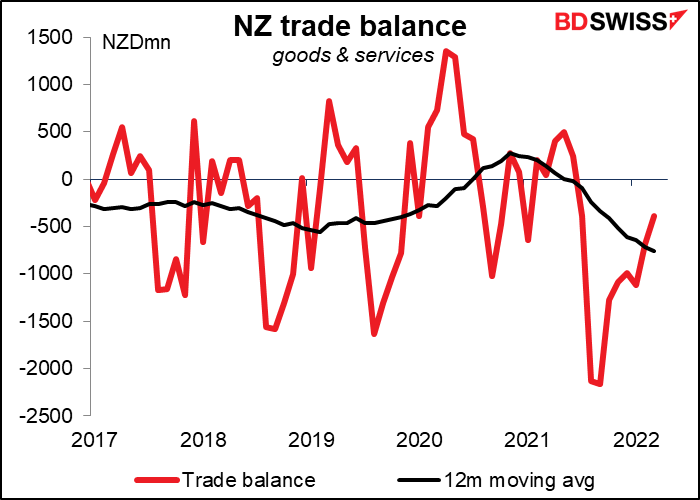
There’s no forecast for the New Zealand trade figures, but I thought I’d thrown in a graph anyway just to be a nice guy. The figures aren’t seasonally adjusted so the 12m moving average is probably the best way to look at it. It will take a trade surplus of NZD 400mn to keep the 12m moving average constant.
Now comes the huge, ginormous indicator that I’m sure you’ve been waiting all week for: the Japan national consumer price index (CPI). Why is this such a blockbuster indicator? Because except for three brief months in 2008, this is expected to be the first time since 1993 that it’s over the Bank of Japan’s 2% target (2.5% yoy, to be precise) without a hike in the consumption tax. (Obviously if you raise the consumption tax, aka sales tax, by 2 percentage points, consumer prices will generally rise by 2 percentage points too, so that doesn’t count as inflation.)
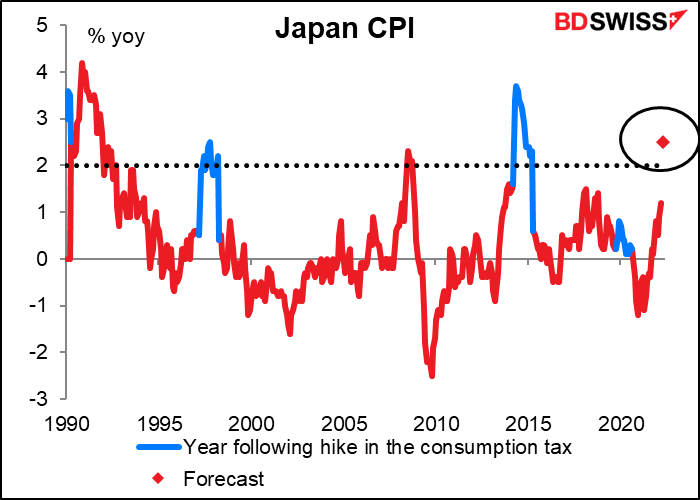
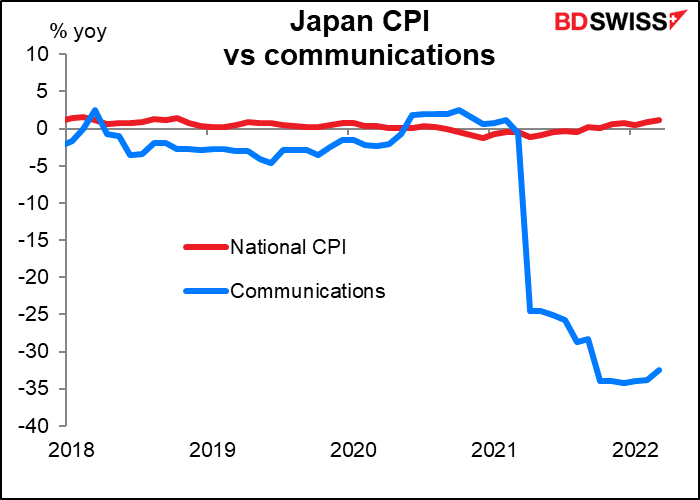
The reason for this is that the huge decline in mobile phone charges that took place in April 2021, which has been depressing the overall CPI, will finally fall out of the calculation.
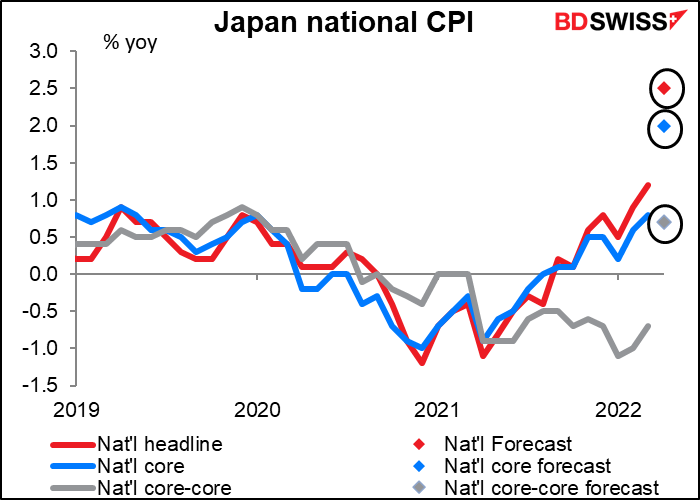
Can we expect fireworks in Nihonbashi, the area of Tokyo where the Bank of Japan is located? Hardly. The Summary of Opinions from the April Bank of Japan meeting showed that most members of the Monetary Policy Board remain skeptical about whether inflation will remain sustainably above their 2% target so long as the output gap, the difference between what Japan can produce and what it does produce, remains wide. Some members are still worried about the downside risks to inflation!
Note too that the “core-core” rate of inflation (grey line), excluding energy and fresh foods (same as core inflation in other countries), is expected to be up only +0.7% yoy. This is a big turnaround from deflation of -0.7% yoy in March but still it’s hardly the kind of rise that’s causing panic in central banks in other countries.
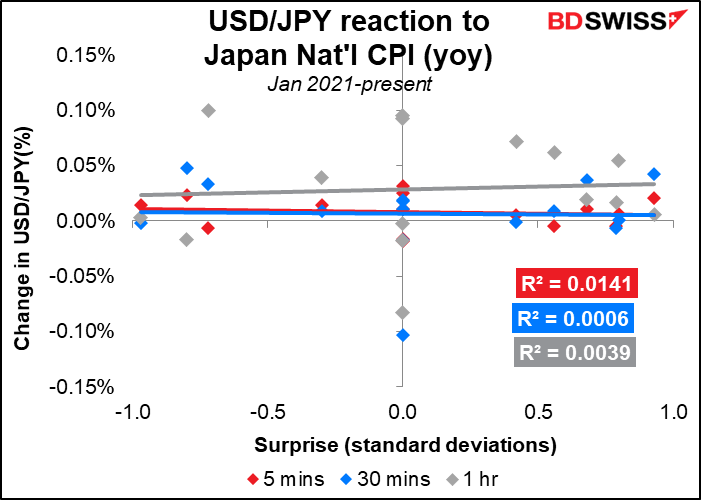
Unusually, the Japan CPI hasn’t had that big an impact on the currency. This is probably for two reasons. One, it hasn’t been very volatile and the actual figure has been pretty much in line with forecasts. Since Jan. 2021 the market consensus forecast was within ±1 standard deviation of the actual, and four times it was spot on. Secondly, and perhaps more importantly, there was no hope of a reaction from the Bank of Japan. They are more or less maxed out on their easing policies and of course there’s been no chance that the figure would trigger any tightening.
This may change from now on if inflation stays above their 2% target. The first thing I would look for would be a widening of the band in the BoJ’s “yield curve control” program, which keeps the benchmark 10-year yield within a ±25 bps range of 0.0%.
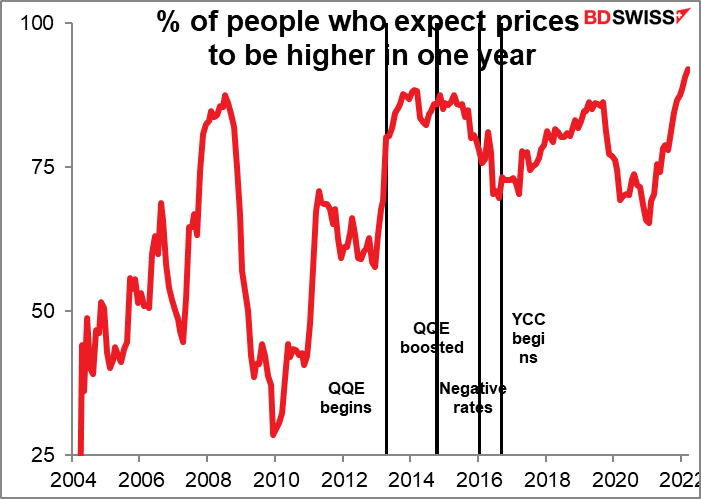
The press will probably pounce upon the number and ask why the BoJ is still running such an expansive policy. The Japan Economic and Social Research’s monthly survey shows that 93% of respondents think prices will be higher a year from now, the highest since the survey began in 2004. Believe it or not, many Japanese are starting to get uncomfortable with inflation as food prices rise. I think we can probably expect some speeches to explain the BoJ’s policy to the world.
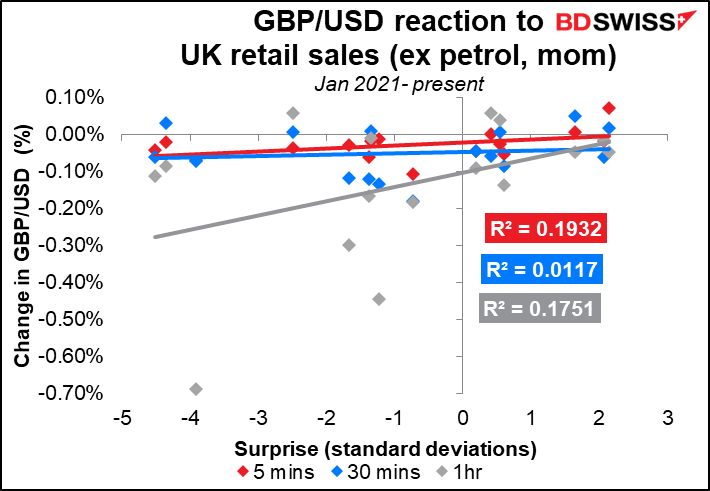
Then early Friday morning, Britain announces its retail sales figures. The market is looking for a small decline month-on-month, the third in a row, as the cost-of-living crisis reduces disposable incomes and causes consumer sentiment to plunge. Furthermore, spending everywhere is rotating from goods spending (which is what retail sales covers) to spending on services. (EG during the pandemic I stopped going to the gym and exercised at home. My local sporting goods store had a months-long wait for dumbells. Now I go to the gym and it’s crowded once again, while the sporting goods store has a wide variety of dumbells in stock.)
The market is likely to be quite sensitive to this indicator. Another negative print would raise the risk of a negative GDP print for April, the second in a row. On the other hand, a significant beat, combined with Monday’s better-than-expected employment data, would suggest that rising aggregate incomes (more people earning money) are outweighing inflation in their impact on the economy. That would give the Bank of England a green light for further rate hikes.
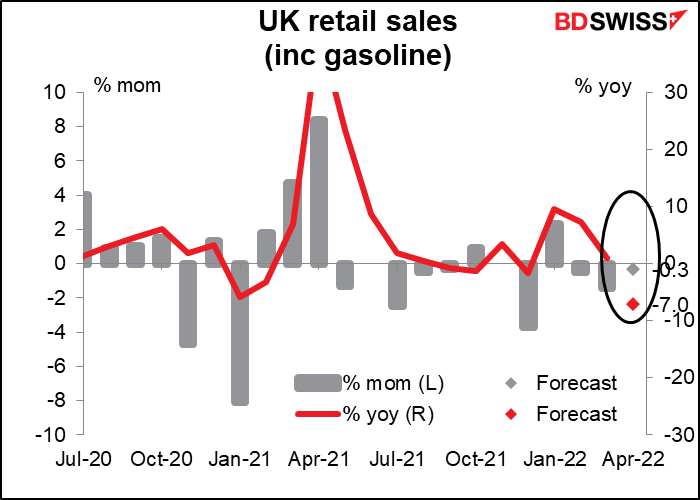
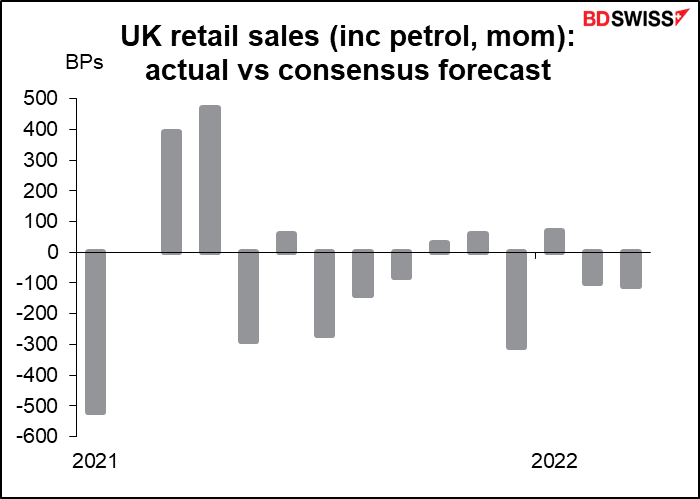
The forecasting error on this indicator is pretty big, since consumer behavior is difficult to forecast when conditions are so unusual. From January last year it’s beat estimates six times, missed 8, and hit estimates once.
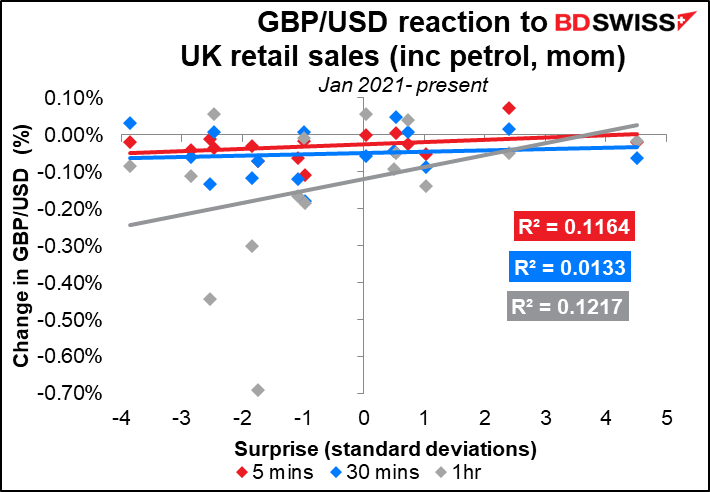
The market’s reaction to the figure isn’t that close. GBP/USD seems to decline (i.e. GBP weakens) almost regardless of whether the release misses or beats forecasts.
The Bloomberg relevance scores for the month-on-month changes including and excluding gasoline are almost the same, as are the reaction functions.
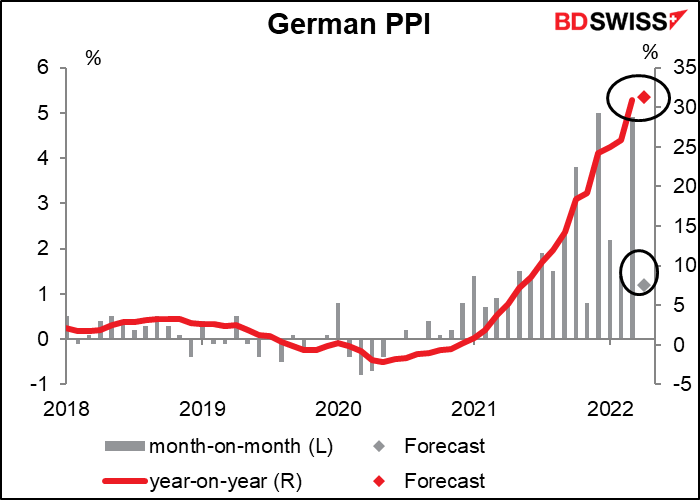
The German producer price index (PPI) isn’t a big market mover, but with producer prices rising over 30% yoy, you just gotta take notice. Inflation is the market focus nowadays and this is going to be right on target. EUR-positive
