
Rates as of 06:00 GMT
Market Recap
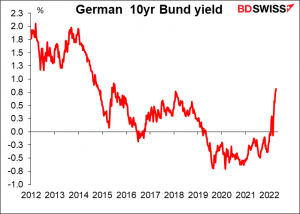
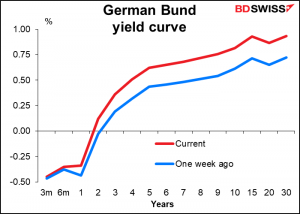
Global bond yields continue to rise. Yesterday it was Europe leading the pack, not the US.
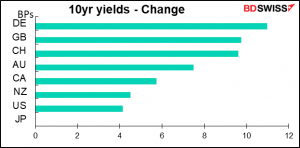
Ten-year German Bunds hit 0.814%, the highest level since 2015.
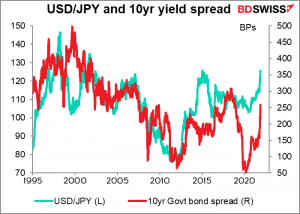
Once again Japan’s 10-year bonds at 0.24% are hitting up against the Bank of Japan’s Yield Curve Control (YCC) policy that caps them at 0.25% and are therefore resisting the global trend, to the detriment of JPY. USD/JPY broke through 125 for the first time since August 2015.
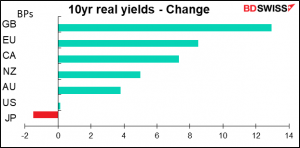
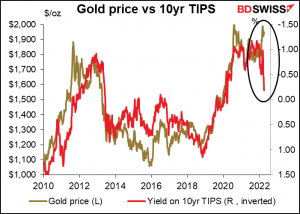
It’s not just nominal yields – real yields are rising too as inflation expectations rise little if at all.
Rising bond yields represent a threat to gold. The implied yield on Treasury Inflation Protected Securities (TIPS), bonds whose payments are linked to the consumer price index, are approaching zero. That’s a warning sign for gold, which competes with bonds as an inflation hedge. The rising real yield on TIPS is likely to be an increasing headwind for gold. The gap here may indicate the impact of the fighting in Ukraine and give us some idea of where gold would be trading without that.
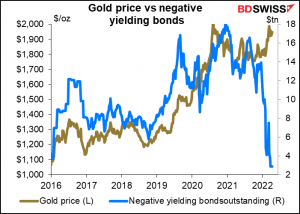
The discrepency with negative-yielding bonds is even more glaring. There’s an opportunity cost to holding gold, since you don’t earn any interest on it and on the contrary have to pay storage costs & insurance. When bond yields are negative too that opportunity cost can be competitive or even beat the opportunity cost of holding negative-yielding bonds, but as interest rates rise, it does represent a genuine opportunty that’s foregone.
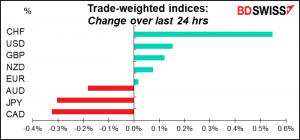
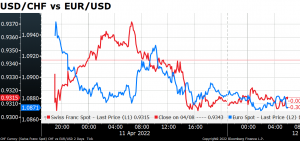
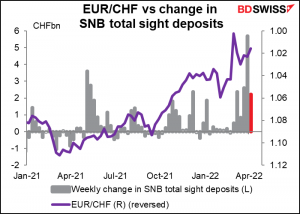
Meanwhile, the strong rally in CHF was as inexplicable as ever. There was no specific news to explain why after USD/CHF weakened gradually (CHF strengthened), the pair suddenly plunged (CHF shot up) around 14:30 GMT, mid-morning US time. It coincided with a decline in EUR/USD so I can assume it was related to some risk-aversion with regards to Europe.
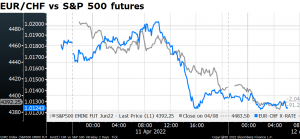
Or risk aversion in general as EUR/CHF fell along with the S&P 500 futures.
The Swiss sight deposit data for the previous week showed that the Swiss National Bank had backed off from its sizeable intervention of the previous week. However that data came out much earlier and so was unlikely to be the trigger.
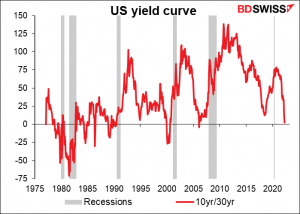
The “risk-off” mood as shown in falling stock prices reflects the increasing likelihood of a “hard landing” (aka recession) in the US as estimates for the fed funds rate continue to rise. Even some members of the rate-setting Federal Open Market Committee (FOMC) are starting to sound pessimistic. Fed Gov. Waller yesterday observed that interest rates are a “brute-force tool” that can act as a “hammer” on the economy. He admitted there could be some “collateral damage” when they are used to slow inflation.
Reflecting the rising risk of a recession, the US 10yr/30yr yield curve momentarily inverted, adding to the warning signs.
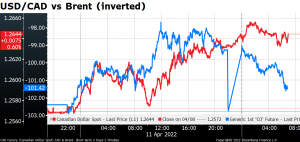
Meanwhile, oil continued to fall and CAD weakened with it thanks to the lockdown in China.
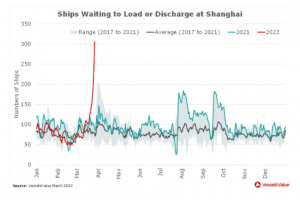
Shanghai has effectively ground to a halt. However, there were reports that the government will start to ease up on the restrictions.
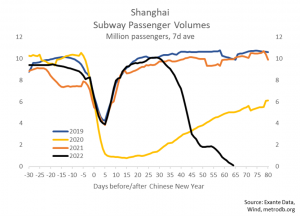
The lockdown is also likely to add to inflationary pressures worldwide as it disrupts activity at one of the world’s main shipping centers.
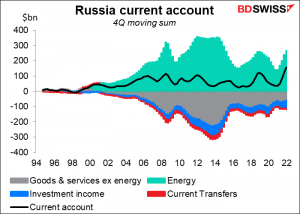
On other fronts… Russia’s current account surplus hit a record high in Q1 (data back to 1994) as revenues from oil and gas exports surged and imports plunged. This suggests the sanctions will have to hit a lot harder before they start impinging on the country. The EU foreign ministers met yesterday to discuss whether to sanction Russia’s energy sector. So far no agreement although they did agree to ship more weapons to Ukraine. Oil could be part of the next sanctions package however.
Today’s market
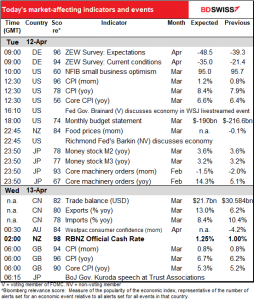
Note: The table above is updated before publication with the latest consensus forecasts. However, the text & charts are prepared ahead of time. Therefore there can be discrepancies between the forecasts given in the table above and in the text & charts.
Two major points of interest on the schedule for today: the US consumer price index and, overnight, the Reserve Bank of New Zealand meeting. We deal with them in chronological order, so skip down if you’re just interested in those.
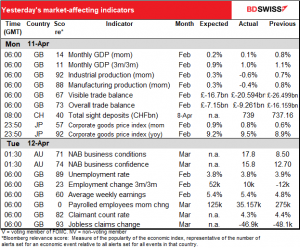
We’ve already had the UK employment data, as per the table at the start of this report.
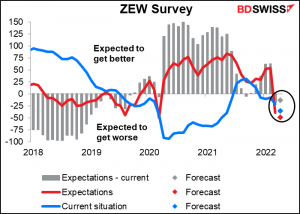
That means we’re starting off with the ZEW survey of economists, analysts, and pundits in general. This is more an opinion survey than a survey of corporate plans, like the purchasing managers’ indices (PMIs) are. It’s pretty grim. Both the current conditions index (blue) and expectations (red) are expected to fall. The current situation is expected to fall by more than expectations, but expectations are still expected to be below the currency situation, which would mean people think things are going to get worse before they get better. Not good! EUR-
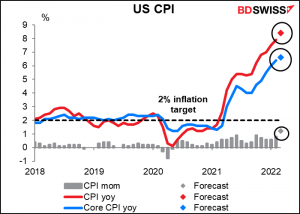
Then comes the big thing of the European & US day, namely the US consumer price index (CPI). The minutes of the March meeting of the rate-setting Federal Open Market Committee (FOMC) showed that “many participants” thought that “one or more 50 basis point increases…could be appropriate at future meetings, particularly if inflation pressures remained elevated or intensified.” So there’s intense interest in whether inflation pressures remain elevated or even intensify.
If the consensus forecasts for today’s indicator are correct, they did. The headline figure is expected to rise a stunning 8.4% yoy while core CPI, which excludes energy and food, is forecast to be up an equally shocking 6.6% yoy.
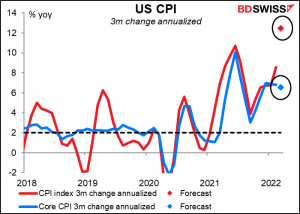
The market pays more attention to the month-on-month (mom) figures. These too are forecast to show strong gains. If we take the change from three months ago and annualize it, the headline CPI would be rising at a 12.5% yoy pace. This shows that it’s not just base effects by any means – inflation is accelerating. Quelle bummer! The figures are likely to validate expectations of several 50 bps hikes in the fed funds rate and thereby push the dollar higher.
That’s it for the US day.
Overnight, Japan releases its money supply data (M2 and M3). I’m not sure whether anyone cares about it – let me rephrase that, I sincerely doubt whether anyone cares about it – but I noticed it gets a Bloomberg relevance score over 70, so I thought I’d throw in a chart. In any case no change is expected in the rate of growth of the monetary aggregates.

Japan also releases its machinery orders, which I care about even less because I can never discern a trend in them. Even the 3-month moving average of the mom rate of change bounces up and down. Yet this indicator has one of the highest Bloomberg relevance scores of any Japanese indicator so you gotta pay attention to it.
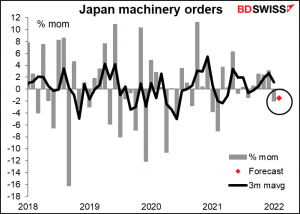
USD/JPY does seem to respond well to the figures, except that its movement is counter-intuitive: the pair tends to decline (i.e. JPY strengthens) when the figure misses expectations and vice-versa when it beats expectations.

My assumption is that this is a “risk-on” and “risk-off” move; when orders disappoint, investors go into “risk-off” mode and hedge their overseas investments. Except for one problem: we don’t find this pattern in the stock market, which doesn’t have such a consistent response to the figures.
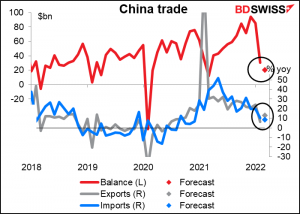
China’s trade surplus fell sharply in February. It’s expected to fall further even though the yoy pace of growth of exports is expected to exceed that of imports. The slowdown in import growth could be negative for the commodity currencies.
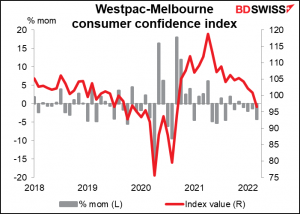
The Westpac-Melbourne Institute consumer confidence index is one of those indicators that has a high Bloomberg relevance score but no forecasts, so I just present a graph. Note that it’s fallen mom for the last four months in a row. There was no major improvement in the lockdown conditions in March so I doubt if there will be a big improvement in sentiment.
Next up we get the event you’ve all been waiting for: the meeting of the Reserve Bank of New Zealand (RBNZ). Of course I had a brilliant exposition on the subject in my Weekly Outlook, which you can refer to there.
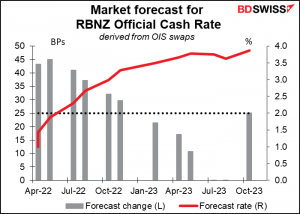
To sum up what I said there, economists are forecasting a 25 bps hike but the overnight index swap (OIS) market is forecasting a 41 bps hike, which amounts to a 66% chance of a 50 bps hike. Interesting split!
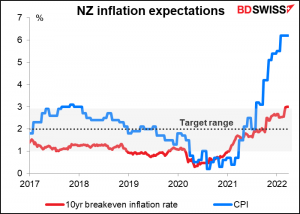
I think they’ll go for 50 bps because of their “least regrets” policy framework. Under this framework, they ask the question: if we make a policy mistake, which would we regret less: too loose or too tight? In the minutes of the February meeting, they said in this context that “the most significant risk to be avoided at present was longer-term inflation expectations rising above the target and becoming embedded in future price setting.” The 10-year breakeven inflation rate has indeed climbed to 3.0%, the top of the RBNZ’s 1%-3% target zone. I expect that they’ll want to hike at a faster pace in order to prevent inflation expectations from becoming unanchored.
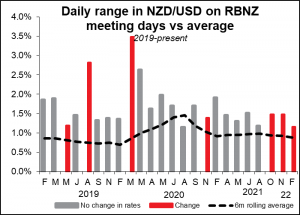
Either way there’s likely to be considerable volatility in NZD after the move because there’s no consensus on what they’re going to do Some people will be surprised whichever way it goes.
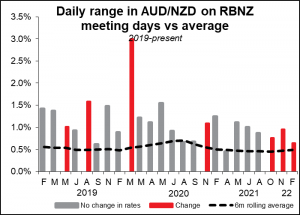
As it is, there’s usually more than-normal volatility in NZD/USD and AUD/NZD on RBNZ days. There’s likely to be even more volatility than usual this time, in my view.
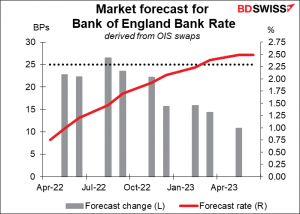
After that…we have to wait until Wednesday morning at 7 o’clock as the day begins, when we get the dreaded UK CPI. As I said in my above-mentioned Weekly Outlook, This figure is expected to be bad – the market is looking for the headline inflation rate to rise to 6.7% from 6.2% yoy.
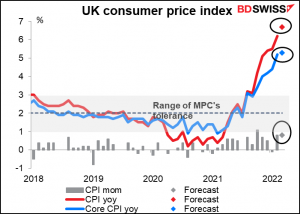
But even that’s likely to be just the calm before the storm in April, when the UK household energy price cap rose by 54%. That will push up energy prices for everyone.
With inflation so far above the Bank of England’s 1%-3% area of tolerance, there’s a chance that they too feel the need to hike 50 bps at an upcoming meeting instead of the 25 bps that’s priced in for each of the next several meetings. That could be positive for GBP.