Inflation is the topic that just keeps on giving. It used to be that every Thursday I’d start panicking. “What should I write about this week?” I’d wonder. Now it’s a little different. “What should I write about inflation this week?” is my new weekly question.
It’s not too bad, considering how many years we financial commentators went without writing a single comment about the subject (unless we were writing about Japan, in which case the perennial question was “why can’t Japan escape deflation?”)
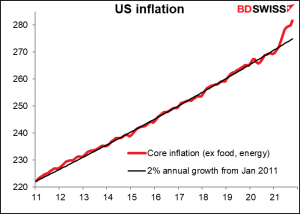
But now we’ve broken out of the long-term inflation trend. Over the last decade, the Fed has done pretty well in keeping to its 2% inflation target. Core inflation has broken substantially above that now.
One thing I’ve learned from this experience is that several of the 12 regional Feds have their own ways to analyse inflation. They slice and dice the data in different ways to allow us to see what’s going on.
Fundamanetly they all say the same thing: US inflation is rising.
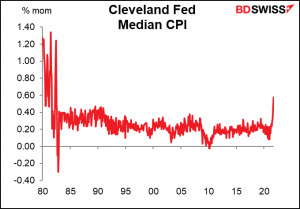
The Cleveland Fed does two measures of “trimmed” inflation, in which they try to measure underlying inflation trends by removing volatile items (similar to core CPI).
They have two such measures. The first is the “median CPI”:
To calculate the median CPI, the Federal Reserve Bank of Cleveland looks at the prices of the goods and services published by the Bureau of Labor Statistics (BLS). But instead of calculating an inflation rate that is a weighted average of all of the items in the CPI, as the BLS does, the Cleveland Fed ranks the inflation rates of the components of the CPI and picks the one in the middle of the distribution—that is, the item whose expenditure weight is in the 50th percentile of the price change distribution.
This measure is rising sharply. The mom change of 0.57% was the highest since the high-inflation days of the early 1980s (when then-Fed Chair Paul Volcker pushed the fed funds rate up to 20%).
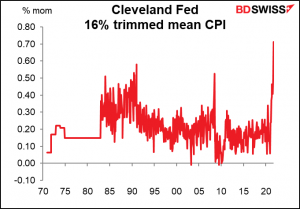
They also produce the “16 percent trimmed-mean CPI.” This series which goes back to 1971, registered its faster growth ever.
The Cleveland Fed also calculates the 16 percent trimmed-mean CPI by taking a weighted average across the component inflation rates after excluding, or trimming, items whose expenditure weights fall in the top 8 percent and bottom 8 percent of the price change distribution.
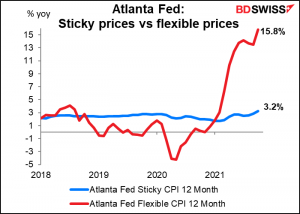
The Atlanta Fed calculates a “sticky-price CPI.” This index “sorts the components of the consumer price index (CPI) into either flexible or sticky (slow to change) categories based on the frequency of their price adjustment.” The key point here is not that the flexible CPI is soaring at 15.8% yoy but that even the “sticky price” CPI is up 3.2% yoy, above the Fed’s 2% target.
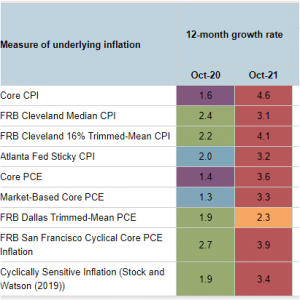
The Atlanta Fed’s inflation dashboard is flashing red. (Note that the personal consumption expenditure or PCE measures are updated only until end-September, whereas the CPI measures are end-October. The October PCE figures will be released on Nov. 24th.)
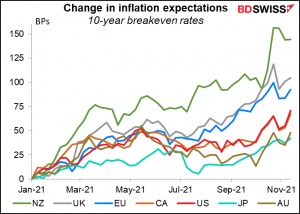
With inflation soaring, the five-year and seven-year (not shown) breakeven inflation rates hit record highs (data back to 2003).

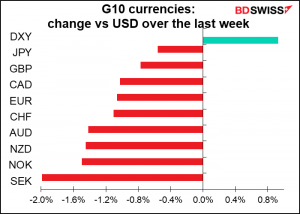
Breakevens rose in most countries, although in several other countries they’re still below the recent peak hit a month ago.
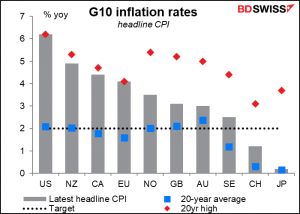
The US is an outlier to some degree in that it currently has the highest headline CPI inflation rate of any of the G10 countries. However we can see that the EU inflation rate is also the highest it’s been in the last 20 years, and New Zealand and Canada pretty near. These results are in contrast to the success of the last 20 years, when most of the countries (with the notable exceptions of Switzerland and Japan) were successful in keeping their inflation rates around the 2% target.
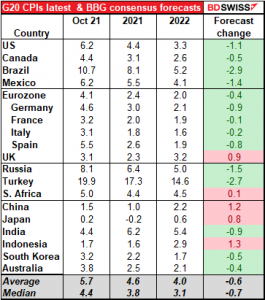
The market still generally believes the “transitory” idea, though. Globally, most of the G20 countries are expected to have lower inflation in 2022 than in 2021, and near to the 2% target for most of the developed countries (except the US and of course Japan).
Against this background of heightened inflation fears, the market next week is likely to focus intently on the inflation-related indicators coming out. (Forecasts are not available for all of them yet.)

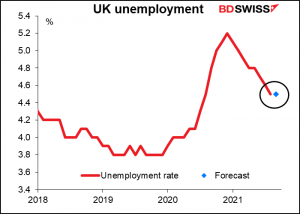
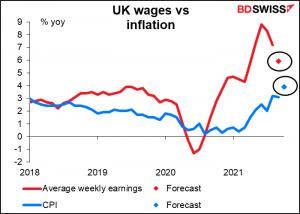
For Britain, we have the employment data on Tuesday. The Bank of England has focused its attention on the labor market as its key variable for deciding whether to raise rates. If it sees the unemployment rate holding steady despite the end of the government’s furlough scheme in September, and especially if it continues to see growth in average earnings running well above inflation, it may be more willing to trigger the oft-mooted “some modest tightening of monetary policy.” Of course Wednesday’s UK CPI will be the proof of the pudding, and an expected sharp rise in inflation there may suggest that the pudding is over-egged, as they say in Britain, whatever that means.
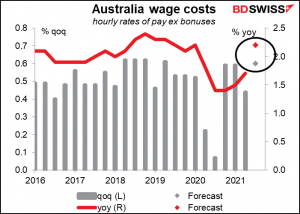
Australia’s wage price index on Wednesday will be important for the Reserve Bank of Australia (RBA), one of the three central banks that I know of that have a “dual mandate” to maximize employment as well as control inflation (along with the US and New Zealand). Their forward guidance reads,
The Board will not increase the cash rate until actual inflation is sustainably within the 2 to 3 per cent target range. This will require the labour market to be tight enough to generate wages growth that is materially higher than it is currently. This is likely to take some time.
Accordingly, wage growth is now one of the major indicators for Australia. It’s expected to rise, which is good news for AUD.
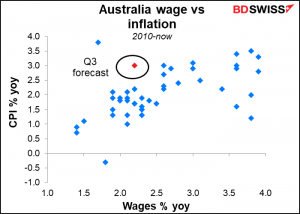
Although looking at the historical relationship between wages growth and inflation, 2.2% is probably not enough to generate the kind of inflation that would get the RBA to move. They would probably want to see it above 2.5% for some time before they’d be convinced. So it’s good but not great.
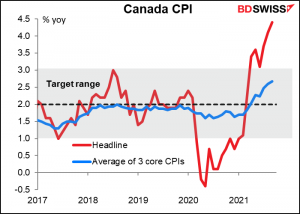
Canada releases its CPI on Wednesday as well. No forecasts are available yet. The headline rate of inflation is well above the target range and the core CPIs are headed in that direction too.
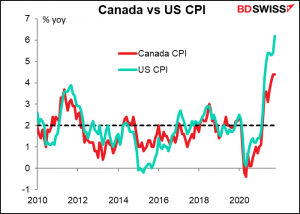
Given the close relationship between the Canadian and US CPIs, we can guess where the Canadian CPI is headed. The market is already pricing in four rate hikes by the end of next year though so perhaps much of this is in the price already. Much, but not all. CAD+
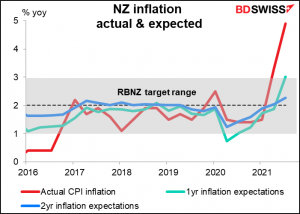
There are no forecasts for the New Zealand 2-year inflation expectations. While the one-year inflation forecast for Q3 was already 3.02%, poking its nose above the Reserve Bank of New Zealand (RBNZ) 1%-3% target ranges, the 2-year expectations at 2.27% were just above the center of their target range. If however the two-year expectations start hitting up against the top of the range, the RBNZ may get worried that expectations may become “unanchored” and accelerate its planned tightening of monetary conditions.
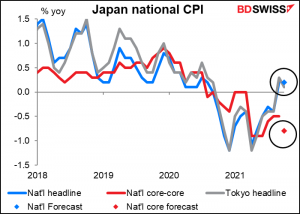
Then finally there’s…Japan. Japan, where inflation is but a distant memory from another age, something that mothers tell their children about along with stories of samurai and ladies-in-waiting. Furthermore the national CPI comes out two weeks after the Tokyo CPI, and Tokyo is around 10% of the country as a whole, so people don’t pay that much attention to the national CPI as they do in other countries. In any case, the national headline CPI is expected to be the same as the Tokyo headline CPI was, so this isn’t likely to cause any ripples.
What is interesting though is the Bank of Japan’s “core-core” measure of inflation. Japan’s core inflation only excludes fresh food, unlike most other countries, whose core measure excludes food and energy. The BoJ has a “core-core” measure that’s in line with other countries’, and it’s expected to show the country slipping deeper into deflation – probably because it excludes the impact of energy.
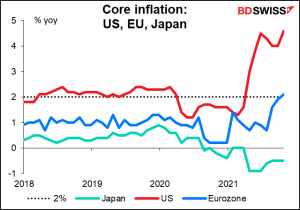
Notice the divergence in core inflation between the US, the Eurozone, and Japan.This is likely to drive the fabled “monetary policy divergence” and keep the dollar rising vs EUR. JPY meanwhile is likely to go back to being the funding currency of choice as it wasn’t in the 1990s, sending JPY lower.
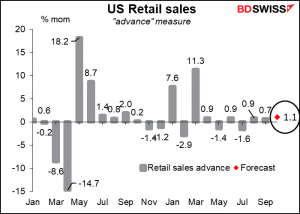
Aside from the inflation data, we also get retail sales from the US (Tuesday) UK , and Canada (Friday).
US retail sales are expected to show a fairly healthy gain of 1.1% mom, the highest since the pandemic-payment-fuelled spending spree in March. That could reinforce the idea of a healthy US economy and be positive for the dollar.