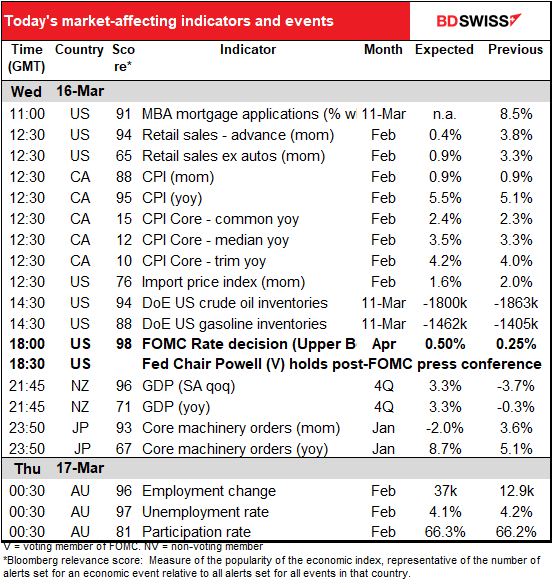
Rates as of 06:00 GMT
Market Recap
I’ve been doing this job for a long time but still there are days when things confuse me.
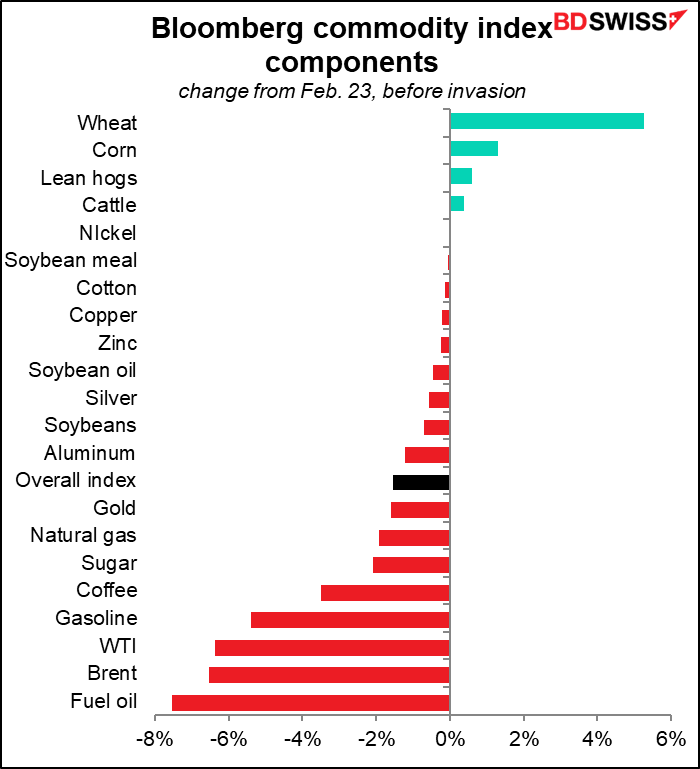
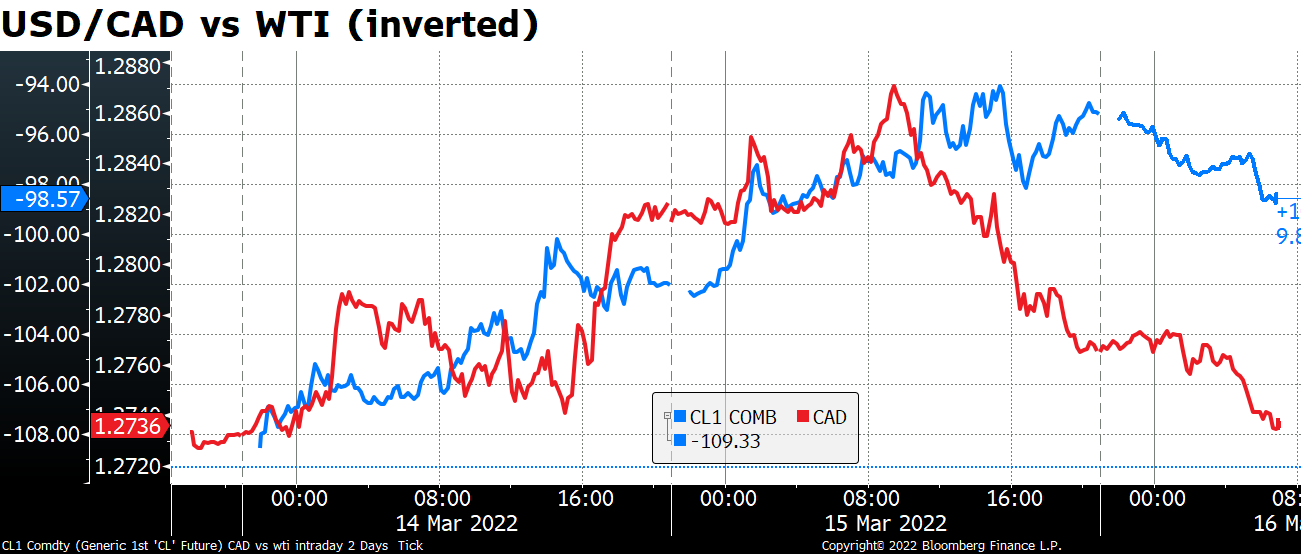
Today for example most commodities were lower, so why were the commodity currencies higher?
You can see it well with USD/CAD. It followed the oil price until mid-day European time, then the two diverged considerably.
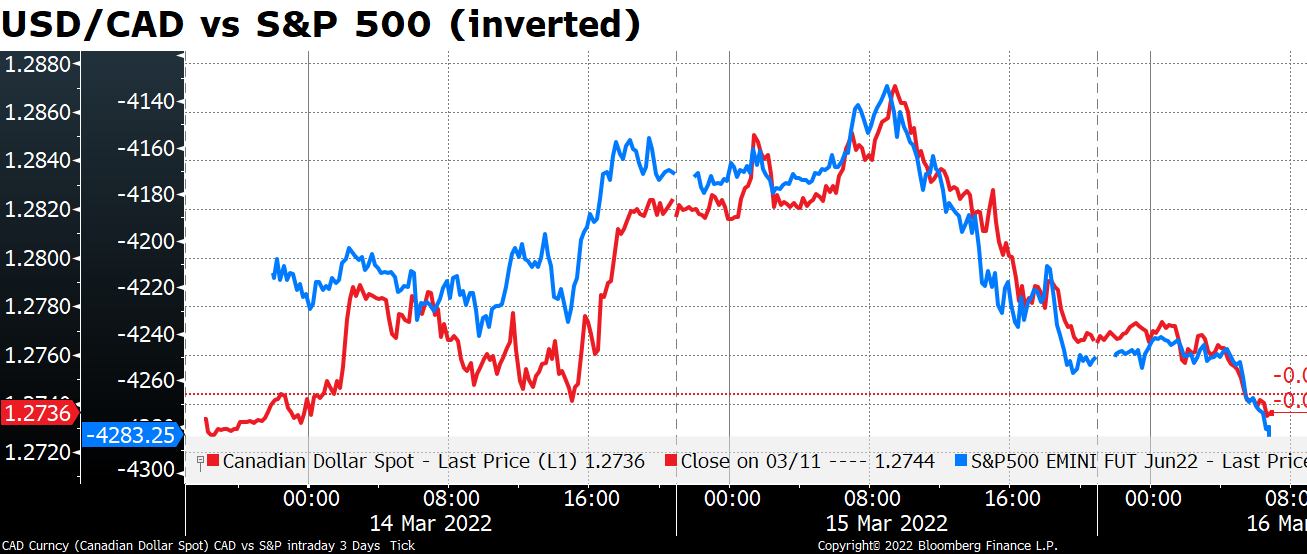
The reason is that CAD – and the other commodity currencies — started following the general “risk” tone, as exemplified by the S&P 500 futures. Stocks had a good day – the S&P 500 finished up 2.1% in a broad-based rally with 446 of the constituents rising. It’s indicated opening up 0.7% today. The NASDAQ meanwhile rose 2.9%.
European stocks closed slightly lower (Euro STOXX 50 -0.1%), but risk sentiment improved during the New York session when a senior aide to President Zelenskyy said that Russia has softened its stance in the talks — the Russians representatives have become “more constructive” and Russia has changed tone and stopped airing demands for Ukraine to surrender, he said. Furthermore, Bloomberg reported that President Zelenskyy said Ukraine will not become a member of NATO, which would be a major concession to Russia but turned out to be a mistranslation. Instead what he said was that Ukraine “is not a member of NATO” and will not invoke Article 5 of its constitution about NATO membership but relies on the support of its allies for help. Still, that should go some way to leaving the Russians a face-saving way to back out.
The good tone in stock markets got a further boost this morning after China pledged to enact new measures to boost financial markets and increase economic growth as it attempted to ease fears on risks related to the property market, overseas listings and internet companies. As a result the Hang Seng Index – which yesterday I flagged as having broken through a 30-year trendline – is up a whopping 8.3%, its best day since 2008. That’s nothing compared to the Hang Seng TECH index of the 30 largest tech companies listed in Hong Kong – it was up 19.6% on the day! (Don’t get too excited – that brings its YTD decline to only 26.6% and its 52-week change to -51.2%.)
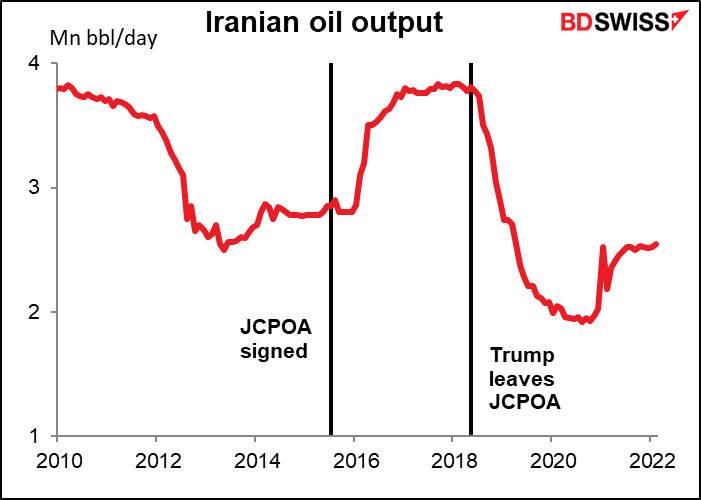
All commodities were lower as the possibility of a settlement increased. Oil fell particularly hard as Russian Foreign Minister Lavrov said that Russia had received “written guarantees” from the US. that sanctions imposed over the invasion of Ukraine will not impair its nuclear cooperation with Iran. That could ease the way for an agreement to restore the 2015 Joint Comprehensive Plan of Action (JCPOA) and allow Iran to return to the oil markets, which would quickly bring some 1.2mn barrels a day of oil into the market.
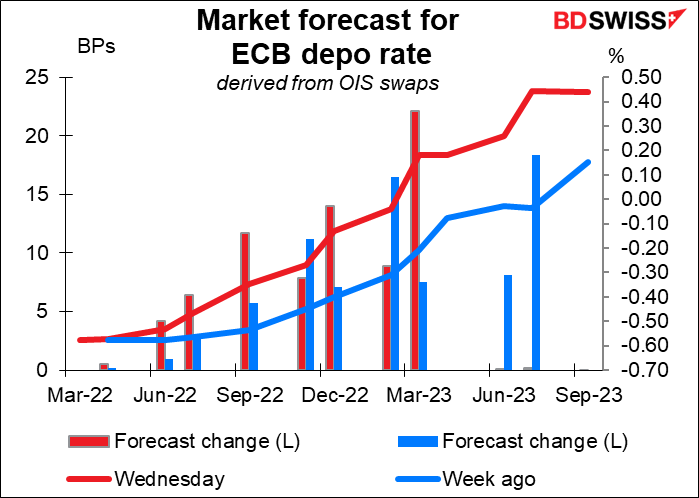
Another mystery: why did EUR do so poorly after European Central Bank (ECB) President Lagarde said the Bank could end its bond purchases in Q3, which would allow them to start hiking rates this year? “If incoming data support the expectation the medium-term inflation outlook will not weaken even after the end of net purchases, the central bank will conclude net purchases in the third quarter,” she said. The ECB has said it would raise rates only “some time” after the end of the net purchases, so this is a signal that they could raise rates as early as September (assuming that they ended their bond purchases at the July meeting, the first meeting in Q3). The market is pricing in about one rate hike by then.
Today’s market
FOMC meeting: 25 bps hike
The main event today of course is the meeting of the US Fed’s rate-setting body, the Federal Open Market Committee (FOMC). I discussed this in depth and detail as usual in my Weekly Outlook: The Next Three (the three in this case being the three central bank meetings this week). So I’ll just summarize what I said there.
Fed Chair Powell already said he’s going to recommend a 25 bps hike in rates at this meeting, the first rate hike since December 2018. That’s been the most likely possibility for most of this year except for a time around the release of the January CPI on Feb. 10th, which temporarily convinced the market that a 50 bps hike was likely.
The three questions the market will be looking for answers on are:
- How many more rate hikes after this?
- When will they start reducing the size of their balance sheet? And
- How much will they reduce it by each month?
As for the first question, the market puts the highest probability on seven rate hikes of 25 bps each this year, bringing the Fed funds rate to 1.75%-2.0%. That would imply one rate hike of 25 bps at each meeting for the rest of the year, which is certainly within the realm of the possible. The market sees the probabilities as equally weighed around that possibility, with the odds of six hikes being about the same as the odds of eight hikes.
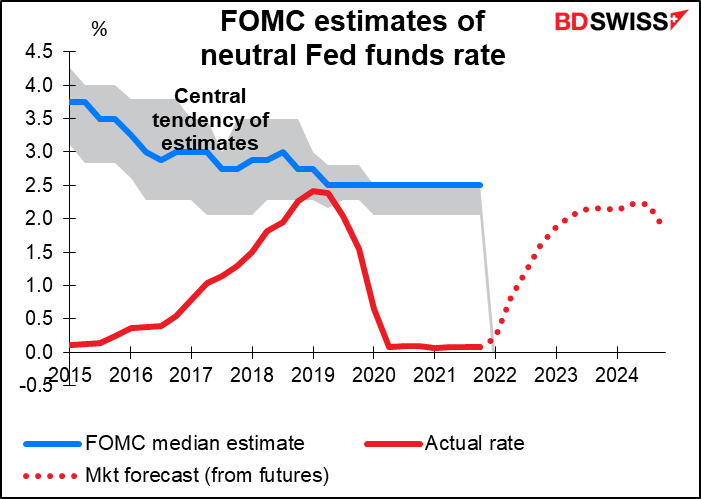
That would still leave the fed funds rate below what the FOMC members consider to be the “neutral” rate – 2.5% — at which they are neither stimulating nor restricting the US economy. The market doesn’t expect them to get that far – the fed funds futures peak at 2.16% in December 2023 and start to decline after that, implying that they think the Fed will have to start easing policy before they can even get to neutral.
This meeting will be accompanied by an updated version of the Summary of Economic Projections (SEP), which as you might expect is a summary of the Committee’s economic projections. Of particular concern as usual is their forecast for inflation.
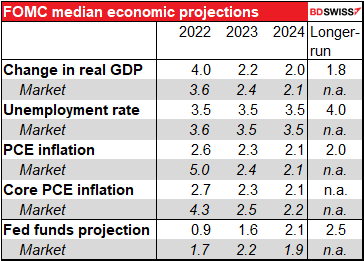
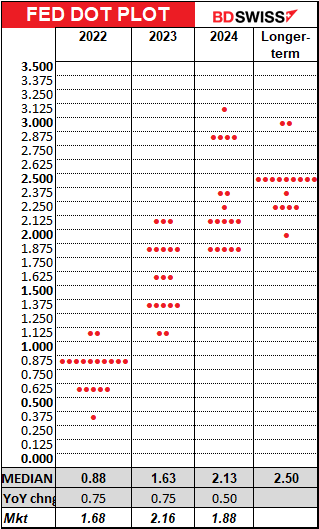
And with that comes the “dot plot” in which each member forecasts where he or she expects the fed funds rate to be at the end of each year. The market will be itching to see how the median Committee member is thinking relative to what the market is thinking. As it stands now the market is more aggressive than the Committee for this year and next year but expects the Fed to have to ease in 2024. This is contrary to the Fed’s hope that it can engineer the fabled “soft landing” and pilot the economy toward equilibrium. Hah! It hasn’t happened yet, but maybe it will this time. As we all know, past performance is no guarantee of future performance.
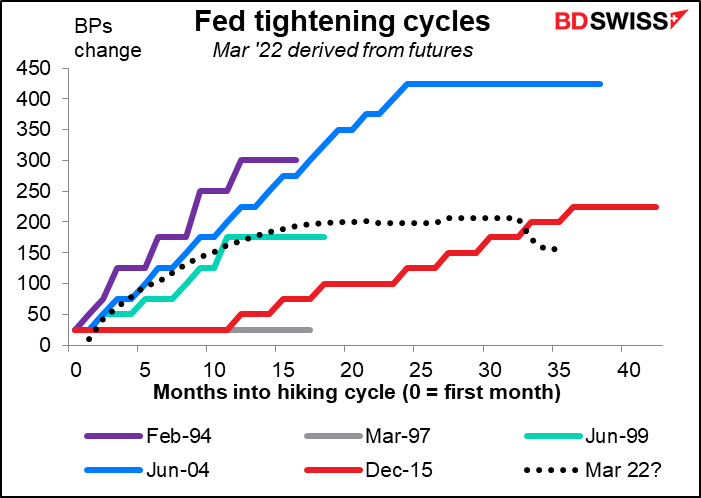
The last four hiking cycles lasted 30 months on average, but that was divided between three short cycles (18 months average) and two long ones (41 months). The market is assuming a relatively long but shallow hiking cycle in this case.
The Fed said at the January meeting that they’re going to reduce the balance sheet “in a predictable manner” by allowing bonds to mature without being rolled over, rather than selling bonds. The question then is how much they will allow to mature in this way each month – the cap on maturing bonds. In his recent testimony to Congress, Chair Powell said they would decide this point at this meeting.
The question of when to start running down the balance sheet is another matter. Different members have expressed different views, which can be summed up as “sometime later this year.” They may try to be more specific than that while still leaving themselves plenty of wiggle room should events turn out differently than they hope.
Last time around the first mention was in June 2017 when they said “The Committee currently expects to begin implementing a balance sheet normalization program this year, provided that the economy evolves broadly as anticipated.” At the next meeting, In July, they said “The Committee expects to begin implementing its balance sheet normalization program relatively soon, provided that the economy evolves broadly as anticipated…” Then at the next meeting, September, they said “In October, the Committee will initiate the balance sheet normalization program…” Given where inflation is now, they may skip “this year” and go straight to “relatively soon,” hedged of course with a variety of caveats about the geopolitical situation.
Market impact: The market obviously expects a 25 bps hike. The reaction then will be dictated by 1) how much the dot plot changes and 2) how aggressive they seem on running down their balance sheet. Given the bipartisan pressure to get inflation down, I expect that Fed Chair Powell will not pull any punches in his press conference. That could be positive for the dollar.
Today’s indicators
Today’s indicators kick off with the Mortgage Bankers’ Association (MBA) mortgage applications. So far this year they’re doing well – not as much as last year, but last year was extraordinary. They’re better than most other years this decade. With demand for houses this strong, the Fed can feel free to let its stock of mortgage-backed securities roll off as it tries to reposition its portfolio to consist mostly of Treasuries. This would be positive for the dollar.

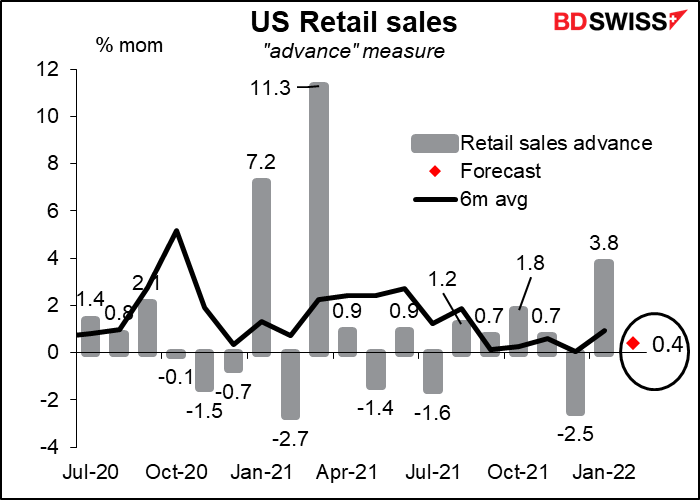
Since US retail sales comes only a few hours before the fateful FOMC meeting ends, the market may not pay as much attention as usual to what’s usually one of the more important indicators every month.
Sales are expected to be up but sluggish, partly because of the 5.2% mom fall in auto sales and partly a reaction to the exceptional sales in the previous month. Excluding autos, sales are expected to be up a more robust +0.9% mom, in line with the six-month average. The continued healthy increases in sales show that the rise in employment and in working hours is supporting total spending power.
Note though that the figures aren’t adjusted for inflation. With prices rising at about +0.6% mom, that means even if the volume of goods sold doesn’t increase at all, the value will rise +0.6%. Looked at that way, the forecast headline +0.4% mom increase in the value of sales is a decline in real terms.
I doubt if the markets will look at things that way though. I’d expect yet another rise in sales following the previous month’s extraordinary rise to be taken as good news for the US economy and therefore be positive for the dollar.
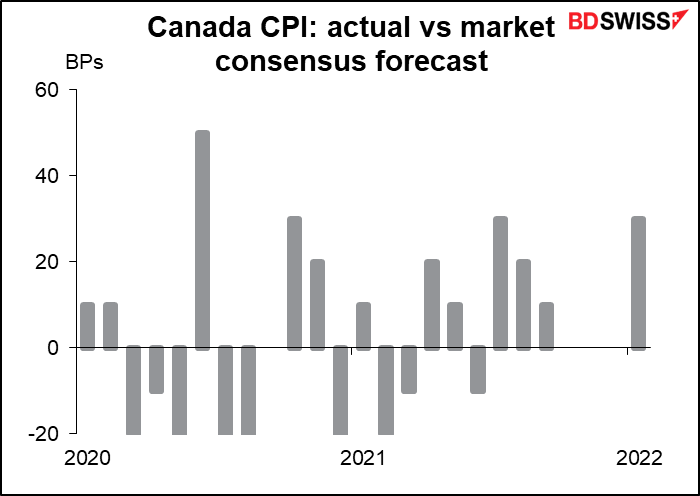
Canada releases its consumer price index, the last inflation number before the mid-April Bank of Canada meeting. The headline inflation rate is expected to move still higher while two of the three core inflation measures are expected to poke their nose over the top of the 1%-3% target range.

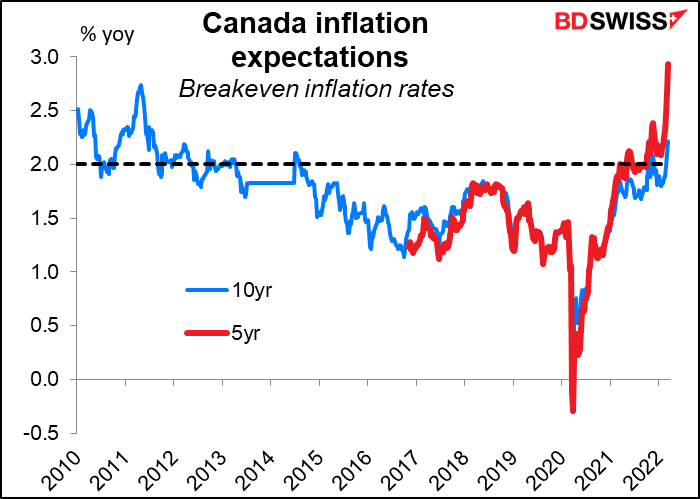
At its last meeting a few weeks ago, the Bank of Canada noted that “measures of core inflation have all risen” and warned that “Persistently elevated inflation is increasing the risk that longer-run inflation expectations could drift upwards.” Indeed, 10-year breakeven inflation rate for Canada has hit 2.21%, the highest level in over a decade, while the five-year breakeven inflation rate has hit 2.93%, almost outside the target range. Governing Council said it “expects interest rates will need to rise further.” A further rise in inflation, as seems likely, would only confirm that expectation. CAD+
USD/CAD doesn’t seem to react that consistently to the data. It seems that generally speaking, the actual figure has to beat the market estimate by a lot – two standard deviations — to push USD/CAD lower. Furthermore, there was also a case where the figure missed estimates and USD/CAD fell anyway.

EUR/CAD seems to have a better correlation with the data release than USD/CAD does.

The last 13 months, the index has beaten estimates 7 times, matched 3 times, and missed 3 times. So it’s pretty much a 50-50 tossup whether it beats estimates or not.
Overnight, New Zealand announces its Q4 GDP figures. New Zealand is always the last of the industrial nations to report their GDP figure, which I find surprising as it’s a relatively small economy and the data should be relatively easy to come by – but I suppose at the same time they then have fewer statisticians to compile it.
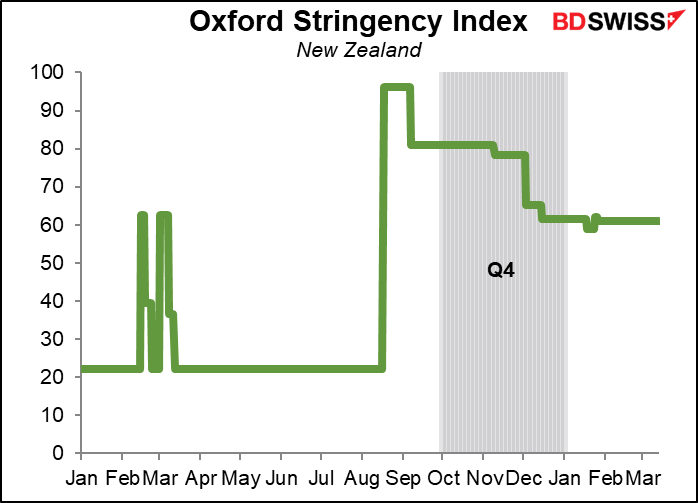
The figures are not only late but also distorted by the lockdown measures to deal with the pandemic. They were relaxed somewhat during the quarter but still in place.
Nonetheless, the market is look for a sharp rebound from the lockdown-induced downturn in Q3 as people who had been cooped up for some time get out and spend, spend, spend. The 3.3% market consensus is far more than the 2.3% qoq forecast in the Reserve Bank of New Zealand’s February Monetary Policy Statement.

I don’t expect much of a market reaction. First off, the market doesn’t react that strongly to the NZ GDP figures in any case, probably because they are so old. NZD/USD seems to react more initially, but the effect seems to last longer with AUD/NZD.

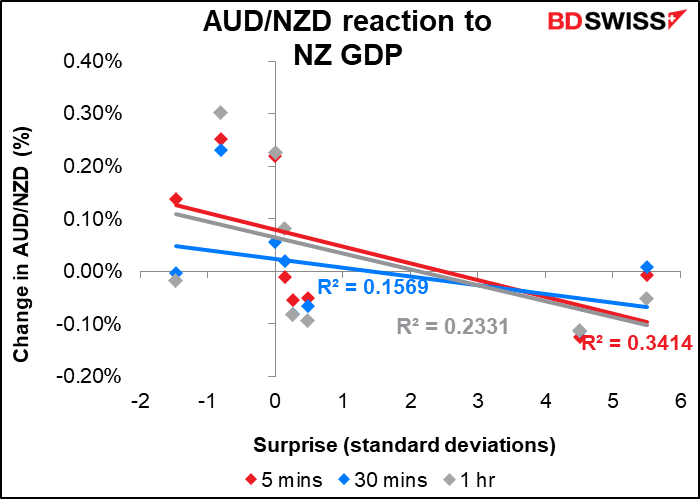
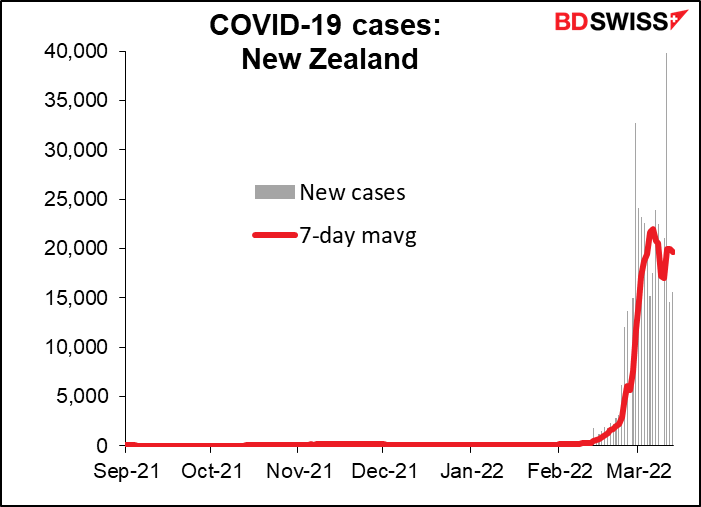
Furthermore, the incredible surge in virus cases from late February is bound to weigh on activity in Q1, meaning the Q4 data tells us little about what the future course of activity is likely to be. It remains to be seen though what if any actions health authorities will take in response.
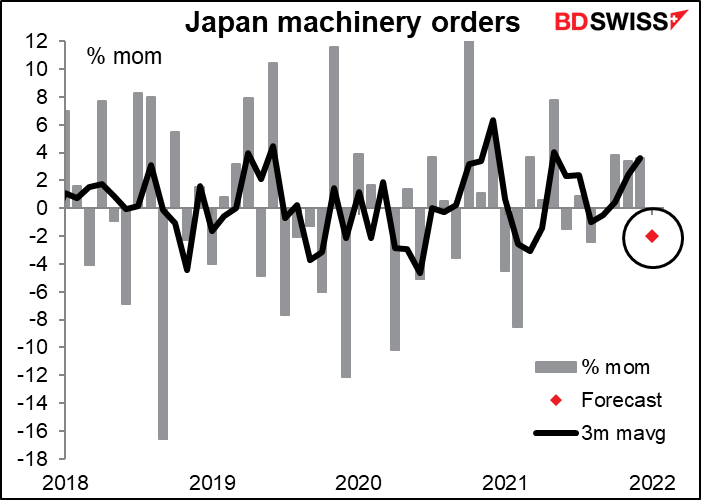
Japan’s machinery orders are expected to be down after three months up. Frankly I don’t care. I don’t see why people make such a big fuss over this indicator, which never seems to trend and therefore never gives a consistent indicator of how things are going. But it has a high Bloomberg relevance score so I have to report on it every month.
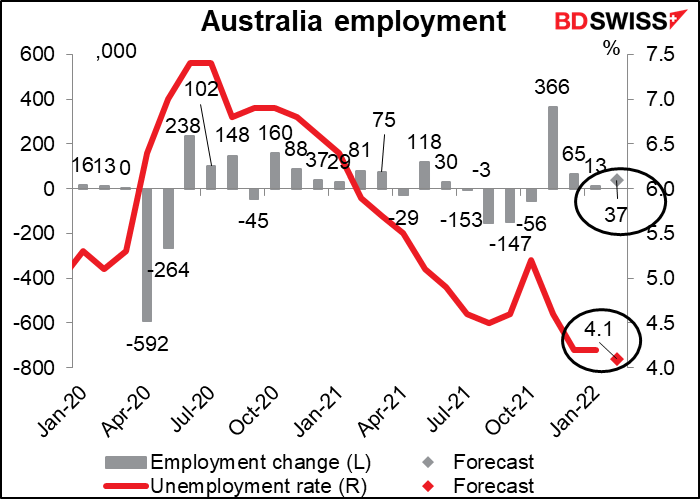
Australia releases its employment data on Thursday. It’s expected to be good – the unemployment rate down, employment up more than in the previous month, and the participation rate (not shown) higher. Reserve Bank of Australia Gov. Lowe last week conceded that “it’s plausible that interest rates will increase this year,” but he also said there were plausible scenarios where rates didn’t rise until next year. He’s focusing on wages and the development of a wage/price spiral, which he hopes would ensure that inflation is sustainably within the RBA’s target range. In that respect, an improvement in the employment picture is positive for AUD, albeit indirectly.