It’s hard to be a fundamental analyst of FX markets nowadays. That’s because the fundamentals are all a) pretty much the same for all the currencies and b) pretty terrible.
Nominal interest rates are largely the same across the G10, around zero:
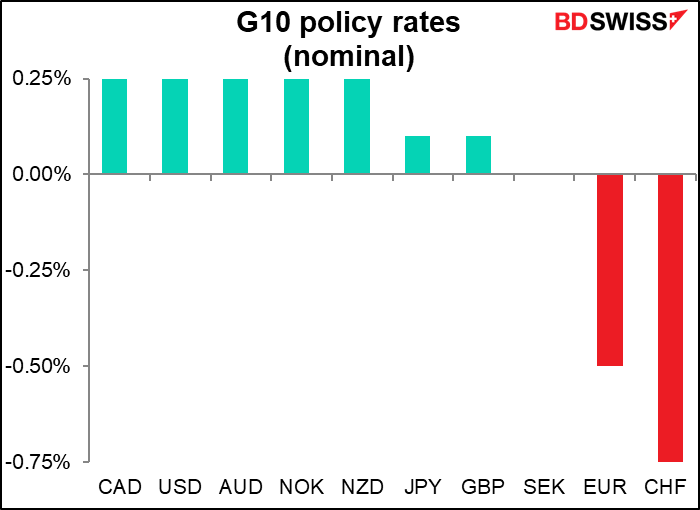
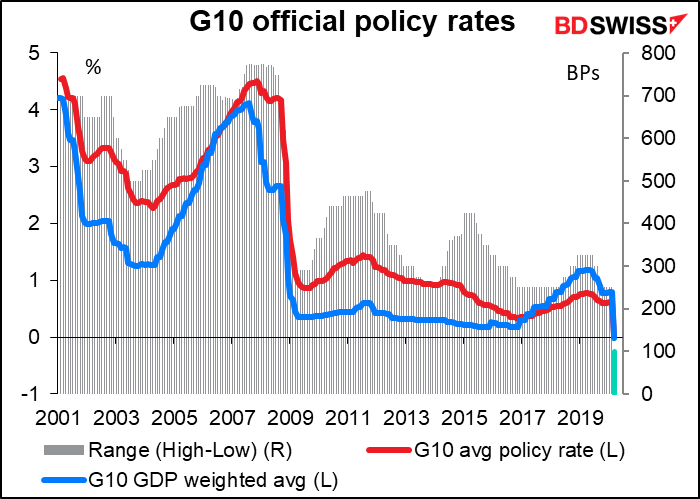
The spread between the highest and the lowest policy rate in the G10, which was around 770 basis points in early 2008, has compressed to only 100 bps. Five of the countries have the exact same rate, seven of them are within 25 bps of each other, eight of them are within 50 bps of each other.
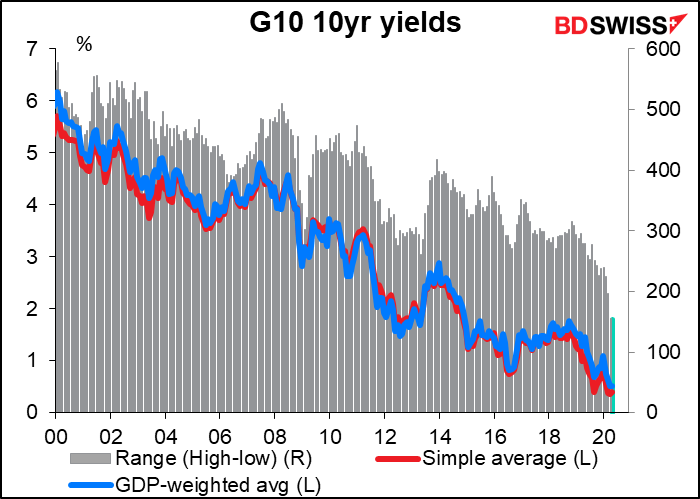
Similarly with bond yields. Most G10 bond yields are now below 1%. As central banks enact more quantitative easing (QE), the range for bond yields to rise is limited. Some countries, such as Australia, have adopted measures similar to Japan’s “yield curve control” and explicitly stated that they would limit the movement of the long end of their bond markets as well.
US Fed Vice Chair Clarida said in an interview on Monday that “right now we’re not doing yield curve control. What we indicated in our March statement is we’re going to keep rates where they are, which is basically very close to zero, until the economy is on track to achieve its maximum employment and price stability.” But of course long-term rates are to a large degree a string of short-dated rates rolled over and so if people think short rates will remain around zero for one year, then one year rates will also be around zero, etc. Thus, anchoring the short end of the curve with strong “forward guidance” limits the room for the long end of the curve to rise too.
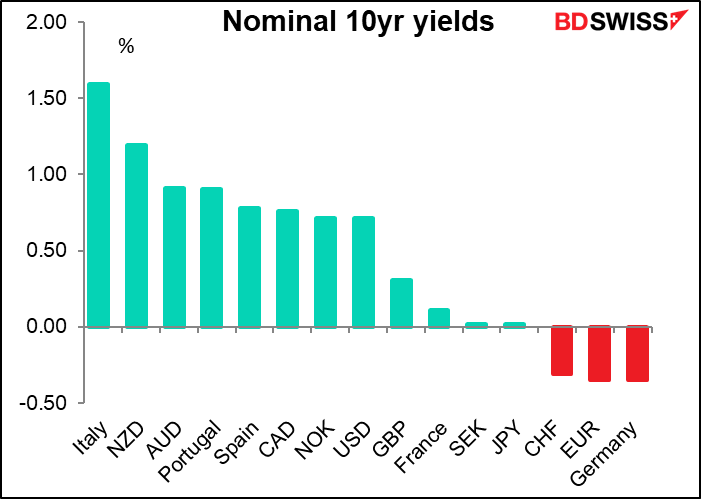
The range on 10-year bonds between the highest and the lowest has come down to 154 bps (note: I am using French and German bonds for the Eurozone to ensure relatively similar credit ratings).
Inflation expectations are falling. Japan is the most extreme – investors there expect no inflation for the next 10 years, maybe moderate deflation. (Britain is the outlier here, perhaps because the market expects the depreciation of the pound to feed through to higher prices.) Low inflation expectations means less likelihood of any rise in policy rates in the foreseeable future. On the other hand, with rates at nearly zero across the G10, we can’t see much more easing, either.

In short, the entire G10 seems to have succumbed to “Japanification:” yields near zero and the yield curve compressed, and expectations of no change stretching out as far as the eye can see.
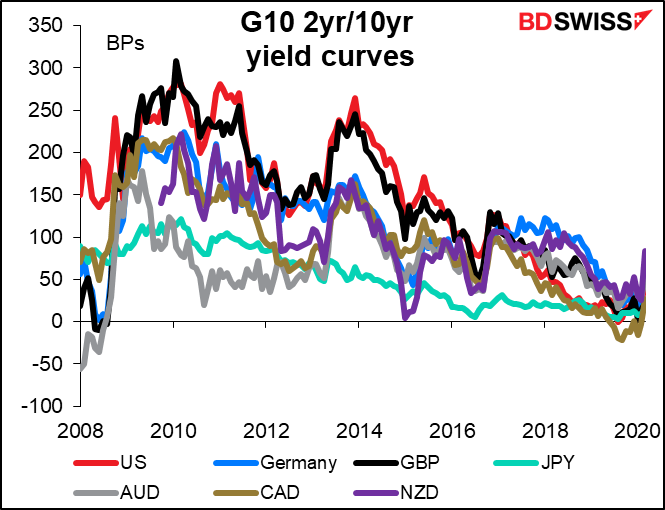
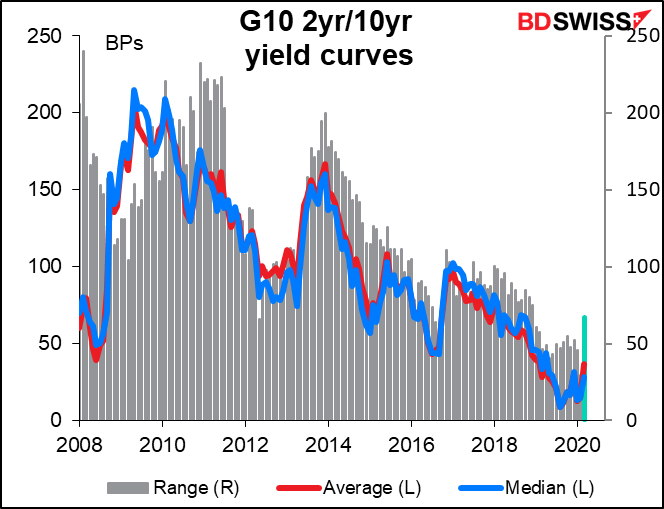
Although in the last few weeks curves have widened somewhat as yields at the short end fell faster than yields at the long end.

If the whole world is becoming “Japanified,” then perhaps we can look at Japan for a hint of what the future of the financial world looks like. It doesn’t look good as far as I’m concerned. Several Bank of Japan researchers looked at the impact of their situation on the Japanese bond market back in March 2018 and wrote up their findings in a paper, Central Bank Policy Announcements and Changes in Trading Behavior: Evidence from Bond Futures High Frequency Price What they found was that “the sensitivity to the Bank’s announcements has strengthened since the introduction of the negative interest rate policy (Jan. 2016), whereas the sensitivity to economic indicators and surveys has weakened substantially” (emphasis added). Since the BoJ introduced “quantitative and qualitative easing” in April 2013, the Japanese government bond market’s reactions to the release of industrial production data have fallen in half and the reaction to the release of the consumer price index “has more than halved.” Reaction to the eco-watcher’s survey has fallen slightly.
The BoJ lists three possible explanations:
- The interest rate has little room to move near the zero lower bound. This is what I had assumed – rates can’t move lower, and won’t move higher. However, the authors point out that if that were the case, the reaction of yields would be more attenuated on the downside than on the upside, but that isn’t the case, so they rule out that reason.
- The second is that the economic indicators themselves have become less volatile. The answer there is no, too.
- The third explanation, which they say is the most plausible, is that “market participants learn the meaning of each indicator not from their experiences but from the interpretation by the BOJ.” They confirm this hypothesis by noting that prices are more responsive in both directions to BoJ statements than to economic indicators. Furthermore, the time it takes for the market to react to indicators has slowed, but not its reaction to BoJ statements.
In other words, the market is uncertain of the central bank’s reaction function. Investors don’t know how indicators are likely to affect central bank thinking and central bank policy. Accordingly, they pay less attention to the indicators themselves and more to the central banks.
I think we can expect markets to react like this globally for the time being. The indicators from every country are likely to be uniformly disastrous – the worst on record in many if not most cases. But that won’t matter. It’s what the central bankers (and politicians) say that’s important. Are they pessimistic or optimistic? Are they going to increase their aid to the market, or are they going to start returning to normal policies? Are the politicians going to vote for more stimulus, or are they going to lift restrictions on activity? That’s what’s going to be important for now. The traditional guideposts for fundamental analysis – inflation, interest rates, growth rates, etc., are temporarily in abeyance. Official pronouncements, plus various flows such as loan & hedge rollovers or “safe-haven flows,” are what matters for now.
Indicators out this week: US retail sales, US industrial production, Bank of Canada meeting, and of course the initial jobless claims
Having said that, one might wonder why I’m writing about the upcoming indicators for the weeks, besides of course the fact that I get paid by the word. The reason is that even if the FX market doesn’t react as usual to the indicators, it’s still important to watch them so we can see how deep the downturn is likely to be and of course so we can tell when it starts to turn around.
There are no major EU or German indicators out during the week, nor UK indicators. EU industrial production for February may reflect some of the budding trauma in Italy, but the full brunt of the virus didn’t hit the EU until March.
The focus will therefore be on the US. The “new normal” for indicators now is to watch the weekly US initial jobless claims. Because of the quirks of the survey process for the nonfarm payrolls, this has taken over as the main indicator of the health of the US economy. Even so, it’s fatally distorted by the problems that millions of people have had in filing for unemployment insurance, because the processes and websites for filing can’t handle the volume of traffic. Even the appallingly high level of unemployment that these figures show no doubt grossly underestimates the severity of the real situation.
The consensus forecast is for an increase of 5.35mn newly unemployed persons Nobody really knows though – estimates range from 2mn to 8mn – from terrible to horrendous.

How would that translate into overall unemployment, and how would that compare with past bouts of unemployment? We’re already at a record number of unemployed persons – the 17.3mn initial claims for unemployment since the beginning of March already exceeds the previous record high for the number of unemployed, 15.3mn in October 2009 (a year or so after Lehman Bros. went bust).
Based on the forecast of 5.35mn more jobless claims this week, that would mean 22.6mn newly unemployed persons. Added to the 5.8mn who were unemployed in February, that would mean 28.4mn unemployed persons or an unemployment rate of around 17%. That’s still lower than 24.9% peak during the Great Depression, but we still have another week to go before the April employment survey.

Aside from that, the main US indicators out during the week are the retail sales and industrial production on Wednesday.
The March US retail sales figures will start to show the impact of the virus crisis. Survey forms are mailed to retailers five business days before the close of the reporting month, and the deadline for responses is three days after month-end, so the results should reflect the impact of millions of job layoffs and “stay home” restrictions. The result is expected to be more than twice as big a drop as the previous record drops (data going back to 1992).

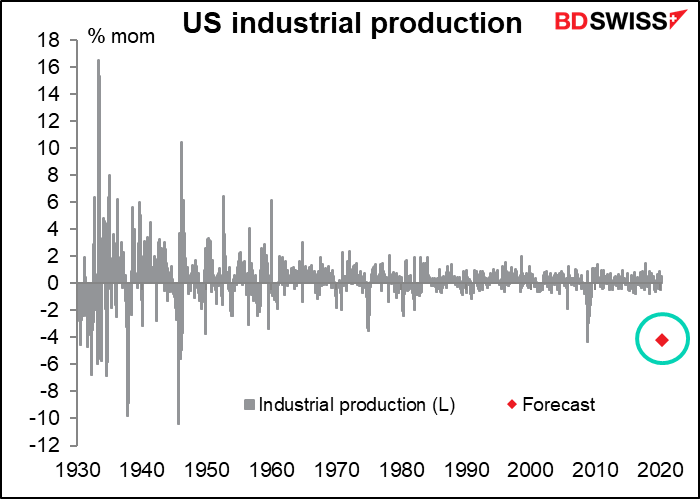
US industrial production is forecast to be down 4.2% mom, quite similar to the 4.3% drop in September 2008, the month Lehman Bros blew up (and a date that seems to pop up often when making such comparison). That in turn was the biggest decline since -10.4% in August 1945, and I hope I don’t have to remind you what happened in August 1945 (no, I was not around then). In other words, the market expects a decline that’s about equal to the largest recorded fall in peacetime.
We also get three housing indicators: the National Association of Home Builders (NAHB) index for April on Wednesday and housing starts and building permits for March on Thursday. Housing is expected to slow, but not in the record-breaking way that other sectors are collapsing.
Three regional Fed presidents speak this week: St. Louis Fed’s Bullard, Chicago Fed’s Evans, and Atlanta Fed’s Bostic (twice). They are all virtual conference calls and at least one of them – Bostic’s talk on Tuesday (he speaks again on Wednesday) will be livestreamed. This may be a new trend. Since in-person conferences are out of fashion now, more and more speaking engagements will be virtual, through Zoom and other webinar software. This makes it easy to open the talk up to the general public if they wish by posting it on a web site.
There will be a Bank of Canada meeting on Wednesday. The Bank last month cut rates by a huge 175 bps – 50 bps at its scheduled 3 March meeting and 100 bps at two unscheduled meetings. Now at 0.25%, its overnight lending rate is at what Gov. Poloz called “the effective lower bound.” I don’t see any further cuts in store unless things get really, really bad (and the fact is, we’re redefining “really, really bad” every day). And after implementing several new operations, such as the Large Scale Asset Purchases (LSAP) in which it buys CAD 5bn a week in government bonds, or the Commercial Paper Purchase Program, I doubt if it will unveil any new policy measures either.
In that case, everyone will be waiting for the update that it promised on 13 March, when it said “the Bank will provide a full update of its outlook for the Canadian and global economies on April 15.” It will give updated economic projections and its new estimate for the neutral rate. The focus will be how they see H2 shaping up in comparison to H1. That will give us a clue to how long they expect the economy to remain shut down and how rapidly they see the economy recovering.
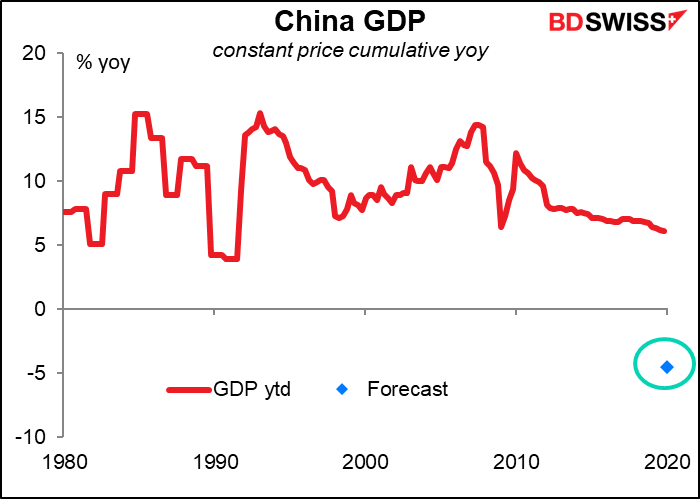
China announces its Q1 GDP on Friday, together with retail sales, industrial production and fixed asset investment for March. GDP is expected to plunge (surprise surprise!) – the consensus forecast is for it to flip from +6.0% yoy to -6.0% yoy. That’s the first-ever negative reading for China, albeit the data only goes back to 1992 so it’s hardly a complete historical record.

There is a longer data series of year-to-date GDP growth. That shows what an outlier this figure is over the last 40 years.
The monthly data are expected to be no better as they’re all expected to show a sharp yoy decline too. Unfortunately we can’t compare March with February as China doesn’t release February data alone – every year it releases January and February combined, because of the distortion caused by the week-long Lunar New Year holiday. Nonetheless, the data should show decisively that a “V”-shaped recovery is unlikely.
Separately, the IMF/World Bank Spring meeting will be held this week. Usually that means a full schedule of the great and the good giving interviews and press conferences, but this year the meetings are being held virtually. The press briefings will all be streamed live; you can watch them on the IMF’s website, including today’s release of the twice-a-year World Economic Outlook.


