Rates as of 05:00 GMT

Market Recap
Some unusual market divergence today: stocks are very much in a “risk on” mood but the FX market has a distinctly “risk off” pattern. The S&P 500 closed up 3.1% and while stocks in Asia are mixed this morning, the gainers are far outpacing the losers (e.g., KOSPI +1.1% vs TOPIX -0.1%, Malaysia +1.6% vs Jakarta -0.7%). But S&P 500 futures are indicated -0.6% this morning.
Equity market investors seem to think that the signs of a flattening in infection and death rates from the virus in most of the developed world are more important than the question of when the restrictions will be lifted and how fast the recovery will be after that. Perhaps the extraordinary support from both fiscal and monetary authorities has made the second question irrelevant, as far as investments are concerned. As one fund manager reportedly said, he’s just buying whatever the Fed is buying.
Having said that, there were press reports that US health officials have begun drafting plans to end social-distancing measures and reopen businesses. The plan, called the “Framework for Reopening America,” envisions low-risk areas opening sometime after 1 May, with moderate- and high-risk areas reopening later.
My guess is that currencies were more affected by the long-term outlook emanating from the IMF Spring meeting, which started with the semi-annual World Economic Outlook yesterday. The report, entitled “The Great Lockdown,” forecast that world GDP would contract by -3.0% this year, far more than the -0.1% global contraction in 2009. This is because they see both developed and emerging economies contracting. Click on the link if you’re interested in the details.
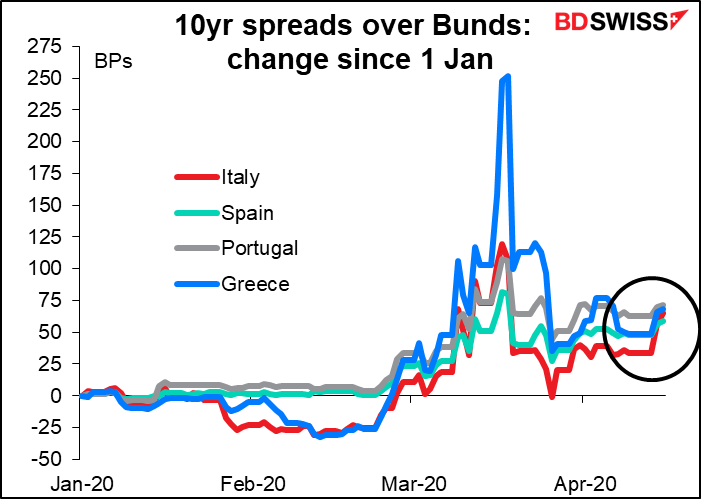
It isn’t much, but spreads of peripheral Eurozone bonds have started to widen out again as doubts emerge about the EU’s commitment or ability to fund these countries. These fears could start to weigh on the euro, perhaps not vs USD (which is trading largely on the basis of supply & demand from investors rolling over loans & hedges) but especially on the crosses. I think EUR/JPY could be vulnerable here if a general “risk off” mood emerges that sends JPY higher while further calling into question the EU’s commitment.
Uh oh for Britain…Reading the FT this morning, I saw the word “Brexit” again for the first time in a long time. It seems that with the COVID-19 crisis becoming manageable, officials are considering restarting the talks, albeit by conference call now. And again, the usual stalemates are cropping up, this time over fishing rights. According to the FT, the EU wants to preserve as many of its existing rights as possible for more than 70 types of fish that straddle EU-UK waters. But Britain wants to scrap the existing model for dividing up quotas and leave many issues open for annual negotiation. “If there is no progress on this, then there will be no progress in other areas,” one EU official reportedly told the newspaper. Brexit discussions can only hurt the pound as they remind the investing public of the unique difficulties that Britain will face on top of the difficulties that every other country faces now.
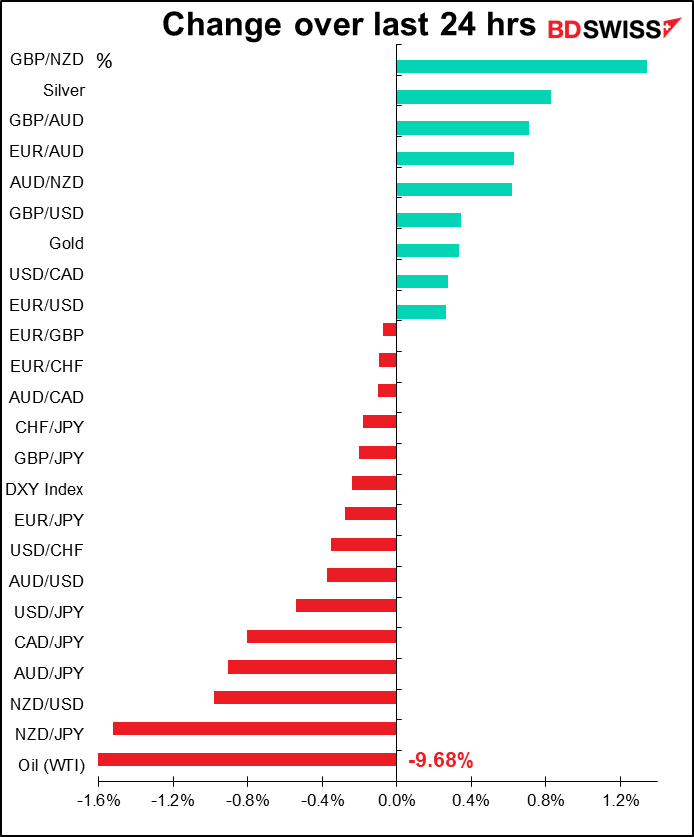
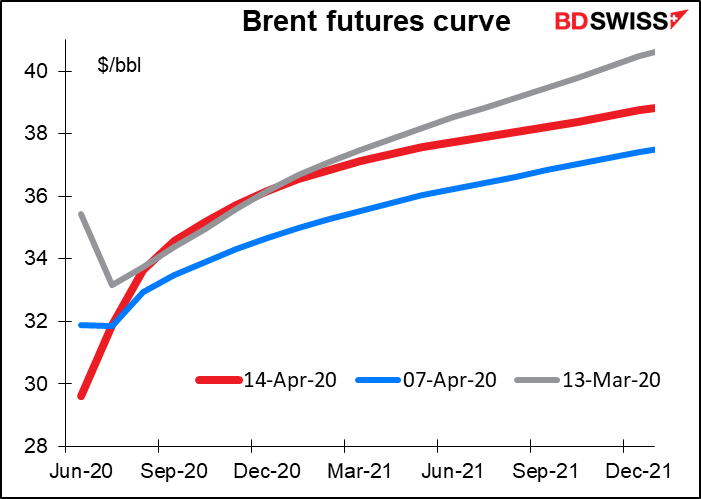
The boost to oil prices from the OPEC+ agreement didn’t last long, if indeed there were any such boost. US benchmark West Texas Intermediate (WTI) is down 9.7% this morning while European benchmark Brent blend is off 7.1%. The IMF’s gloomy forecast cast a pall over the market. At the same time, Saudi Arabia while has said it will cut production in May, all indications are that for the time being it continues to pump huge amounts. Furthermore, the OPEC+ agreement covered volumes but not prices. Saudi Arabia’s posted prices for May include even deeper discounts than before.
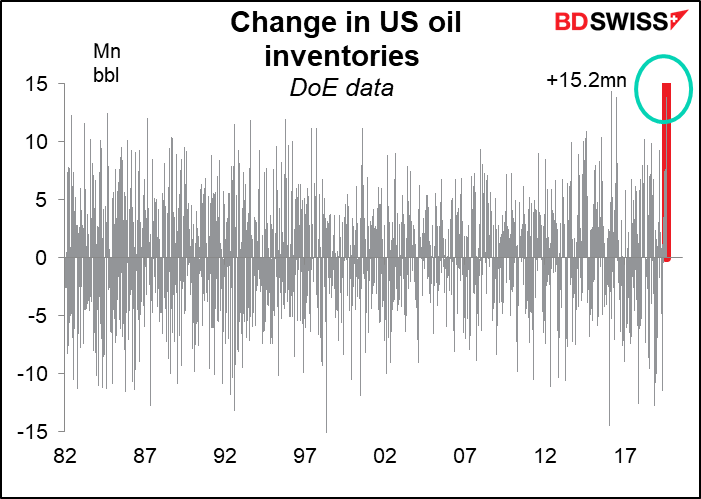
Adding insult to injury, the American Petroleum Institute (API) announced another huge increase in oil inventories in the latest week, the third week in a row. It said inventories rose 13.1mn barrels, coming after what it estimated to be +11.9mn the week before and +10.5mn the week before that.

Tonight’s US Dept of Energy inventory figure is expected to be around +12.7mn barrels. While the two series differ week-by-week, over the longer term these differences generally offset each other and the two are nearly identical.
Just to put things in perspective, last week’s increase in inventories was the largest ever in data going back to 1982, according to the Department of Energy’s figures.
With so much oil looking for someplace to store it, prices of oil for near-term delivery are much lower than the price of oil for future delivery.
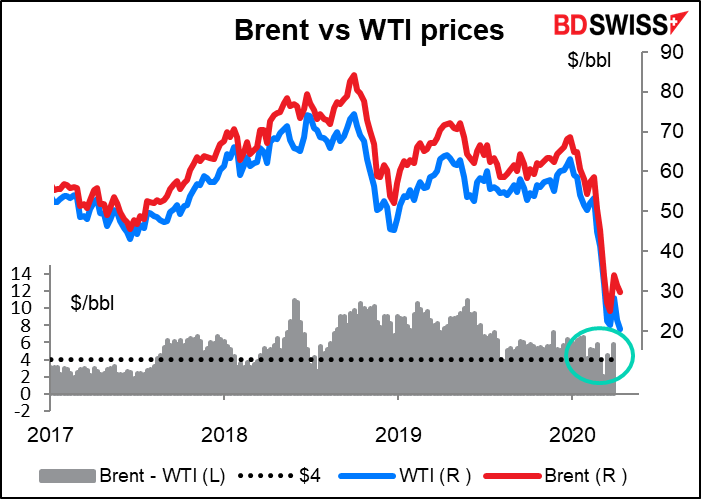
However, the agreement has been “successful” from the US point of view, at least in one way. The agreement has shored up the price of Brent, which competes directly with OPEC+ oil, better than that of WTI. That means the price of WTI has fallen faster than that of Brent. As that happened, the spread between WTI and Brent has expanded to $9.33/bbl from just $2.12 a month ago. This is far above the $4/bbl necessary to make it worthwhile for oil companies to ship US oil to Europe. That will of course be cold comfort to the many US oil companies that will have to shut down their wells because the price is simply too low in any event to make it worth their while to continue producing. But it does imply that the fight for market share between US producers and OPEC+ producers won’t end any time soon, meaning continued strife in the oil world.
Today’s market
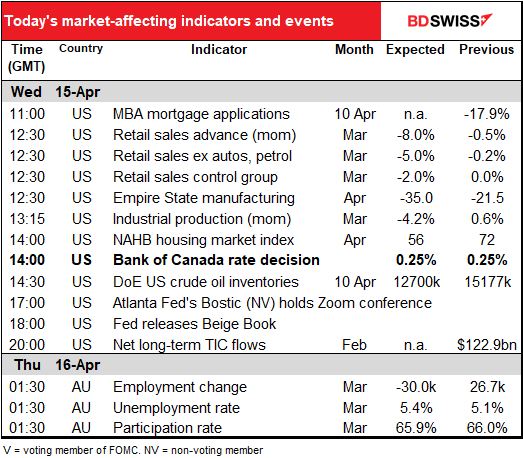
The Bank of Canada meeting will be the big event, or maybe the big non-event, of the day The Bank last month cut rates by a huge 175 bps – 50 bps at its scheduled 3 March meeting and 100 bps at two unscheduled meetings. Now at 0.25%, its overnight lending rate is at what Gov. Poloz called “the effective lower bound.” I don’t see any further cuts in store unless things get really, really bad (and the fact is, we’re redefining “really, really bad” every day). And after implementing several new operations, such as the Large Scale Asset Purchases (LSAP) in which it buys CAD 5bn a week in government bonds, or the Commercial Paper Purchase Program, I doubt if it will unveil any new policy measures either.
In that case, everyone will be waiting for the update that it promised on 13 March, when it said “the Bank will provide a full update of its outlook for the Canadian and global economies on April 15.” It will give updated economic projections and its new estimate for the neutral rate.
The Bank was expecting Canadian growth to accelerate this year to +1.9% yoy from 1.5% last year and accelerate further to 2.1% next year. Hah! We’ll see how much that projection changes in just three months. The focus will be on how they see H2 shaping up in comparison to H1. That will give us a clue to how long they expect the economy to remain shut down and how rapidly they see the economy recovering.
As for the neutral rate of interest, its “overall assessment” was that it’s 2.25%-3.25%. That’s likely to be lowered somewhat.
Today’s indicators:
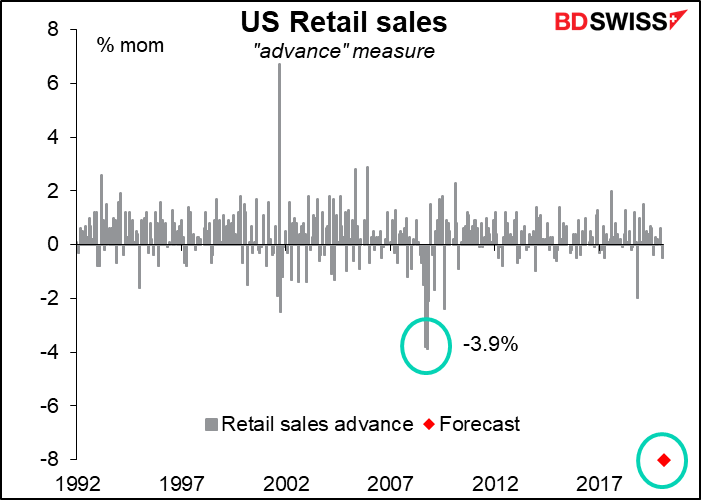
Today’s US retail sales figures will start to show the impact of the virus crisis. Survey forms are mailed to retailers five business days before the close of the reporting month, and the deadline for responses is three days after month-end, so the results should reflect the impact of millions of job layoffs and “stay home” restrictions.
The result is expected to be more than twice as big a drop as the previous record drops (data going back to 1992). For the “advance” measure, which includes sales of all goods, that record was set in October 2008, the month after Lehman Bros. went bust. Approximately 25% of all retail sales are autos, so some analysts prefer to look at retail sales excluding autos. I also prefer to exclude gasoline sales, as any change in the price of can swamp the impact of a change in demand. That series, excluding autos and gasoline stations, had its worst month in November 2018, when it was down 2.3% mom. In both cases, sales in March are expected to fall about twice as much. And remember: one person’s spending is another person’s income.

The Empire State manufacturing survey is expected to hit a record low in data going back to July 2001. Not so for the Philadelphia Fed business outlook survey, which is due out tomorrow. That’s seen far worse days in its much longer history, which stretches back to May 1968. (Can anyone tell me what was happening in May 1968? That was the time of the student riots in Paris! Heady days of Dany le Rouge!) Both indices by the way suffered their worst-ever declines last month, -34.4 points for the Empire State index and -49.40 points for the Philly Fed index. They’re not expected to fall anywhere near that amount this month (-13.5 for the Empire State index and -17.3 for the Philly Fed index) but who knows, really?

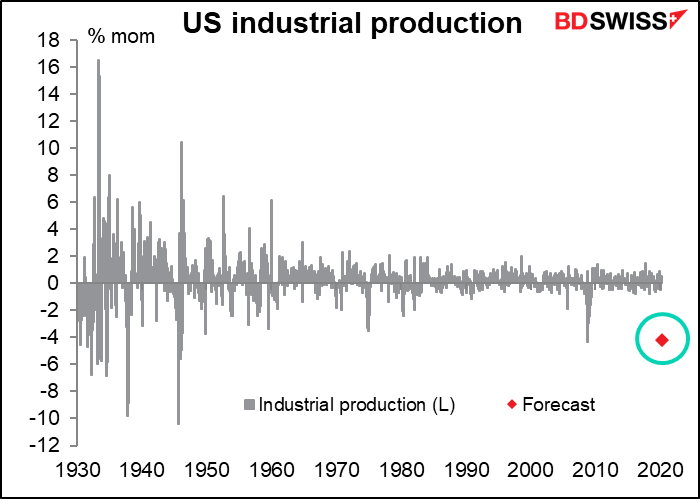
US industrial production is forecast to be down 4.2% mom, quite similar to the 4.3% drop in September 2008, the month Lehman Bros blew up (and a date that seems to pop up often when making such comparison). That in turn was the biggest decline since -10.4% in August 1945, and I hope I don’t have to remind you what happened in August 1945 (no, I was not around then). In other words, the market expects a decline that’s about equal to the largest recorded fall in peacetime. (Note: actually the industrial production series goes back to 1919, but Bloomberg only has it going back to 1930.)
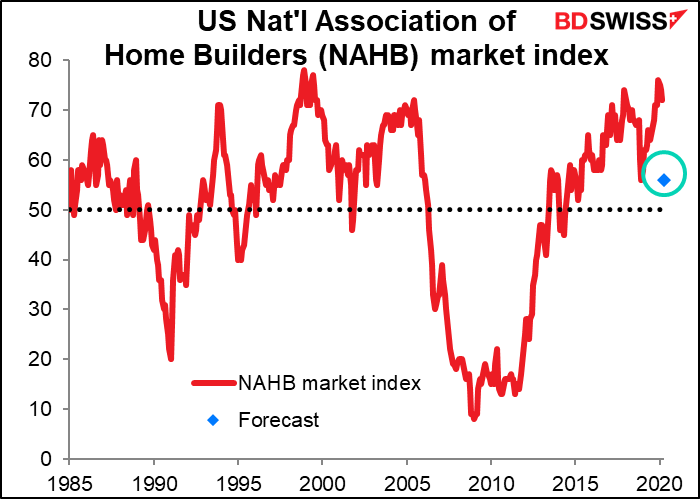
The National Association of Home Builders (NAHB) sentiment index is expected to plunge – no surprise there if people can’t leave their houses. The forecast figure would by no means be the lowest on record. In fact, I’m amazed that it’s expected to remain above 50, which signals continued optimism among housebuilders. (The index is a diffusion index where 50 is considered neutral.) On the other hand, the 16-point collapse would indeed be the biggest one-month drop ever seen (the current record was -10 points in February 2014).
The Fed releases the “Summary of Commentary on Current Economic Conditions,” aka The Beige Book (which actually looks green to me, at least the version you can buy in the store) as always two weeks before the next FOMC meeting. It’s significant for the market because the first paragraph of the statement following each FOMC meeting tends to mirror the tone of the Beige Book’s characterization of the economy. The book doesn’t have any number attached to it that quantifies its contents, but many research firms do calculate a “Beige Book index” by counting how many times various words appear, such as “uncertain.” In any case, the book is largely anecdotal so you’ll just have to watch the headlines as they come out.
Overnight, Australia announces its employment data. This usually is a big deal for AUD, because the Reserve Bank of Australia (RBA) has made it clear that employment is now the key variable that it’s watching, but of course standard operating procedure has gone out the window at the RBA like everywhere else. On the other hand, employment is perhaps the key indicator everywhere now as we try to gauge the impact of the virus on different economies.
The Australia figure is expected to be surprisingly normal – the change in employment, forecast to be -30k, was quite common from 2012-2014, while the forecast unemployment rate of 5.3% is a mere 0.3 percentage point rise – hardly anything in today’s world. This is probably because of the timing of the survey, like what happened in the US. The reference period for the survey is the first two weeks of the implemented until the latter half of the month. The April figures are therefore likely to be much, much worse.