


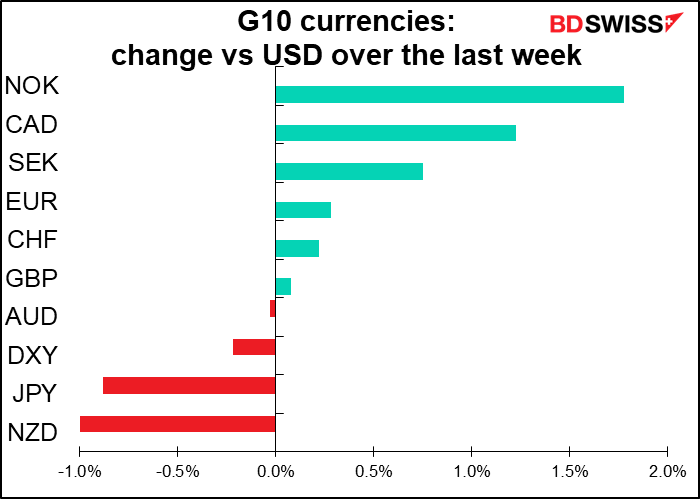
We’ve had a dramatic week with lots of volatility. That’s one aspect of the summer doldrums: the absence of participants can either lead to a dull market or an especially volatile market.
Aside from the continuing decline in the dollar, there were two main themes this week: the rise in oil prices and the concomitant rise in CAD, and the wild gyrations in gold and silver.
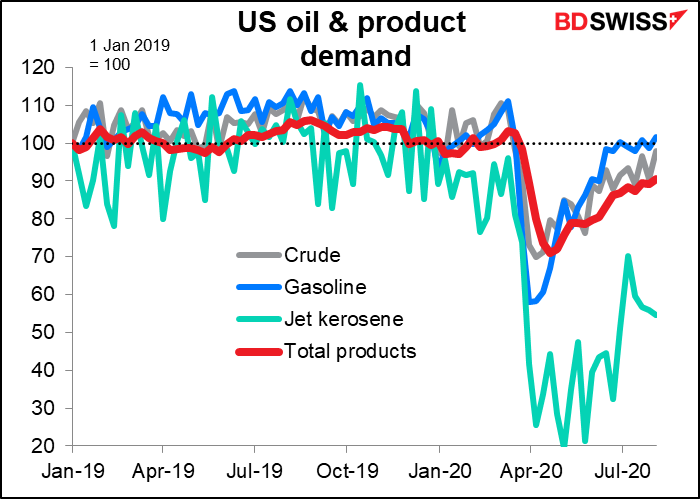
Oil is rising on indications that demand is improving. Oil inventories in the US have been down three weeks in a row despite OPEC+ cutting its output cuts (if you follow my double negative). That’s given the oil market some confidence that demand is recovering. It appears that gasoline demand in the US is back to normal at least.
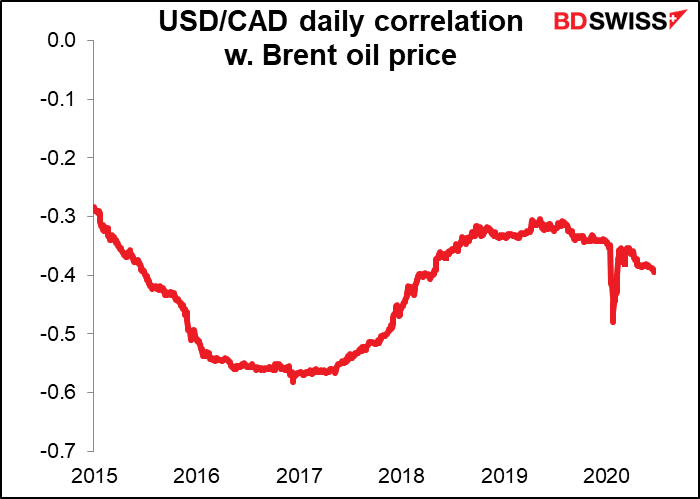
CAD has generally followed oil higher. It’s not the currency most closely correlated with oil – that honor goes to RUB – but the correlation is relatively close and becoming closer. It’s been much higher in the past though, which suggests it can still go higher. (Actually the correlation is negative since we’re comparing Brent with USD/CAD, but never mind.)
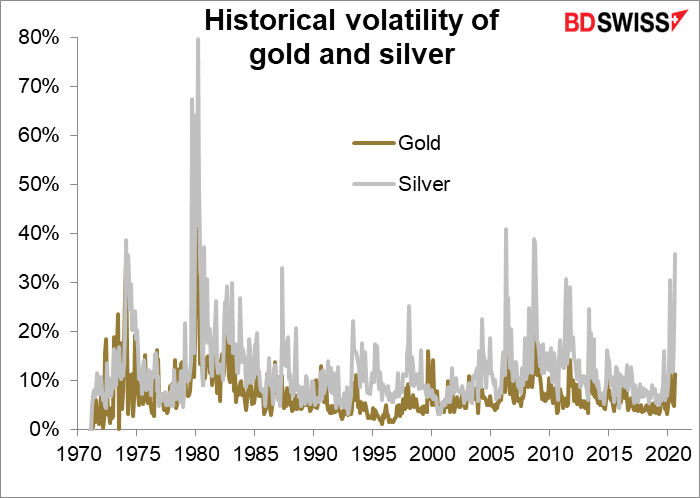
The other main theme of the week has been the wild gyrations in gold and silver. Positioning data doesn’t explain why. I can only think it’s just plain ol’ fear and greed, the basis of all markets. As a fundamental analyst I can’t be of much help at the moment – this is all up to market sentiment.
In any event, it may be reassuring to know that such volatility in these markets is hardly unprecedented. I’ve been in the market long enough to remember that on 3 Jan. 1980, the Paris Bourse suspended gold trading for the first time in its history because of an order imbalance – buyers only. The next day it also had to suspend trading because of an order imbalance – sellers only. Those were volatile days. (I won’t ask my readers what they were doing in 1980…)
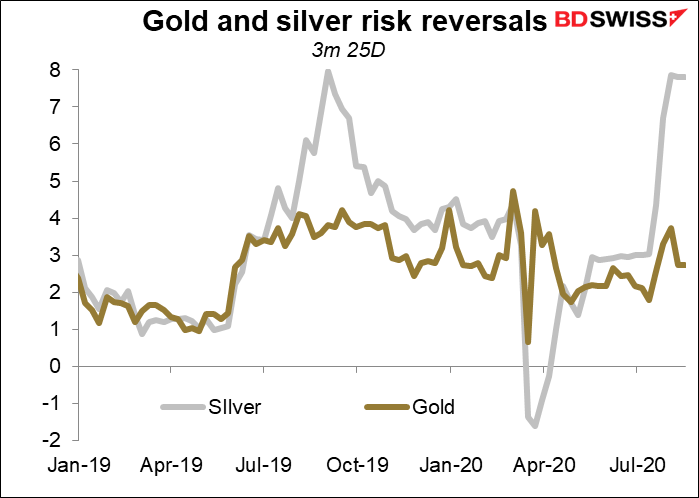
I would like to point to the risk reversals for both gold and silver are still positive. The market is still more worried about missing out on the rally than protecting their profits!

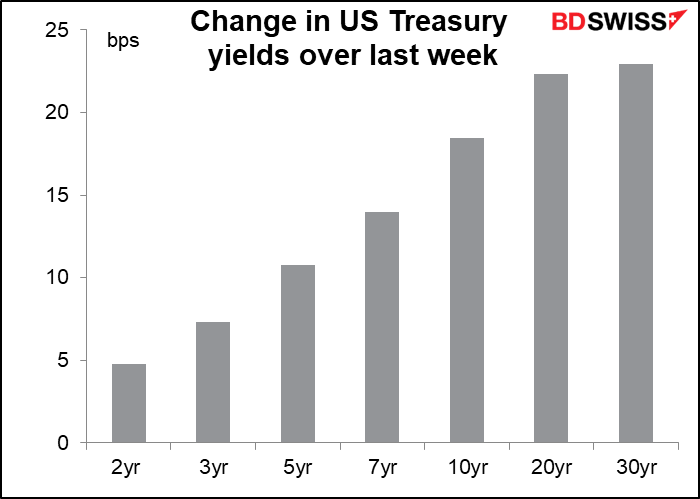
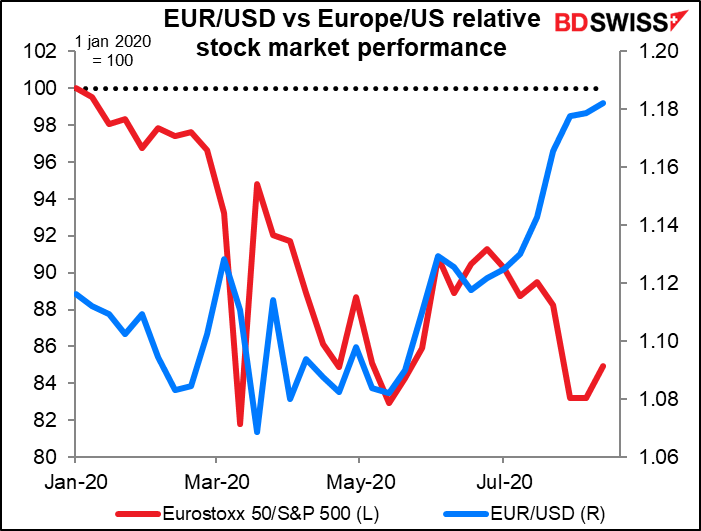
As for the dollar, I’m intrigued that neither the sharp rise in Treasury yields across the curve this week nor the outperformance of the US stock market has supported the currency at all. Sentiment toward the dollar must be really, really bad.
The market next week: preliminary PMIs, Japan 2Q GDP
August is traditionally the vacation month for Europe. All France shuts down and heads for the beach, everyone else goes to France for vacation. There’s only one more G10 central bank meeting this month (Norges Bank on the 20th) and the Fed’s virtual Jackson Hole meeting is on Aug. 27-28. Only one Fed speaker on the schedule for the coming week, and that’s not even a policy discussion (SF Fed President Daly on “The New Future of Work,” which given the US employment situation right now, might be an extremely short discussion.) And to top it off, there aren’t that many major indicators out either.
The big event will be the preliminary purchasing managers’ indices (PMIs) for the major industrial countries on Friday. If it seems like these monthly PMIs come about more frequently than every month, it’s because they do. Generally speaking the preliminary ones come out, well, about now – the Thursday or Friday of the third full week in the month — and then the final ones at the beginning of the next month. So we’re rarely three weeks away from the next PMI.
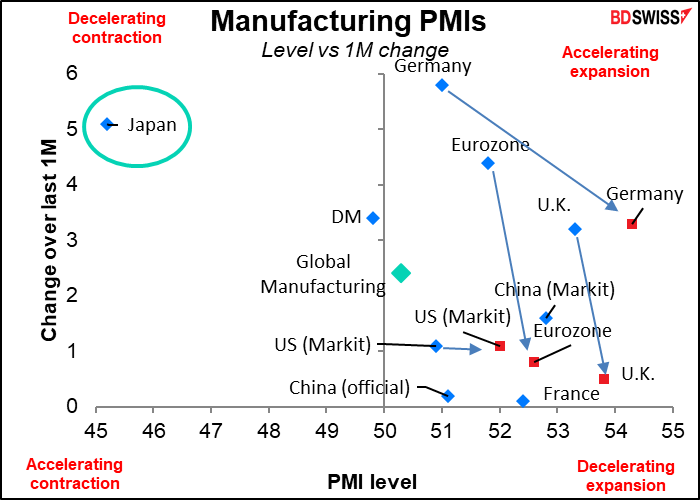
From the forecasts that we have now, it looks like the market expects the manufacturing PMIs to continue to improve (i.e, move to the right) but at a slower pace (i.e., move down). That makes sense, especially as they are back in the “expansionary”area above 50. Now that they’ve stopped contracting, they are likely to expand only slowly and cautiously.
Japan remains the outlier here – I wonder how it will do. Bloomberg doesn’t have a consensus forecast for the Japan PMIs, perhaps because they don’t track well with Japan GDP. Indeed, other high-frequency data suggests Japan’s economy has been the least affected by the virus of any of the major economies, which makes its PMI readings look suspicious. We’ll know more on Sunday, when Japan 2Q GDP is released.
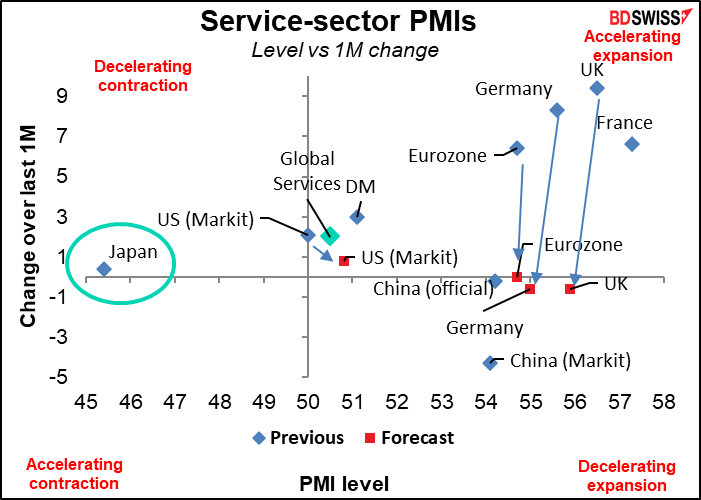
With services, it’s a different story. Most of the expected movement is simply down and indeed slightly to the left – a decelerating expansion. The red dots are clustered around the “no change” line, with a few even below. Only the US is expected to improve, and even that’s just marginal. Again, Japan is an outlier.
The story from the service-sector PMIs seems to be the “V”-shaped recovery has run its course – now it’s all we can do to stay in place as normal life resumes and the virus creeps back up again (or gallops, depending on which side of the Atlantic you live on.)
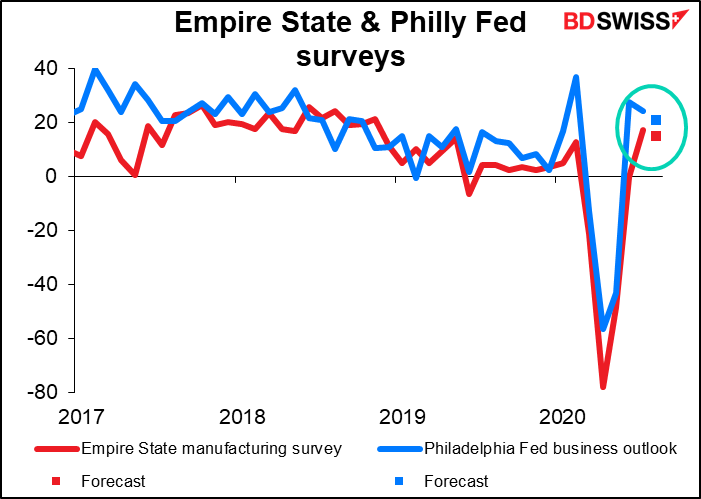
The Empire State and Philadelphia Fed surveys for August are expected to tell the same story: continued expansion but at a slightly slower pace.
Central bank minutes: RBA, FOMC, ECB
The minutes of the latest central bank policy meetings from Australia, the US, and the Eurozone will be released.
Tuesday’s Reserve Bank of Australia minutes probably won’t have that many revelations, because the meeting was accompanied by a quarterly Statement on Monetary Policy, and just yesterday, Gov. Lowe testified in the House of Representatives. So I wonder what more we can learn.
The FOMC minutes, which come out Wednesday, usually contain some fascinating tidbits even after Fed Chair Powell holds an exhaustive press conference following the meeting. The focus this time will probably be on their discussion about “the broad review of the strategy, tools, and communication practices” that the Fed started back in 2018. That seems to be drawing to a close; people will want to know what the Committee’s views are. Indications are that they may allow inflation to overshoot their 2% target to compensate for periods when it’s under 2%. The other focus is yield curve control, which is of particular interest now as 30-year yields are up about 19 bps in one week.
The Eurozone minutes…I think the differences of opinion on the Executive Council are fairly well known, and with no decisions coming out of the meeting, I don’t think this will be a major source of headlines.
The US housing market is likely to show its strength in housing starts & building permits on Tuesday and existing home sales on Friday. Starts are expected to rise 4.1% and permits are expected to rise an even faster 6.5% in anticipation of an acceleration of building in the future.
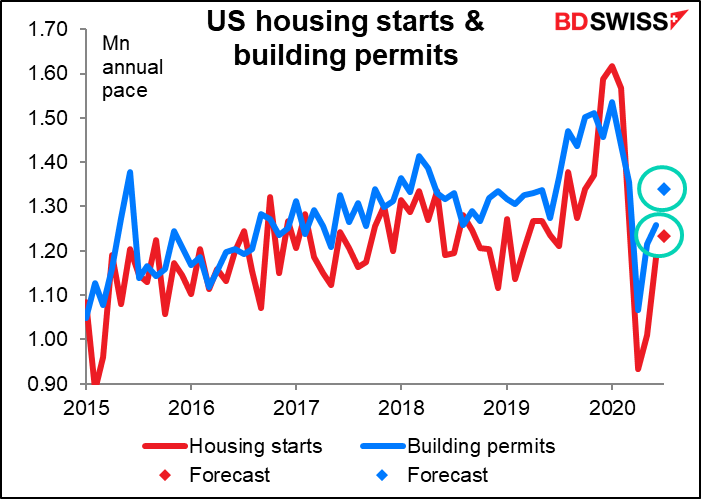
And Friday’s existing home sales are expected to be up by even more: +12.9%.
Strong housing markets seem to be an international anomaly in this recession (Britain being the major exception) as mortgage rates hit record lows at the same time as people all over the developed world suddenly discover that a) they can work from home and b) to do so, they need to have a spare room for an office. Why not move to the ‘burbs and get a full-fledged house: more space for less money? Companies love the idea too as they can save on rent (in effect, getting their employees to provide their own workspace). We saw the same phenomenon in Canada this past week as housing starts jumped – they’re now higher than they were back in January and February. Condo sales in downtown Vancouver plunged 18% yoy in July while house sales in the nearby Fraser Valley, 123 km away, surged 56%.
One result of this global rush to suburbia: while gold and silver have been attracting all the attention, lumber futures hit a record high this week.
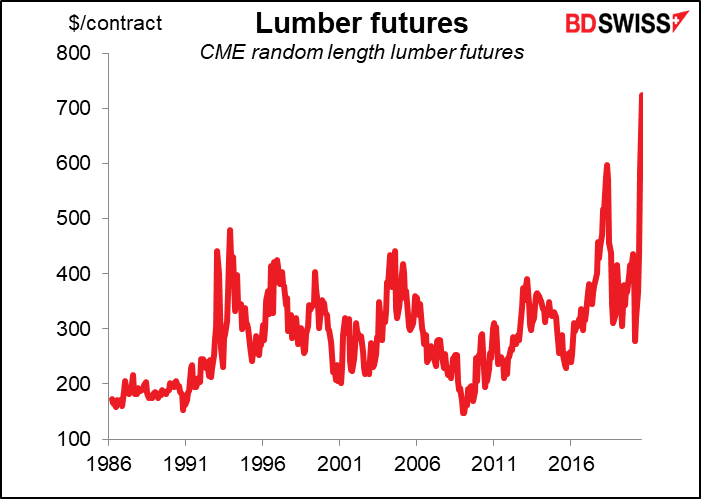
In fact, while the trading world has been mesmerized by soaring silver and galloping gold, they’ve both been outperformed by lumbering lumber this year. Shiver me timbers!
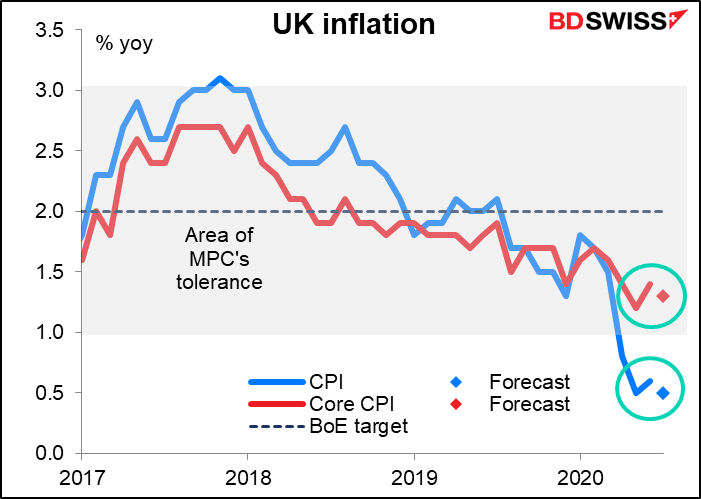
Britain releases its inflation data on Wednesday and retail sales on Friday. Unlike the US, both headline and core are expected to be lower. That means higher real yields = good for sterling? Or does it just make further loosening more likely = bad for sterling? I suspect the latter. The difference is that the Fed isn’t likely to react to higher inflation, but the Bank of England might react to lower inflation.
Canada announces its inflation data on Wednesday (no forecasts available) and Japan on Friday (forecasts available, but too boring to bother with.)
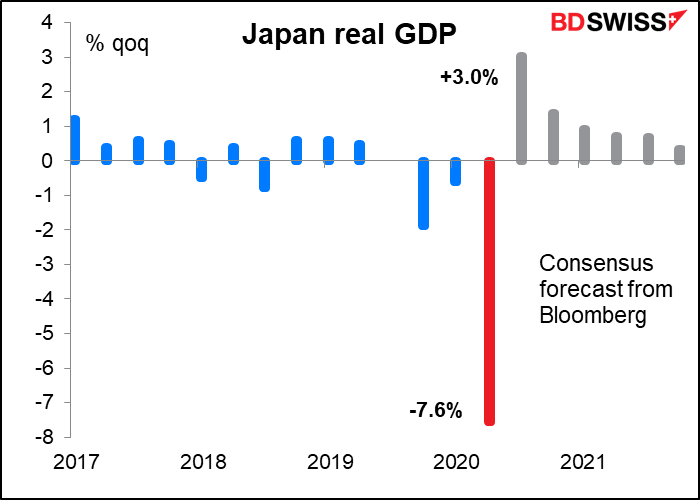
The big indicator for Japan during the coming week will be Monday morning’s release of Japan’s Q2 GDP. It’s expected to be down -7.6% qoq, which isn’t bad the way things are going – the US was -9.5% qoq, Eurozone -12.1%, and I don’t even dare mention the UK (-20.4%, and no, that’s not SAAR, it’s just qoq.) (See today’s weekly for more information on this.)
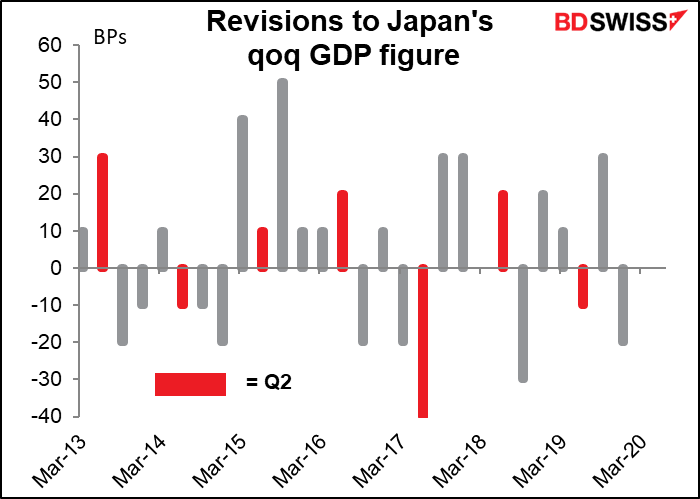
One thing you can be certain of though: no matter what the Japan GDP figure is, it will be revised, probably substantially. And these revisions are subject to revision years later, as the final tax figures aren’t available until after the end of the fiscal year next March.
According to the OECD, from 2001 to 2018 Japan’s real quarterly GDP figures changed an average 0.4 percentage point between initial estimates and assessments half a year later, the most among the G7 nations. The rest were all under 0.3 ppt on average, with the US under 0.2 ppt. (Sorry, I can’t find the original OECD document, just this article referring to it.)
The main problem is in measuring capital spending, which accounts for nearly 20% of GDP. The initial figure uses production data while the revised figure uses quarterly corporate surveys that don’t come out until a week before the revised GDP figure. The revisions have even turned contractions into expansions, such as 2015 Q3 GDP, which was initially estimated at -0.8% qoq but then revised to +1.0%.Then months if not years later it’s all revised again once taxes are paid. Those revisions have turned entire recessions into expansionary phases.
Japan also releases its trade data and machinery orders on Wednesday


