
Rates as of 04:00 GMT
Market Recap
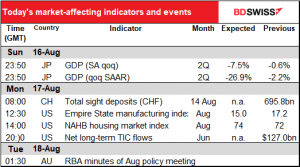
We’ve already had the big news for the day out – Japan Q2 GDP was slightly weaker than expected, -7.8% qoq vs -7.5% market consensus. This compares favorably with the US (-9.5% qoq), Eurozone (-12.1%), and of course the UK (-20.4%). Tokyo stocks are down this morning and the yen is a bit firmer on risk aversion.
However the rebound is expected to be shallower than in those other countries as well, so at the end of the day the Japanese economy is expected to get back to normal at about the same time the US and Eurozone do. The UK is expected to be the laggard as it not only had the deepest decline but will be undergoing Brexit while trying to climb out of the hole.
Unfortunately there are big doubts about the pace of the rebound in Q3 in all countries owing to the increase in infections recently.
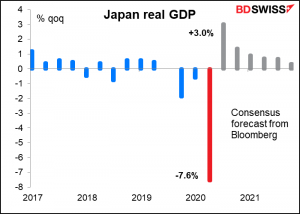
Otherwise, not that much movement in currencies. It’s noticeable that AUD was the best-performing currency and CAD and NZD the worst – the commodity currencies certainly aren’t moving together today! NZD fell victim to the virus – NZ PM Arden decided to delay the country’s election by four weeks as Auckland, the country’s largest city, is in lockdown due to an outbreak. And this in a country that had been down to zero cases recently!
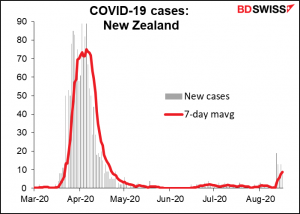
The decline in CAD is somewhat of a mystery to me – for once it’s not due to any movement in oil prices, which rose today.
It could be just due to profit-taking after four consecutive days of gains, especially as Canadian long yields declined on Friday. The move was especially puzzling as the manufacturing sales figure came in much stronger than expected (+20.7% mom vs +16.4% expected), with new orders rising as well for the second month.
It could be that the friction between PM Trudeau and his Finance Minister, Bill Morneau, is weighing on the currency. Last week it emerged that Trudeau was consulting with former Bank of Canada & Bank of England Gov. Mark Carney on the economic recovery plan for the country, which apparently called into question Morneau’s role and his future in the government (the scuttlebutt being that Carney wants Morneau’s job). Trudeau and Morneau are expected to meet today.
As for the rise in AUD, that was largely people buying AUD/NZD. Not only is the outlook for NZD clouded by the new lockdown there, but also there’s monetary policy divergence between the two countries: RBNZ Gov. Orr has implied he’s happy to further frontload purchases under the government’s Large Scale Asset Purchase (LSAP) program, while RBA Gov. Lowe showed no rush to adjust policy in his testimony before Parliament Friday.
Elsewhere, EUR/USD rose pretty steadily from mid-morning Friday in Europe and has resumed climbing this morning – continuing dollar weakness, the recent theme in the market.
Today’s market
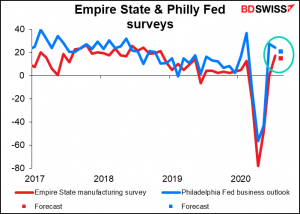
The Empire State manufacturing survey out today and Friday’s Philadelphia Fed survey are expected to tell the same story: continued expansion but at a slightly slower pace. Both are expected to remain in expansionary territory but at a slightly lower level than last month, consistent with the expansion losing some momentum.
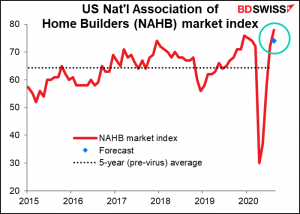
Today’s National Association of Home Builders (NAHB) market index is a bit of a mystery. When I was writing this last night, I noticed that my spreadsheet somehow downloaded a number for August! However I could find no reference to a story about it anywhere. I checked and the number in the Bloomberg system is indeed the same number that the NAHB has on its website for August. It looks to me like the NAHB accidentally released the data a day or two early and no one at Bloomberg (or any other news agency, for that matter) noticed, but the automatic system that Bloomberg uses to download data from the website did notice. The important point is that the actual number beats the estimate by quite a lot (78 vs 74) and in fact is tied for the record high, hit only once before (December 1998.)
This is the closest you’ll ever come to legal inside information. I would expect homebuilding stocks to do well based on this news!
What is this index exactly? According to the NAHB’s website:
The NAHB/Wells Fargo HMI is a weighted average of three separate component indices: Present Single-Family Sales, Single-Family Sales for the Next Six Months, and Traffic of Prospective Buyers. Each month, a panel of builders rates the first two on a scale of “good,” “fair” or “poor” and the last on a scale of “high to very high,” “average” or “low to very low”. An index is calculated for each series by applying the formula “(good – poor + 100)/2” or, for Traffic, “(high/very high – low/very low + 100)/2”.
Each resulting index is first seasonally adjusted, then weighted to produce the HMI. The weights are .5920 for Present Sales, .1358 for Sales for the Next Six Months, and .2722 for Traffic. The weights were chosen to maximize the correlation with starts through the following six months.
The HMI can range between 0 and 100.
The Treasury International Capital (TIC) flows data on capital flows into and out of the US are not a major market mover but they are watched, particularly the net long-term flows. However note that the data are rather old – today’s number is for June, which is ancient history by now. No forecasts are available.

Overnight, the Reserve Bank of Australia (RBA) releases the minutes of its 4 August Policy Board meeting. Not much new is likely, given that the meeting was accompanied by a quarterly Statement on Monetary Policy and Gov. Lowe last week testified in the House of Representatives.
The only thing I’ll be curious about is what discussion led them to restart their bond buying program in defense of their 0.25% target for the benchmark three-year bond. They explained that they were doing it because the yield had been “a little higher than 25bps over recent weeks,” but really, little is the operative word here – from April, the highest closing yield was 0.28%, which most people would not think to be significantly higher than the 0.25% target. I’ll be interested in reading exactly what they thought about this issue and why they got so excited about 3 bps.
Questions? Comments? Complaints? Something you don’t understand? Chat with Marshall at [email protected]


