The seemingly inexorable decline in global bond yields continued over the last week.
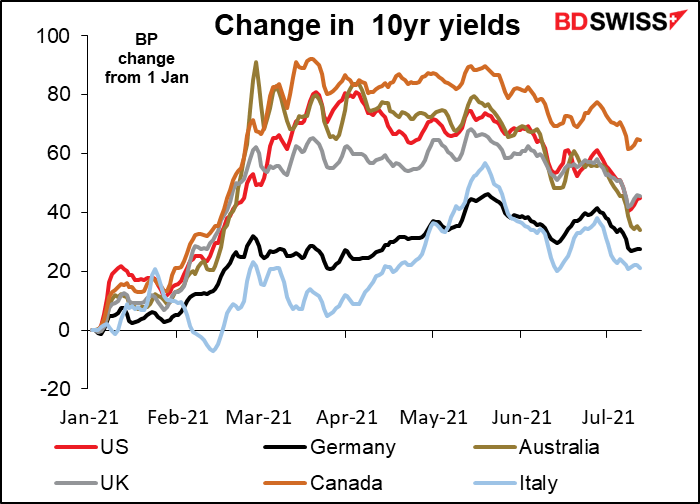
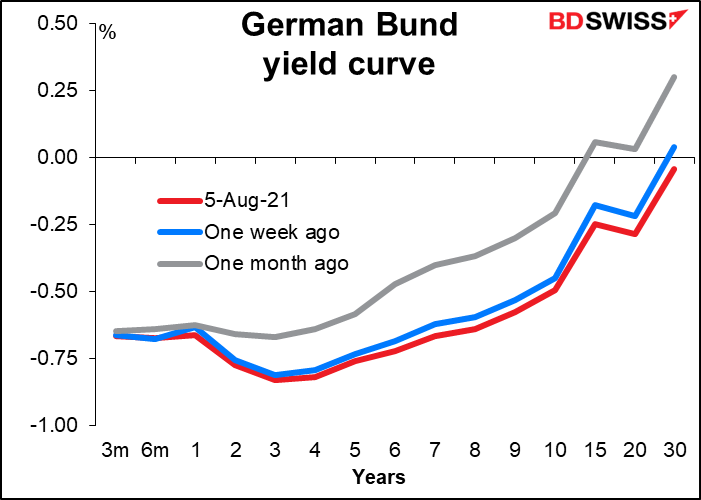
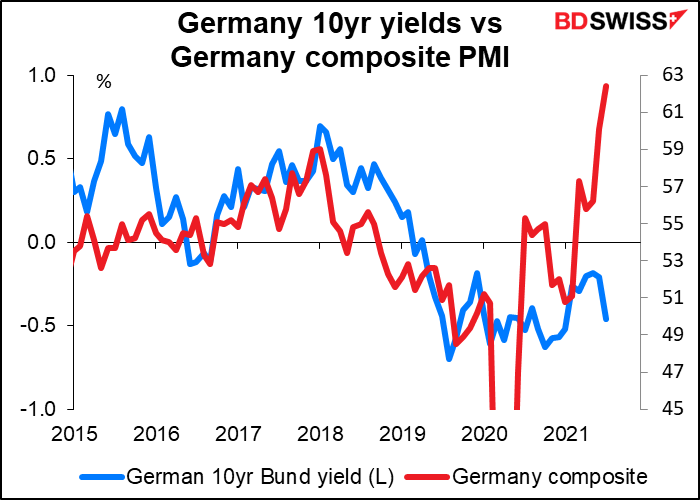
US yields are retesting the recent lows set back in July. In Germany, the entire Bund yield curve out to 30 years is below zero.
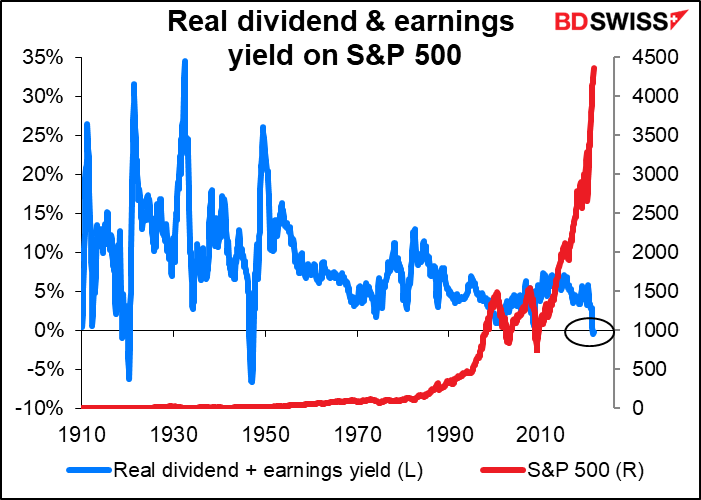
Indeed, negative yield isn’t just in the bond market nowadays: For the first time in 75 years, the combined earnings and dividend yields of S&P 500 companies are negative in real terms.
Greater minds than mine have been struggling recently with the question of why bond yields are so low right now. I’m a strategist by training, not an economist.
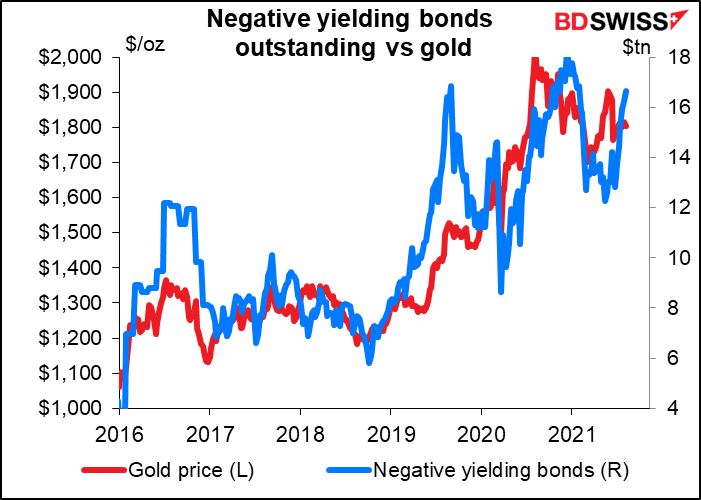
The point for me as a strategist is that with bond and equity yields falling, gold usually becomes more attractive. That’s because there’s an “opportunity cost” to holding gold, which doesn’t pay any interest or dividends but instead costs money to insure or to store. That “cost” becomes less and less as yields on other assets fall and the opportunity to invest money for a positive return elsewhere diminishes.
Reuters Monday reported that more than half of all investment-grade corporate bonds in the Eurozone now trade with sub-zero yields, with the pool growing in July to its biggest on record.
Historically there’s been a pretty good correlation between the amount of negative-yielding bonds and the price of gold. It’s by no means certain, as a glance at the experience of 2016 and 2019 will show, but it has held in general.
Another way to play this possibility might be through the gold/silver ratio. If you think that the pace of the rebound may have peaked in Q2 (which seems likely to me), then the gold/silver ratio may move higher (gold may become more valuable relative to silver). This could be a relative value play rather than an outright purchase.

The recent positioning among speculators in the US futures market – a marked increase in gold contracts vs silver contracts — suggests this possibility as well.

This coming week: US CPI, UK Q2 GDP, JOLTS report
The second week of the month is usually quiet in terms of indicators, and this week is no exception. Plus there are no major central bank meetings scheduled for the week.
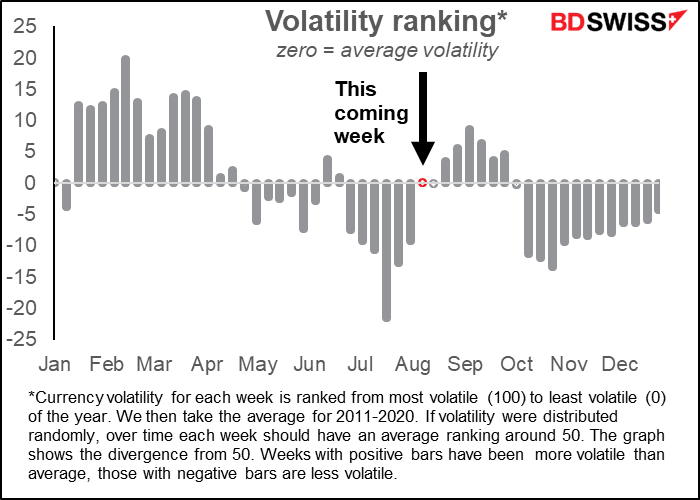
Will the market be volatile? You may think that August is usually the time that the market goes into the doldrums, but it ain’t necessarily so. My research suggests that July is the time when markets are less volatile than usual and August is a bit more volatile – maybe because so many people are on vacation that markets are thinner. This coming week is normally of average volatility.
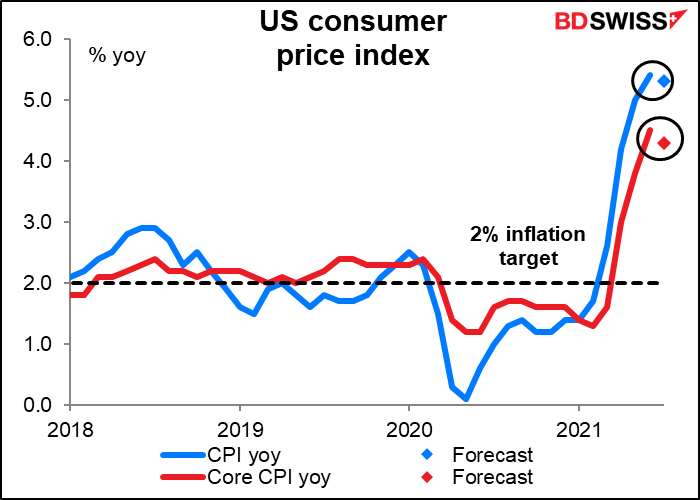
The big indicator of the week is Wednesday’s US consumer price index (CPI). The CPI isn’t the inflation gauge that the Fed targets –that’s the personal consumption expenditure (PCE) deflator, or more accurately, the core PCE deflator – but the market pays attention to it almost as if it were. Surprisingly, the market pays more attention to the headline CPI figure than to the core figure, whereas with the PCE deflator the attention is definitely on the core figure.
The market is looking for the inflation rate to decline slightly in July. Will this confirm the Fed’s narrative that higher inflation is only “transitory”?
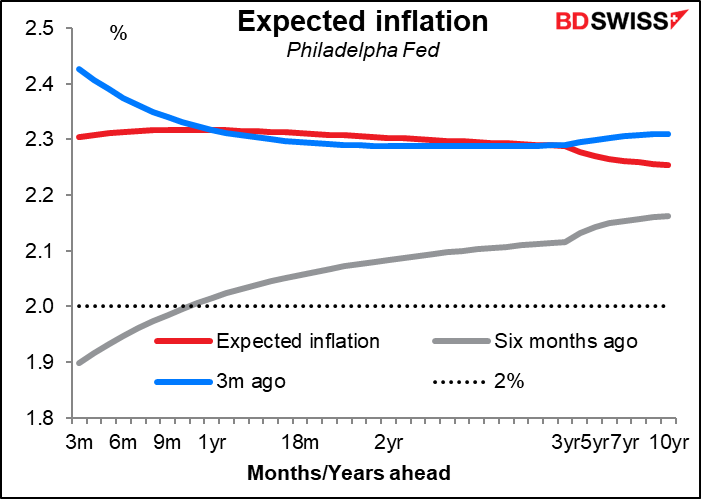
It seems that the Fed is winning the battle for the hearts & minds of the market. Market-based expectations of US inflation have been coming down recently.

The Philadelphia Fed produces a term structure of inflation expectations – estimates for what the market expects inflation to be each month for the next 10 years, based on a variety of surveys of economists. What it shows is that a) economists do not expect the current high inflation rates to last, although b) they do expect long-term inflation to be higher than they did just six months ago. However they do not expect inflation in the next six months to be as high as they did just three months ago. In other words, they are beginning to come around to the idea that this high inflation rate is “transitory.”
Similarly, the Cleveland Fed calculates an expected average inflation rate for the next umpteen years using both survey and market data (so for example the 10-year figure for the red line is what the market expects inflation to average over the next 10 years). Using their numbers, we can extract a forward-forward rate – the expected one-year inflation rate between each data point. What this tells us is that the market expects it’ll be some 14 years before we get back to 2% inflation.

The US will also announce its producer price index (PPI) on Friday. That too is expected to start coming down, a sign perhaps that upstream inflationary pressures are starting to wane – although the relationship between the PPI and the CPI isn’t that simple. If by any chance you are interested in what this relationship is, I’ve got a piece explaining the connection between the two on our website.

By the way, China also releases its inflation data on Monday. They too are expecting inflation to have peaked at both the retail and wholesale levels. Is this a global trend?

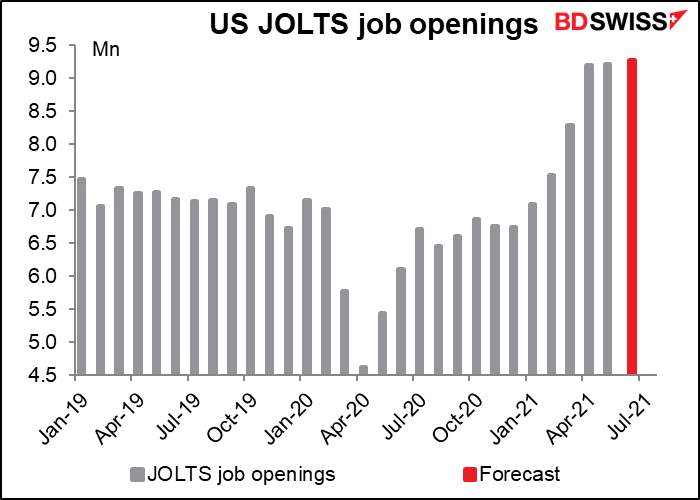
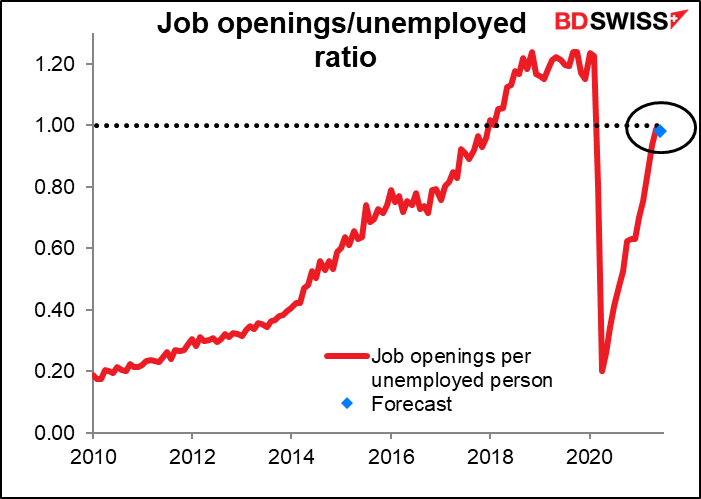
The only other major US indicator is Monday’s Job Offers and Labor Turnover Survey (JOLTS) report. The number of job openings is expected to climb further into record territory (data back to Dec 2000).
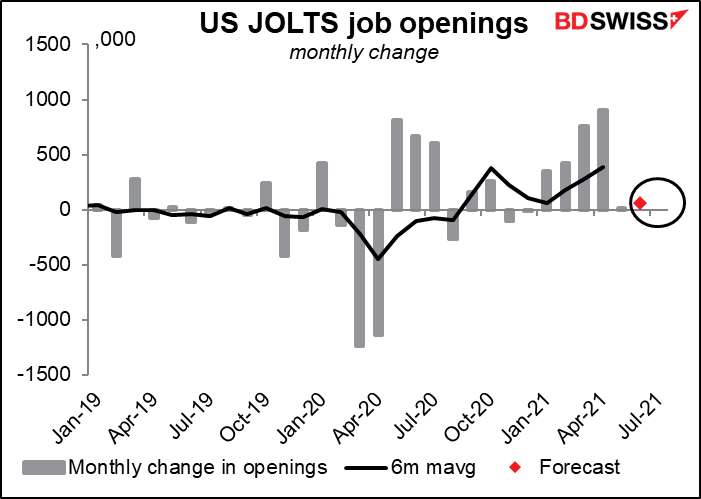
However the pace of increase has slowed dramatically. It collapsed last month and is expected to be relatively slow again this month.
Several Fed officials have pointed to the large number of job openings relative to the number of unemployed as a sign that the labor market is tighter than it seems – there’s now almost one open job for every unemployed person (although not for every person claiming unemployment insurance, which is a different matter. The difference arises because self-employed persons aren’t counted as unemployed since they’re never looking for work, but under current conditions they can collect unemployment insurance). That ratio may be the main use of this figure, which is now closely watched.
The other big statistical event of the week is Friday’s short-term indicator day for the UK, when they announce GDP, industrial & manufacturing production, and trade. The feature this week will be Q2 GDP. The market’s 4.8% forecast is similar to the Bank of England’s expectations of a 5.0% qoq rise and so wouldn’t cause any change in BoE sentiment. Thus the figure should have little impact on the currency if it comes in as expected.

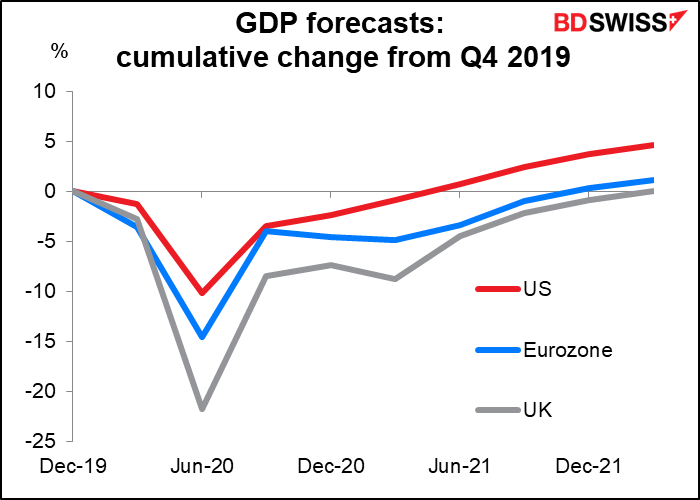
At this pace, and assuming the further out market forecasts, Britain will recover to pre-pandemic levels of output in Q1 next year, vs Q4 this year for the Eurozone and Q2 (i.e., already) for the US.