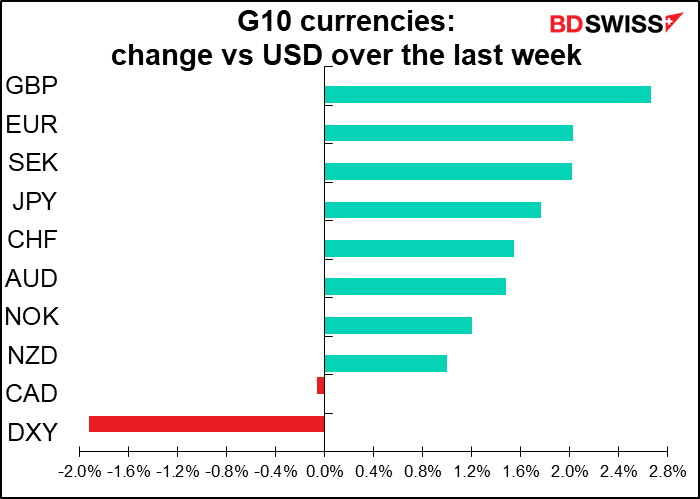
As gold breaks through the $2,000 level and hits a record high, many traders are asking: has gold gone too far?
The answer is that of course the market is always right. Gold is worth what someone is willing to pay for it.
Nonetheless, when we look at other assets, it’s clear that people are paying more for gold now than they are for many other things. The following table shows the price of gold compared to other commodities and to stocks. Gold is expensive relative to its historical relations with them all except for stocks, particularly the S&P 500. However many people are wondering if the stock market is a bubble too, so that may not be much comfort to anyone.

On the other hand, some indicators say it isn’t so expensive.
The gold/silver ratio is a little low but not that far out of line with AUD/JPY, another “fear-or-greed” indicator.

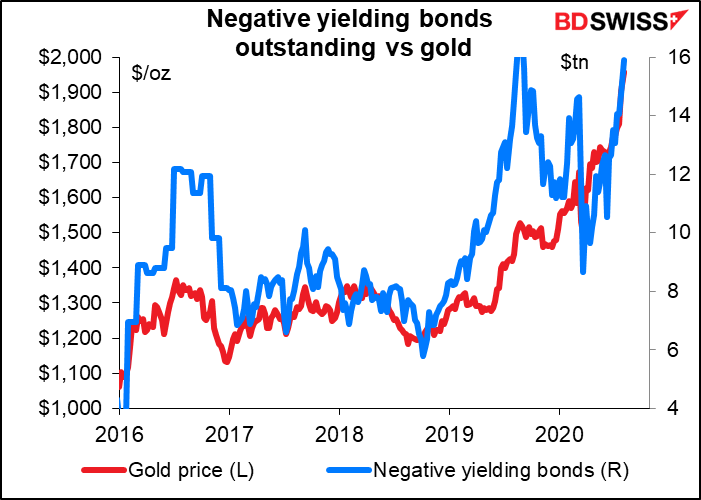
Gold is almost exactly where it should be in relation to the amount of negative-yielding bonds outstanding, a relationship that’s held up fairly well in recent years.
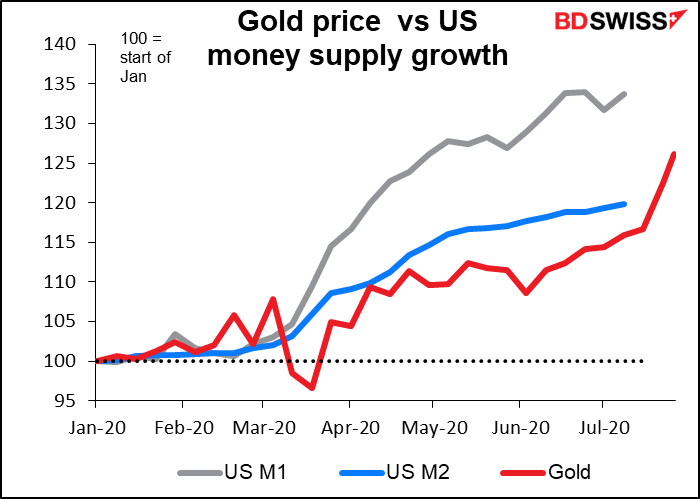
The tremendous rally this year is just keeping pace with the increase in the US money supply so far.
The rally has gone far relative to the decline in the dollar, but the direction is certainly consistent with past moves.

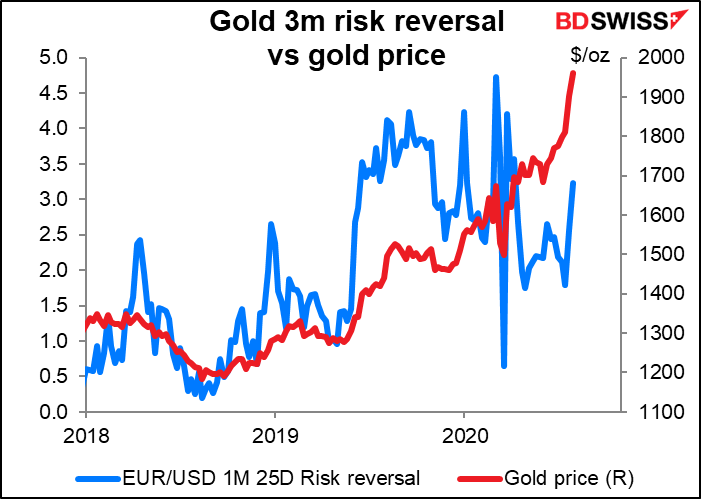
And the risk reversal is still positive, meaning that people are still more worried about missing out on the rally than they are about protecting themselves from any possible loss.
One thing that does worry me though: this is not only the highest gold has ever been in dollars, but it’s also the highest it’s ever been in EUR, CNY and INR. With jewelry accounting for around 42% of total demand for gold, I wonder in particular whether the brides of India will have the money to keep buying at these levels.

So is gold expensive, cheap, or fairly valued? The answer seems to be “yes, no and maybe.” On some metrics it’s expensive, on some it’s fairly valued. It’s hard to find any that it’s cheap on, however. I would say this is more of a trading market than an investing market right now.
Coming attractions: RBA, BoE, NFP
There are two major central bank meetings next week along with the closely watched US nonfarm payrolls.
The Reserve Bank of Australia (RBA) stood pat at its last meeting on 2 June and I see no reason why they should make any changes at this meeting.
Admittedly, they are not hitting their inflation target by any stretch of the imagination. On the contrary, the -1.9% qoq fall in the headline CPI in Q2 was the largest decline in the 72 years of that data series. However, that was mostly due to the government instituting a free childcare policy – it’s hard to beat “free” on price. That policy ended on 12 July and so will wash out in the Q3 data. The RBA will have to wait until the Q4 CPI data are available (28 Jan 2021?) before it has a good handle on how prices are moving.

According to the Goldman Sachs Current Activity Indicator, Australia is recovering, although at a slower pace than developed markets in general. Still, there’s no crisis that would require further stimulus (yet).

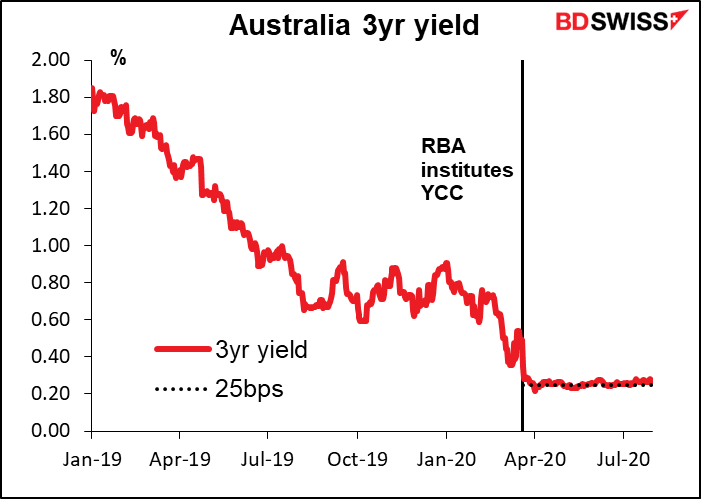
The RBA’s Yield Curve Control (YCC) program is working nicely. Since the policy was instituted on 19 March, three-year Australian government bond yields have ranged between 0.22% and 0.29% on a closing basis – well within their target of “around 0.25%”.
All in all, I expect the last paragraph of the press release – the one containing the forward guidance – to be unchanged for the third month in a row. And when the minutes become available on 18 August, I wouldn’t be surprised to see comments similar to those in the minutes of the July meeting, such as “ Members agreed that the Bank’s policy package was continuing to work broadly as expected” and “members agreed that there was no need to adjust the package of measures in Australia in the current environment. Members agreed, however, to continue to assess the evolving situation in Australia and did not rule out adjusting the current package if circumstances warranted.” That was their view in July and is likely to be their view in August, too.
Friday’s Statement on Monetary Policy, with its updated forecasts, will probably be the more interesting and market-moving event.
Bank of England: the one to watch
The Bank of England is the only central bank that I track where there are substantial divisions about what to do. On one side are arrayed the hawks on the Monetary Policy Committee (MPC): Chief Economist Haldane, he of the “V-shaped recovery,” and Gov. Bailey, he of the “need to keep the balance sheet contained.” Against them stand the dovish external members, Tenreyro and Haskel, who warn about the weak inflation outlook, plus Saunders, who would “err on the side of easing somewhat too much.” Between them sit the internal members – Broadbent, Cunliffe and Ramsden, plus external member Vilieghe, whose views are less clear but seem tilted toward the dovish side.
The market wants to know which way they will go. In particular, the focus is on the possibility of negative interest rates. Haldane said back in May that the BoE was “in the review phase” of looking at negative interest rates. Deputy Gov. Cunliffe pointed to the operational considerations such as, can banks’ computer systems handle negative numbers? (The Reserve Bank of New Zealand also expressed similar concerns.) Haldane said that the review wouldn’t be finished until “well into 2H20,” which presumably means not at the August meeting, but we may get some hints as to which way the thinking is going.
If they decide that negative rates are indeed possible in the UK and would be effective, it would make sense for them to signal that decision as early as possible to give banks time to make any necessary adjustments. Thus the August Monetary Policy Report (MPR, which will come out at the same time as the MPC’s decision is announced, could be a suitable way to make the announcement. Or they could drop a hint at the Fed’s virtual “Jackson Hole” meeting in August – ECB President Draghi did just that in 2014 – and make a formal announcement at the September meeting.
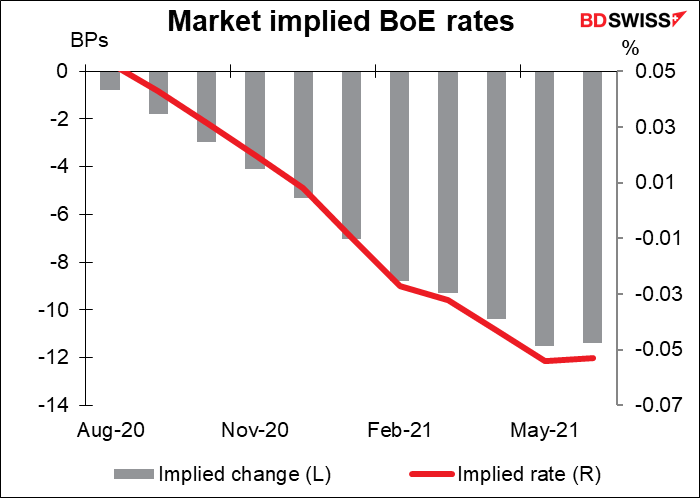
The market is currently pricing in modestly negative rates (-0.05%) by June 2021. That’s probably more like a 50-50 chance of -0.10% by then.
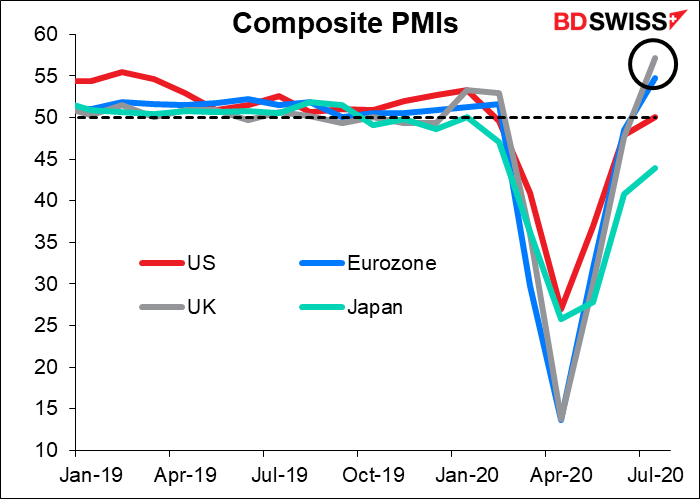
Pros and cons: There are both pros and cons for the UK economy. On the pro side is a shallower-than-expected downturn and faster-than-expected upturn. In its “illustrative scenario” in the May MPR, the BoE posited a 14% yoy decline in GDP in 2020, followed by a 15% yoy rebound in 2021. The market however is now going for “only” an 8.9% yoy decline this year, followed by +6.0% next. Meanwhile, Britain’s composite purchasing managers’ index (PMI) has rebounded farther than the other major industrial countries’.
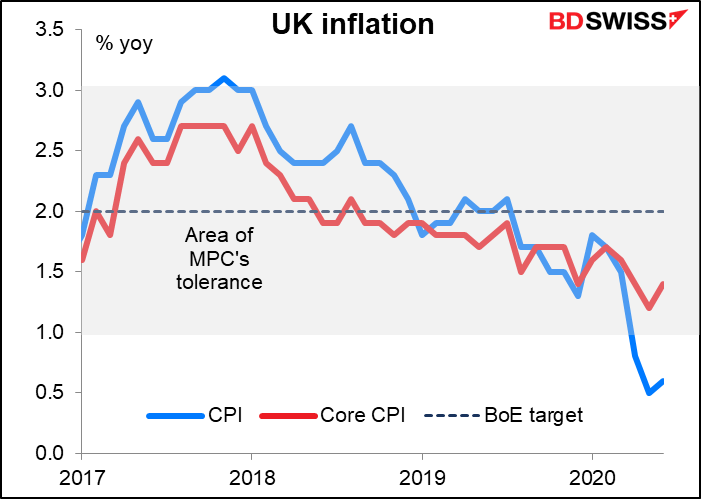
On the con side, as mentioned above, is inflation, which is far below target.
Furthermore, with the government starting to taper down its furlough scheme ahead of ending it in the autumn, the labor market is bound to deteriorate. And then there is one of the world’s biggest “known unknowns”: Brexit, which could hit the fan later this year. So even if some members are currently optimistic about the recovery, they may want to prepare an additional tool just in case it proves necessary.
What might we see from the MPC? The most dramatic result would be a formal announcement that negative rates are indeed suitable for the UK and is starting operational preparations to enable the Bank to institute them if necessary. That would be quite a significant – and GBP-negative – move, in my view. Every other currency that’s had negative rates – Eurozone, Japan, Switzerland and Sweden – had current account surpluses, meaning they were capital exporters. Britain has a large current account deficit, meaning it has to attract capital from abroad. It already has the lowest real yields of any major economy. How it’s going to keep attracting money with negative nominal rates, especially if the economy is in a tailspin from a no-deal Brexit, is something the markets may have to come to grips with.

Failing an explicit yes-or-no announcement, the MPC could say when it expects to finish the review. A statement saying for example that rate cuts are part of its tool kit and the review will be completed by November would probably be seen as a strong hint that they are leaning towards lowering the “effective lower bound” of rates to below zero. That would probably be a sufficient hint for the market to get the idea.
Failing that, they could hint at more gilt purchases, either now or later on.
They could announce some tweaks to the Term Funding Scheme with additional incentives for Small- and Medium-Sized Enteprrises (fondly known as TFSME). The TFSME provides banks with four-year funding at rates very close to Bank Rate for lending onto businesses and households. As the name suggests, it has some special incentives to encourage lending to SMEs. EG they could lower the Bank rate to zero and provide a negative rate on the TFSME.
They could make more specific forward guidance. In June they said that the MPC “stands ready to take further action as necessary” and that they “will keep the asset purchase programme under review.” They could be more specific about what would make a move necessary, e.g. a rise in the unemployment rate or a no-deal Brexit.
Finally, there’s the matter of the forecast. In the May MPR, the BoE had only an “illustrative” scenario,” because really, who could make any believable forecasts back in May? Now however they may go back to their previous format of quarterly profiles and the good ol’ GDP and inflation fan charts. They could even revise up the 2020 GDP forecast, from an appalling -14% yoy to a disastrous -10% yoy contraction. (The Bloomberg consensus forecast is -8.9% yoy.) Of particular interest will be when they see output recovering to pre-virus levels – something the market doesn’t forsee happening before 2022.
In short, there are a number of ways that the Bank of England could either ease further or, more likely, hint at future easing. I think that would tend to be negative for the pound. On the other hand, if they refrain from any such hints and simply stick with a 9-0 vote to remain unchanged, particularly if coupled with an upbeat statement that emphasized the better-than-expected (or, more accurately, not-as-bad-as-expeected) Q2 result and continued rebound in the economy, then GBP/USD could continue on its merry way above $1.30.
Nonfarm payrolls: does it matter?
The US nonfarm payrolls has been the #1 indicator on everyone’s watch list. For example, it has a Bloomberg score of 99.21, meaning presumably that 99.21% of all the people who put alerts in for US economic indicators have an alert set for that one. This is even higher than the 97.64 for the FOMC rate decision. However, the initial jobless claims, which come out every week, are now a close second: they have a score of 98.43. (Continuing claims are 68.90.) It’s questionable how much value the monthly figures add to the picture when everyone is watching the weekly data. Especially now, when the situation is changing so quickly and even the Bureau of Labor Statistics, which compiles the data, has said that millions of people are being miscategorized.
But traders aren’t watching the numbers to evaluate the economy, they’re watching them to make money. As long as some people are going to trade on the data, then we have to keep watching them. And the NFP do result in higher-than-average volatility in currencies sometimes, especially when there’s a surprise – which is often the case nowadays, as no one really has a clue what the numbers are likely to be.
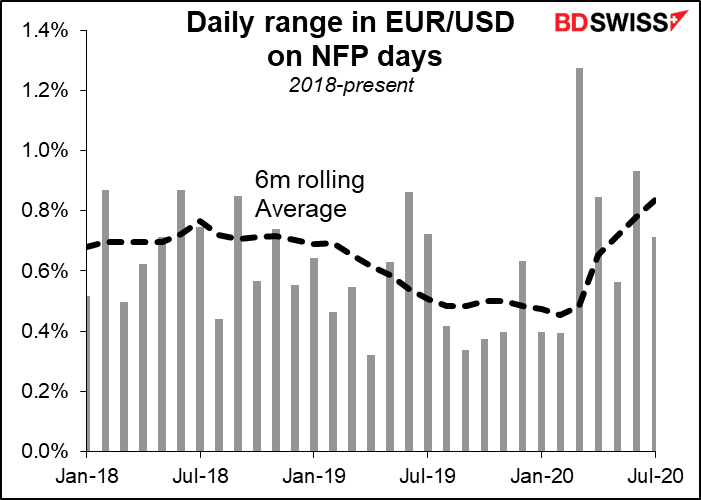
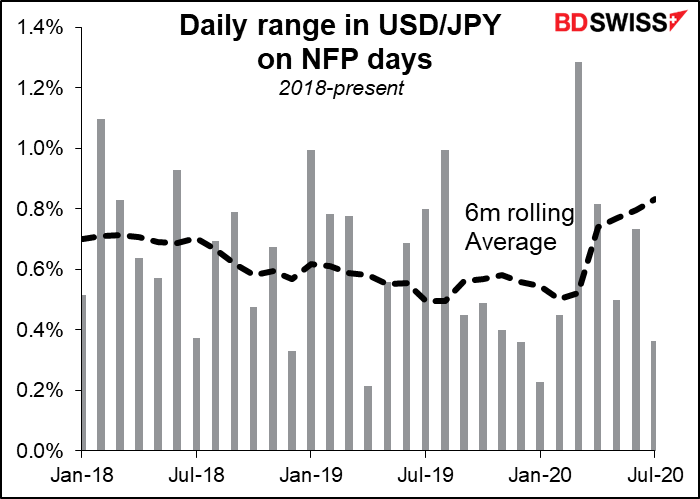
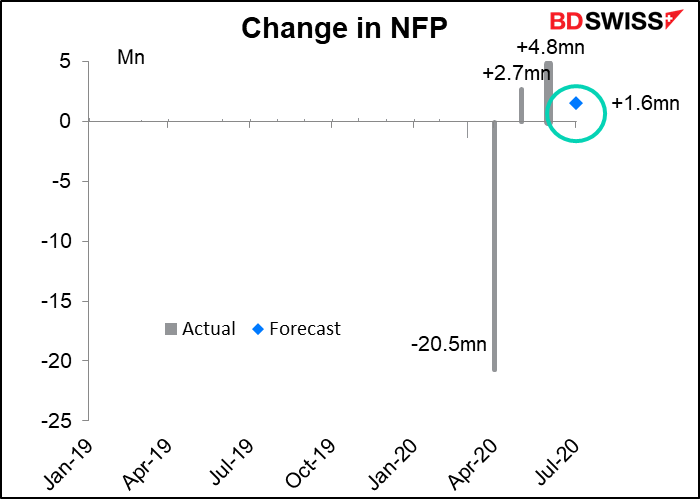
The NFP is expected to show a 1.8mn increase in jobs. That’s a bit worrisome as it would be a distinct slowdown from the previous two months of increases.
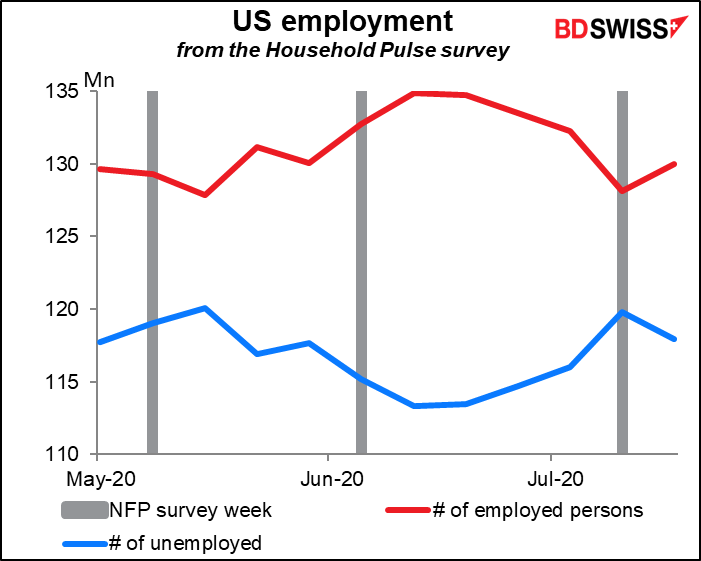
Unfortunately, that would be consistent – even optimistic — with the data from the new Household Pulse Survey, a weekly series from the US Census Bureau designed to quickly and efficiently deploy data collected on how people’s lives have been impacted by the pandemic. This showed employment fell and unemployment rose during the week of the July NFP survey (always the week that includes the 12th of the month).
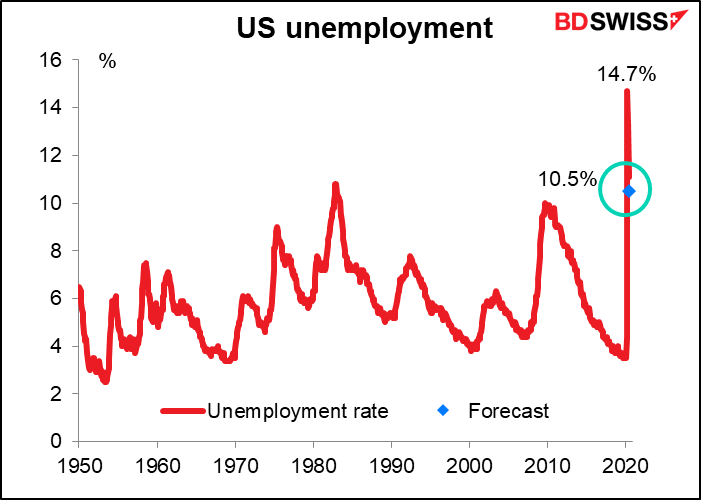
The unemployment rate is expected to fall back to 10.5%, a considerable improvement from April’s record-high 14.7%. Mazel tov! This is just slightly below the previous peak of 10.8 set in 1982, a year after then-Fed Chair Paul Volcker ratcheted the Fed funds rate up to 20% to tame runaway inflation
Meanwhile, the jobless claims paint a pretty disappointing picture too. Although there was only a small (+12k) increase in initial jobless claims, that does make two weeks in a row of increases. Not what we want to see after 20 weeks!
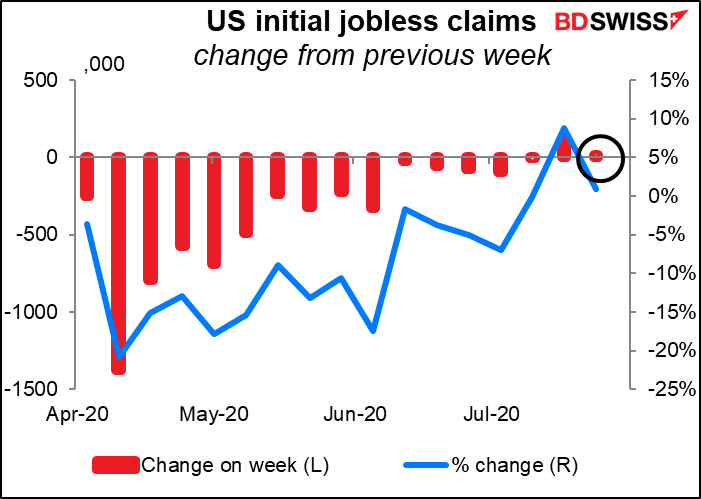
To make matters worse, continuing claims showed a rather high 867k increase. This was the first rise in continuing claims in eight weeks and shows that people are moving onto the unemployment rolls faster than they are moving off – not a good sign.

By the way, these are only part of the people who are receiving unemployment benefits in the US. All told 30.2mn people are receiving some sort of benefits — that’s 19% of the 158.7mn people who were in the labor force at the beginning of the year. That’s a more realistic estimate of the unemployment rate, I’d guess, than the official figure.

I would be wary of a negative surprise with the NFP that could send the dollar lower thanks to the “growth divergence” theme in the market. Even if the figure comes in as expected, the slowdown in payroll growth is a warning of the slowdown in the US recovery.
Other indicators
Outside of that, there’s not much on the schedule.
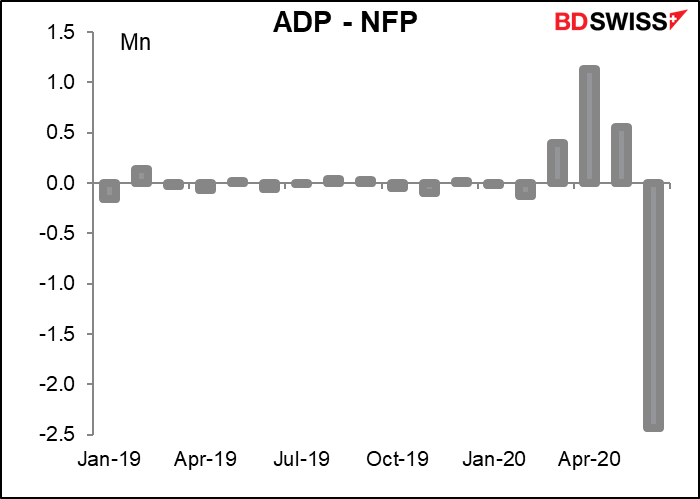
Of course Wednesday we get the ADP Report, which will be watched for a hint about Friday’s NFP, even though the two have little in common nowadays – the differences have ranged from +1.1mn (Apr) to -2.4mn (Jun).
The final purchasing managers indices (PMIs) for the major economies come out during the week, as do the PMIs for all those countries that haven’t announced yet. In the US, the Institute of Supply Management (ISM) releases its versions of the PMIs, which are still widely watched even if their methodology is somewhat dubious when compared to the Markit version.
Japan announces the Tokyo consumer price index (CPI) on Tuesday morning their time. Please wake me when there’s something interesting to see in it.
German industrial production on Friday is the biggest Eurozone indicator of the week.
Along with the US employment data comes the Canadian employment data, as usual.
