Rates as of 04:00 GMT
Market Recap
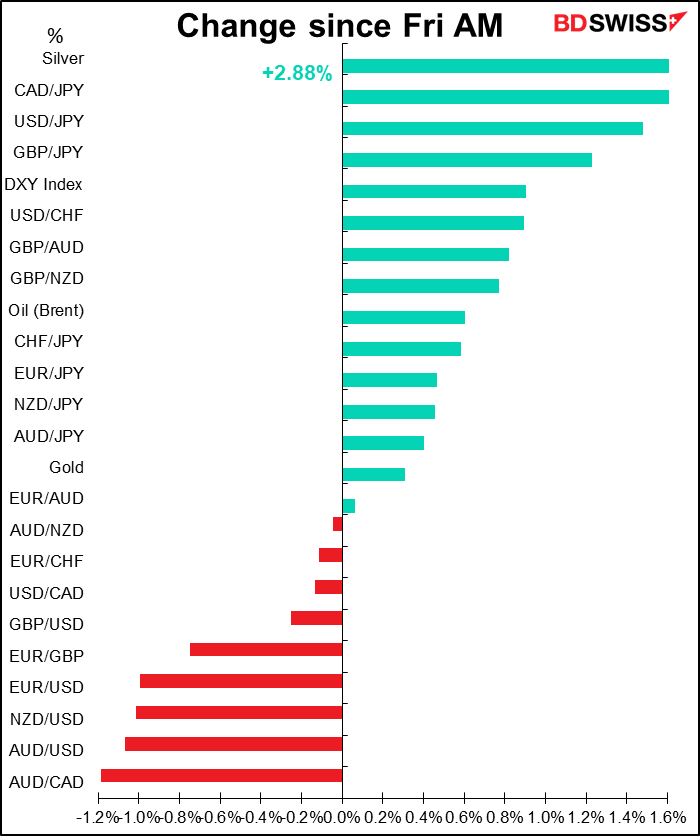
Increasing tensions with China over TikTok, a rising virus count, downward revision in long-term credit outlook (from “stable” to “negative” by Fitch), total failure to reach agreement on renewing unemployment benefits that has left millions in penury… no wonder the dollar is up! In fact it does look as if that’s correct – the dollar seems to have gained on some “risk-off” sentiment, although US stocks managed to end higher (Asian markets are mixed this morning).
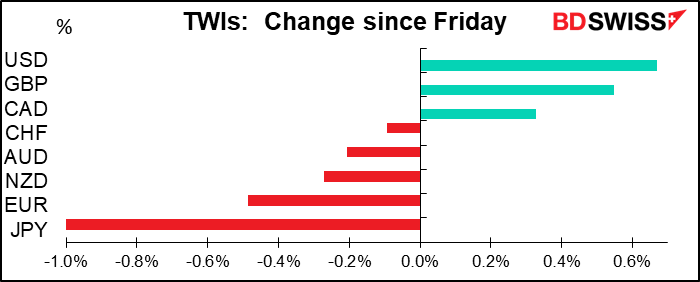
My impression though is that it’s more EUR weakness than USD strength, with EUR weakening on most of the crosses after Friday’s collapse in Eurozone GDP. Plus perhaps some end-month profit-taking on dollar shorts as the US currency finished its worst month since Sep. 2010.
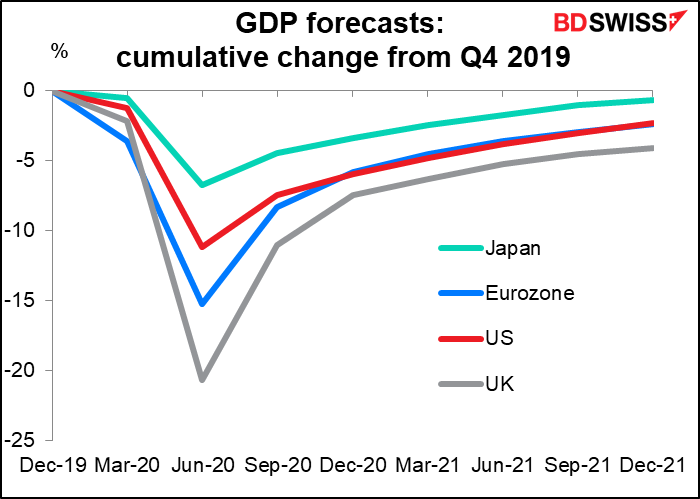
Looking at the market’s growth forecasts, the expected recovery profile for the Eurozone and the US are almost exactly the same. That should imply at least a stable EUR/USD. (Japan and UK Q2 figiures are still market estimates.)
On the other hand, JPY was the worst-performing currency. You may remember that on Wednesday I said, “USD/JPY is now approaching 105, a level that often in the past prompted Japanese politicians to start warning about “disorderly markets” or other nonsense in an attempt to jawbone the rate back up…”
Sure enough, on Friday as USD/JPY was hitting the lows of 104.19, Bloomberg ran a story, “Japan Officials Meet to Show Vigilance as Yen Hits 4-Month High”
(Bloomberg) — Senior officials from Japan’s finance ministry, central bank and financial regulator met Friday in a show of vigilance after the yen gained to the highest level since March.
“The government and the Bank of Japan confirmed we will act together if necessary while we continue to closely watch developments in financial markets and the economy,” the finance ministry’s top currency official, Kenji Okamura, told reporters after the meeting…
Separately, Finance Minister Aso said the strength of the yen doesn’t correlate with trade balance shifts and that he would continue to watch the FX market “with a sense of urgency.”
That’s why USD/JPY rose sharply, back to 105.80 this morning.
As I pointed out last week, the worry about 105 is nonsense because they’re only looking at the nominal USD/JPY rate and not the real effective exchange rate (REER). The REER is much weaker than the nominal rate because (up to now) Japan’s inflation has been so much lower than that of its trading partners that a stable USD/JPY in nominal terms means a depreciating USD/JPY in real terms. In real terms the yen is quite weak right now, far below its average for the last 26 years. The Japanese authorities should take a more sophisticated attitude toward the FX market.

Aso’s comment about “trade balance shifts” is also telling – he apparently hasn’t realized that it’s capital flows, not trade flows, that move currencies nowadays (as has been the case for decades). Japan’s ultra-low interest rates are now no longer the global outlier but rather the norm, or even high relative to Germany, thus reducing the incentive for Japanese investors to move money abroad.
In any event, Japanese market participants don’t appear to be that concerned – almost all of the move came during the European day, implying that it’s foreign investors moving the currency. The big question is whether Japanese investors will start buying USD.
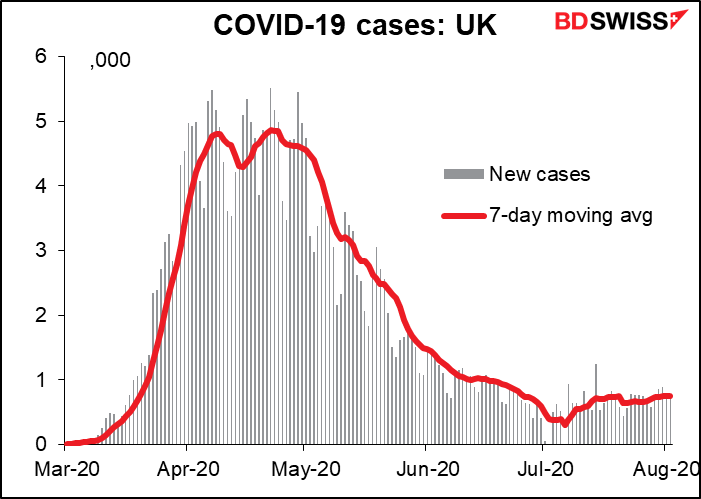
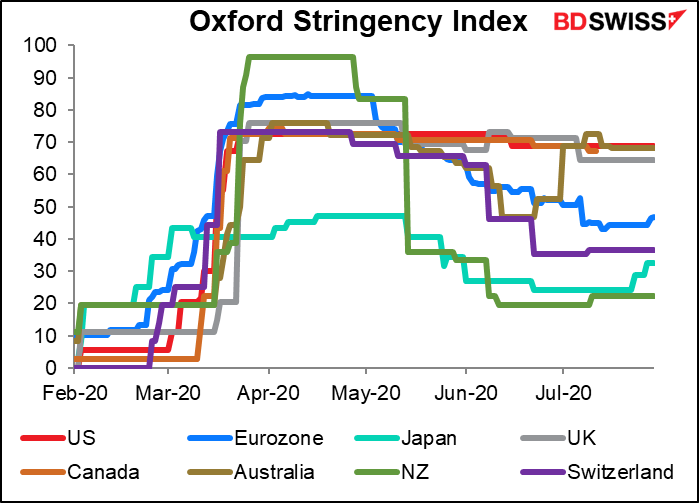
GBP continues to be a mystery to me. It was the second-best-performing currency, rising above 1.31 to hit a post-pandemic high, despite no good news at all for the currency. On the contrary, the UK government said it will reimpose tougher social distancing measures in parts of the country, PM Johnson announced that further easing of restrictions will be delayed due to the increasing number of cases, and the Sunday Times reported the possibility of “sealing off Greater London” in a line reminiscent of the movie “Escape from New York.”
The recent increase in cases doesn’t seem that much worse than anywhere else, but of course the trend is the problem. I applaud the UK government’s quick move to prevent the situation from getting worse, unlike in some countries. Perhaps that’s why GB is up: market approval for early steps to avoid an even worse crisis later.
The UK already has one of the more stringent policies in place for dealing with the virus (grey line). (Note: I don’t’ believe the reading for the US, the red line, because there is no national policy in the US – it varies from state-to-state and even within each state.)
Positioning Monitor
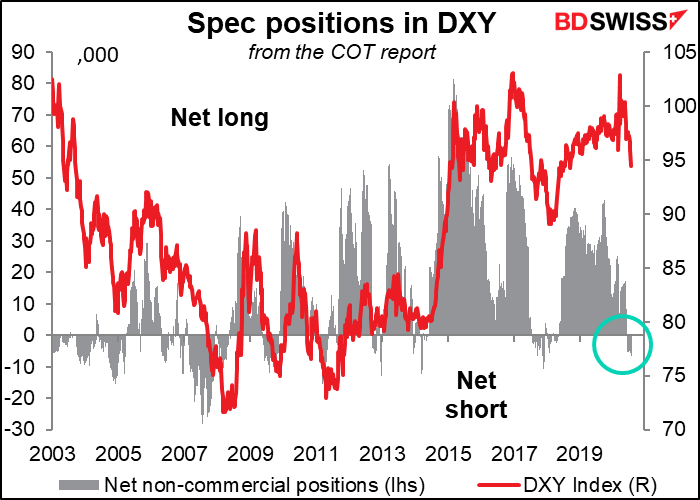
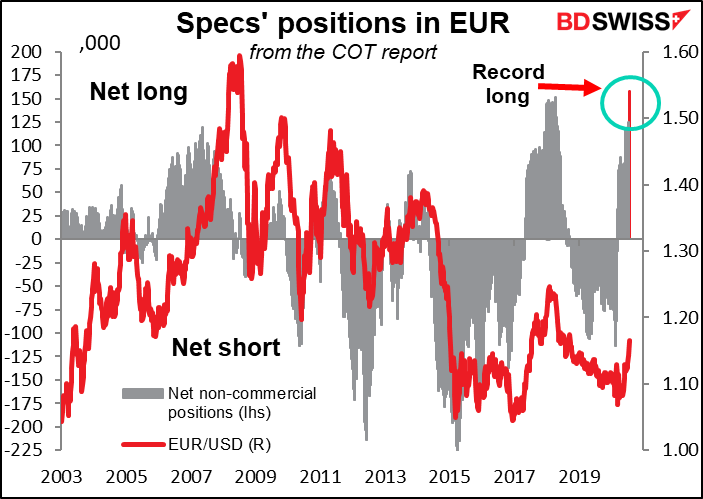
Commitments of Traders report: The flight from the dollar continues. The market’s position in the DXY index (an index of USD vs five major currencies) is almost the lowest it’s been in five years, while the overall position in currencies vs the dollar is similar. Meanwhile, the long EUR position is the highest it’s been in five years.
That positioning should be no obstacle to further USD weakness, however. The fact is, the market simply hasn’t been very short USD in the last five years. There were times it was much shorter than it is today (-6,727 contracts). And times it was much, much, much longer than it ever was short (+81,270 contracts). So I don’t see any obstacle here.
EUR positioning is more problematic – specs high a record high long position last week. Still, the net-long 157.6k contracts is well below the peak net short of -226.6k contracts. We’ll have to see if investors have more confidence in the EUR going up than they did in it going down.
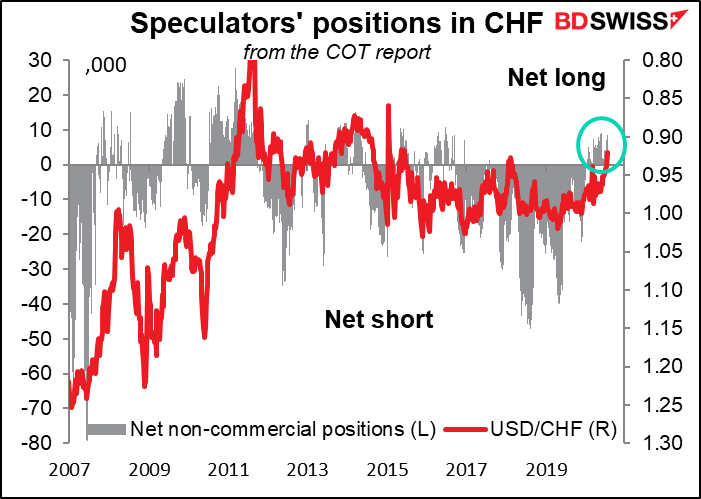
Same story for CHF. People have simply played it from the short side for years.

Citi FX Positioning Alert Indices (“PAIN”): The Citi “PAIN” indices, which estimate the positions of FX fund managers, pose more concerns about the outlook for the dollar. They show the US currency facing two problems: 1) it’s still the biggest long position of fund managers, and 2) it’s the position they’re cutting the fastest.
Otherwise, they seem to show people simply cutting back their exposure overall. The positions that tended to get cut the most were the most extreme ones as managers took risk off the table. EG the most extreme short last week was NZD; that got cut the most. #2 long was JPY; that got cut the 2nd most.
The data shows GBP now their biggest short. Oops! They’re going to have to scramble to catch up to the market. That means more buyers of GBP. (I have to admit, I would’ve done the same thing.)


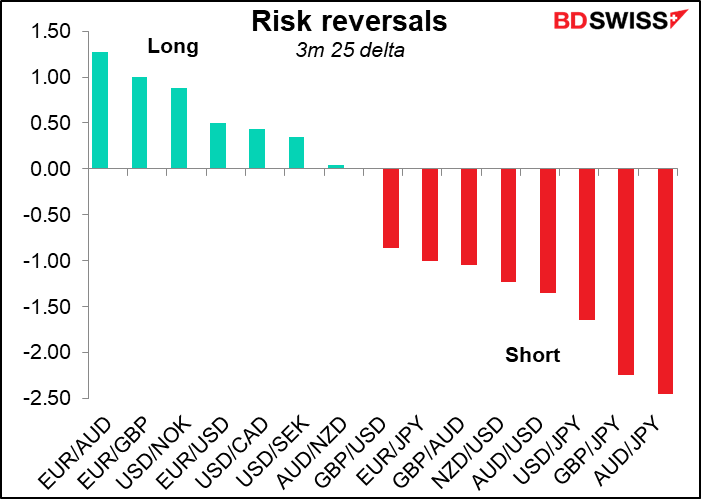
Risk reversals: The data from the risk reversals (RR) corroborates the story that the Citi PAIN indicators tell. NZD/USD was the RR to show the greatest increase, consistent with the PAIN data on people cutting NZD shorts. Same story with USD/JPY.
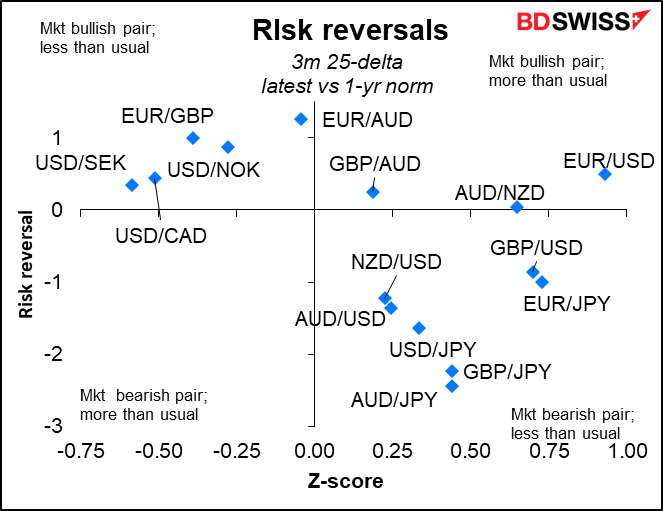
The options market remains really really negative on AUD. The most extreme long pair and short pair are both vs AUD.
The biggest falls were all vs USD, showing that the options market too is bracing for more dollar weakness.
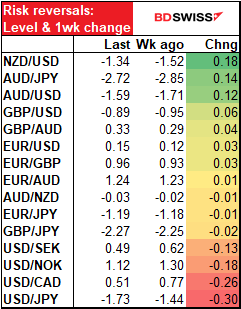
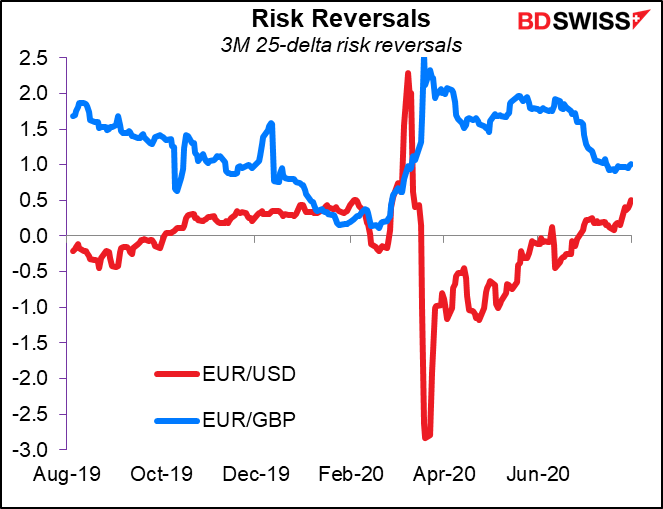
EUR/USD RRs rose further during the week, while EUR/GBP was little changed. In fact, few of the GBP pairs showed much movement on the week even as GBP went soaring. This suggests to me that there may be a lot of people surprised by the pound’s strength who may have to scramble to get on the trend. Either that or they just don’t trust it.
Explanation:
The Commitments of Traders (CoT) report, from the US Commodity Futures Trading Commission, gives us the positions of speculative accounts on the various futures markets in the US. The data is taken on Tuesday and is released on Friday evening in the US.
The Citi FX Positioning Alert Indicators (“FX PAIN”) “infer positioning of active currency traders from relationships between exchange rates and currency managers’ returns. A positive reading suggests that currency traders have been net long the currency and a negative reading suggests that currency traders have been net short the currency.”
The Risk Reversal (RR) is a gauge derived from the FX options market of whether the market thinks there’s a greater chance of a currency pair rising or falling. If the market thinks it’s more likely that the pair will rise, then the RR will be positive; if falling, then negative. The more positive (negative) it is, the greater the chance that the market places on the pair rising (falling).
Aside: Now I understand it
On Friday I was talking about how the virus is spreading in Republican-led states and said, “I also don’t understand what kind of strategy it is to kill your supporters. Trump is the Jim Jones of politics.”
It turns out, the answer to that question had appeared in the magazine Vanity Fair just the previous day. An article, How Jared Kushner’s Secret Testing Plan “Went Poof Into Thin Air” made it clear: because the virus initially hit Democrat-led states hardest, the White House thought a national plan was unnecessary and would not make sense politically. The article quoted a public health expert as saying, “The political folks believed that because it was going to be relegated to Democratic states, that they could blame those governors, and that would be an effective political strategy.”
That’s of course the logic of saying “I don’t have to help bail this leaking boat, because the leak is under your seat, not mine.” It’s now pretty much 50-50 (2.26mn cases in blue states, 2.22mn in red) and the Republicans are growing much much faster. So much winning!

Today’s market
The main event is overnight, when the Reserve Bank of Australia (RBA) meets. I discussed this in detail in my weekly report, Weekly Outlook: Is Gold Expensive? RBA, BoE and NFP . I’ll just sum up what I said there:
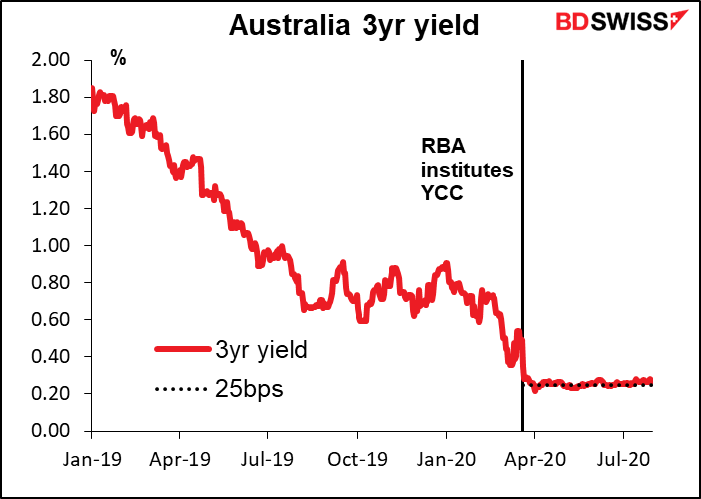
The RBA stood pat at its last meeting on 2 June and I see no reason why they should make any changes at this meeting. Although inflation is far below their target, it’s because the government instituted a free childcare policy, which will wash out in the Q3 data. The RBA will have to wait until the Q4 CPI data are available (28 Jan 2021?) before it has a good handle on how prices are moving. Its Yield Curve Control (YCC) program is working nicely. Since the policy was instituted on 19 March, three-year Australian government bond yields have remained well within their target of “around 0.25%”.
All in all, I expect the last paragraph of the press release – the one containing the forward guidance – to be unchanged for the third month in a row. And when the minutes become available on 18 August, I wouldn’t be surprised to see comments similar to those in the minutes of the July meeting, that there’s “no need” to adjust policy now but that they “did not rule out adjusting the current package if circumstances warranted.” Friday’s Statement on Monetary Policy, with its updated forecasts, will probably be the more interesting and market-moving event.
Today’s indicators
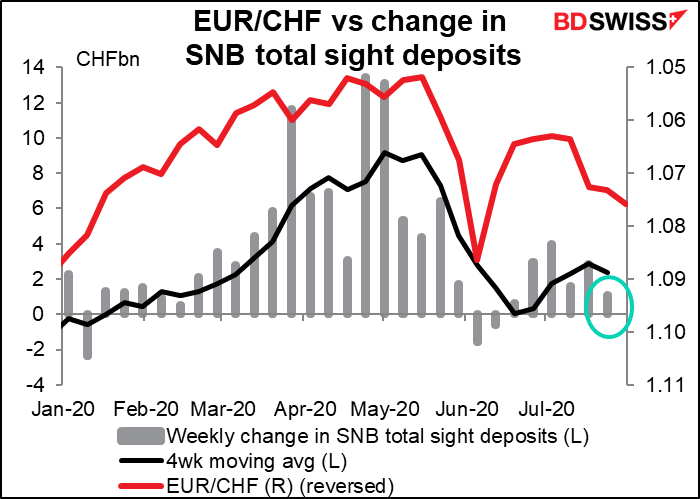
The Swiss National Bank (SNB) seems to be intervening less as EUR/CHF rises thanks to the stronger euro. However it’s still intervening, which is the salient point. Despite the stronger euro and the threat of being named as a “currency manipulator,” it keeps on intervening. USD/CHF has been one of the biggest movers recently – let’s see if they start intervening there, too.
The Institute of Supply Management (ISM) releases its version of the manufacturing purchasing managers’ index (PMI). It’s as closely watched than the Market equivalent, maybe even a little more; its Bloomberg score is 95.3 vs 90.0 for the Markit manufacturing PMI.
The ISM index was higher than the Markit index before the virus hit, it didn’t fall as far, and it’s recovered faster. No surprise that it’s expected to be a bit higher than the Markit index again this month.
The reason may be that the ISM index covers the global operations of companies, whereas Markit confines its questions to the domestic US operations. Given that some other countries are recovering faster than the US, plus the weakening dollar means higher overseas profits translated back into USD, it’s reasonable that the ISM version would be rising faster than the Markit index.

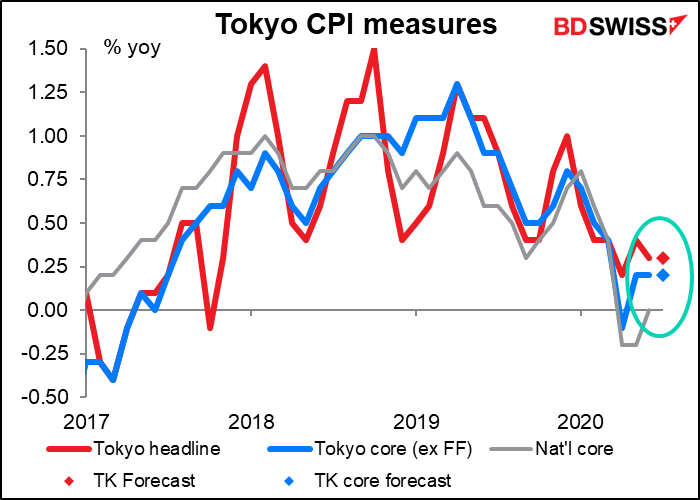
Then…that’s about it! We wait until overnight when we get the Tokyo consumer price index (CPI), which is a bit more closely watched than the national CPI as it comes out two weeks earlier and the two track pretty well. Core CPI (ex-fresh foods) is expected to be unchanged at +0.2% yoy for the third month in a row. FYI the word for “boring” in Japanese is taikutsu.
Then we have Australia trade and retail sales. Even with the RBA meeting a few hours later they can still move the market in theory – they have in the past. However that’s unlikely now as the Australia Bureau of Statistics is temporarily releasing preliminary versions of both of these statistics to provide more timely data during the pandemic.
The trade surplus is expected to be a bit higher as exports are forecast to have risen 4% mom while imports are estimated at +3% mom. The preliminary estimates were for an 8% mom rise in exports and a 6% rise in imports, so maybe everyone just cut that in half for some reason.

Retail sales are expected to be up 2.4% from last month’s already-good level. They’re higher than they were before the pandemic. It looks like pent-up demand set loose. The figure should come as no surprise to anyone though as the Australian Bureau of Statistics is now issuing a preliminary estimate of retail sales, and guess what – that was up 2.4% mom.