Rates as of 05:00 GMT
Market Recap
The minutes to the July 27th meeting of the rate-setting Federal Open Market Committee (FOMC) were pretty evenly balanced.
On the one hand, the Committee members expected that the actions they’ve taken so far (and would continue to take) will slow the economy and allow them to pause their tightening. Particularly in the housing sector, “many participants” noted the “emerging response of aggregate demand to the tightening of financial conditions associated with the ongoing firming of monetary policy.” “Many participants” expected growth in economic activity would be at a “below-trend pace in the second half of this year” as the response of aggregate demand to tighter financial conditions becomes “stronger and more broad-based.” Accordingly, participants judged “it likely would become appropriate at some point to slow the pace of policy rate increases” to assess the effects on the economy and inflation.
On the other hand, the Committee still judged that inflation remains “unacceptably high” and inflationary pressures are broad-based. As several members noted after the July meeting, “some participants” indicated that “once the policy rate had reached a sufficiently restrictive level, it likely would be appropriate to maintain that level for some time.”
This is contrary to the market’s assumption that the Fed will quickly begin loosening after rates peak. According to the futures market, fed funds will peak in April and a rate cut will come by September, only five months later. This is not unprecedented but it only happened when inflation was near the Fed’s 2% target level.

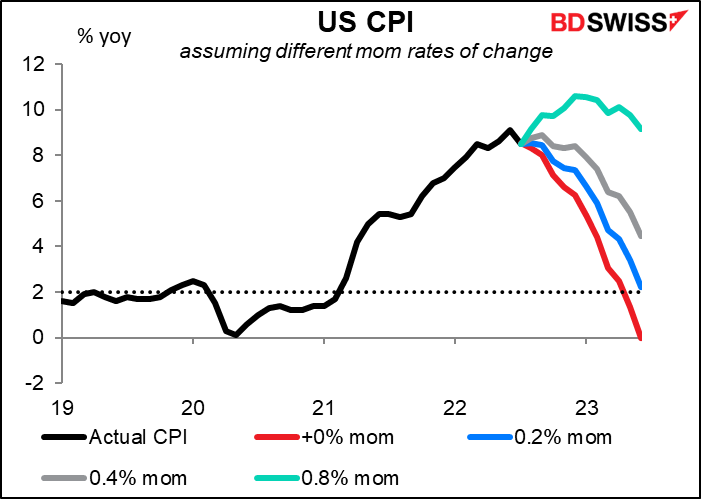
Is inflation going to be back down to that rate by next April? Only if there is zero inflation between then and now, in which case inflation would be 2.5% yoy next April and 1.4% next May. If inflation falls to +0.2% mom, it could achieve that rate by June. However if inflation averages 0.4% mom then it will never hit that – it will bottom out at 4.9% yoy. And if inflation should keep up at the recent average of 0.8% mom (which is both the average for the last three months and the last six months) then it will eventually rise to 10% yoy.
It’s important to bear in mind that the minutes of the meeting are not just a record of what participants said at the time, but also a communication tool that the Fed uses to steer the market’s perception of their actions. They observe how the market reacted to the statement and press conference following the meeting and then tweak the minutes to correct any misunderstandings.
Given upside risks to inflation, policymakers noted that moving to a “restrictive stance” in the “near-term” would be “appropriate from a risk-management perspective because it would better position the Committee to raise the policy rate further, to appropriately restrictive levels, if inflation were to run higher than expected.”
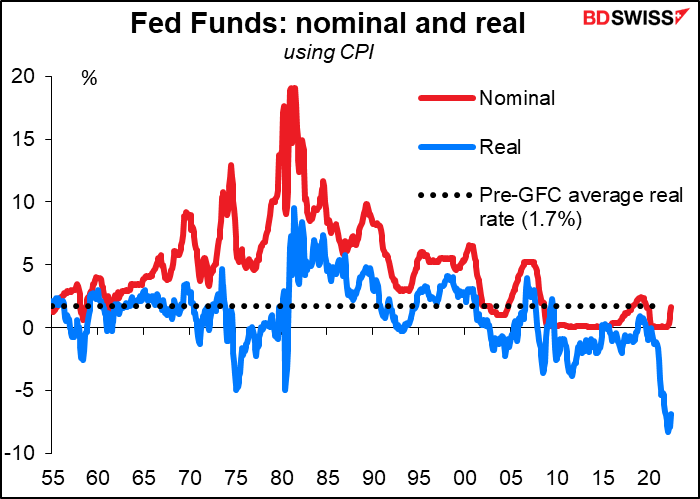
They also discussed the neutral level of rates. As Fed Chair Powell noted during his press conference, “participants observed that, following this meeting’s policy rate hike, the nominal federal funds rate would be within the range of their estimates of its longer-run neutral level.” However, “some participants” argued that the real federal funds rate is likely still below shorter-run neutral levels even after the hike at the July meeting.
Note that the real fed funds rate is currently -6.8% yoy, which is way below the historical average of +1.7%. To achieve that level the fed funds rate would have to be 10.2%.
The problem with the Fed’s analysis is that financial conditions aren’t that much tighter. On the contrary, they’ve been getting looser recently as the market cancels out much of the impact of the Fed’s tightening measures. Measured by the Chicago Fed’s financial conditions indices, conditions are still “looser than average” even after 225 bps of tightening and the beginning of “quantitative tightening” in which the Fed shrinks its balance sheet (although so far it’s only shrunk the balance sheet by $86.3bn or about 1%).
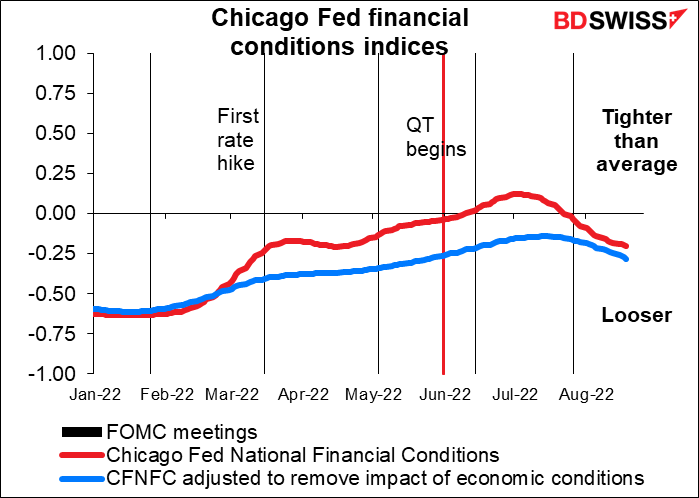
I think this chart explains a good deal of why stock markets can continue to rally even as the Fed is supposedly tightening policy. It also suggests to me that the Fed has much further to go and the market is likely to be disappointed.
The markets interpreted the minutes as being hawkish. Fed rate expectations rose across the curve.
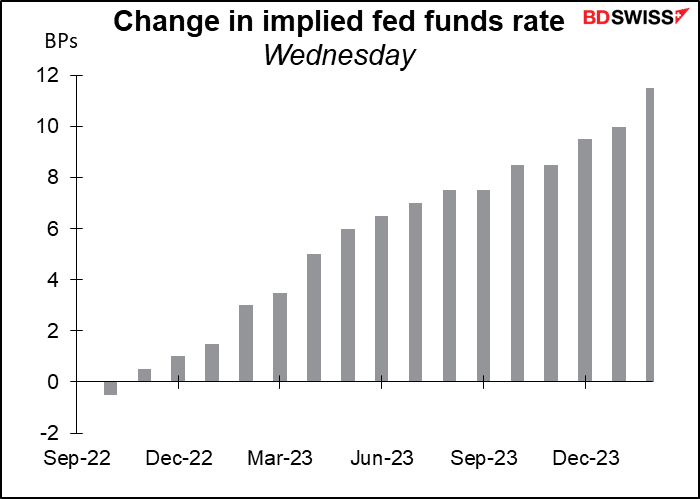
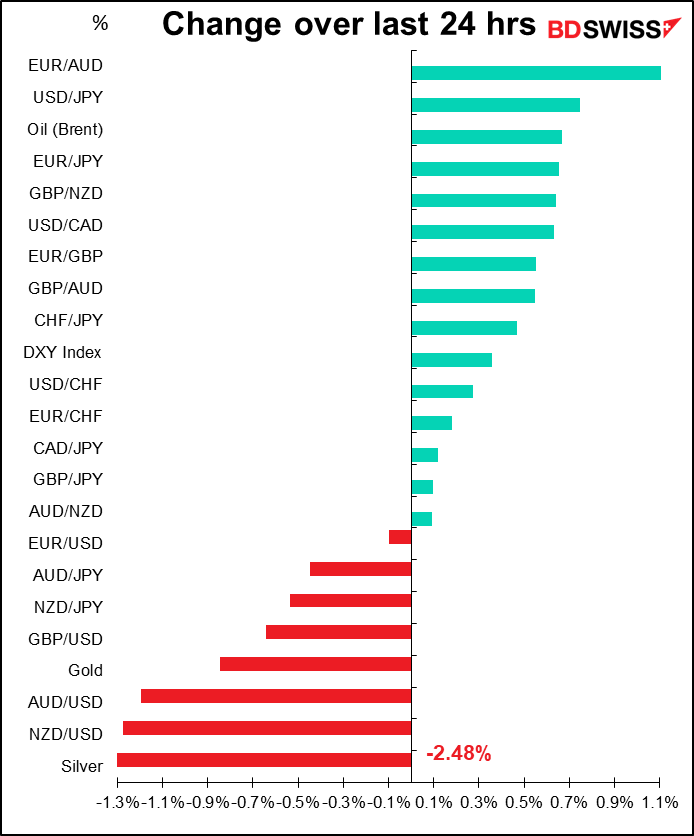
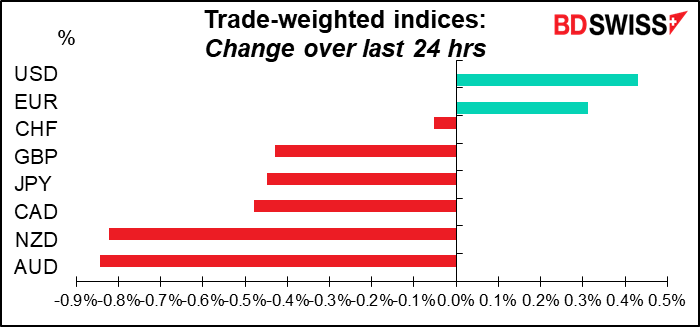
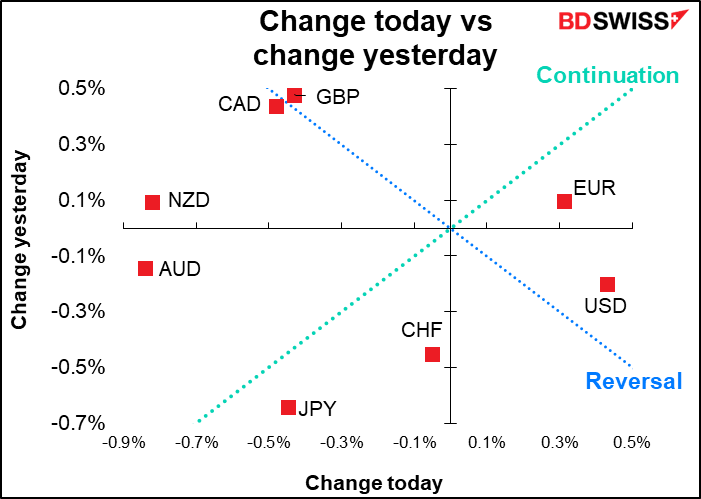
As for the markets…it was generally a “risk-off” day with stock markets declining, oil prices falling, and the commodity currencies underperforming. USD did well in this environment thanks to the higher rate expectations.
The key here was the higher-than-expected UK consumer price index. The surge to 10.1% yoy from 9.4% (9.8% expected) when other countries, such as the US and Canada, are seeing their headline inflation rates falling suggests that perhaps global inflation is going to be stickier than people had thought.
As a result, inflation expectations rose, not surprisingly led by Britain.
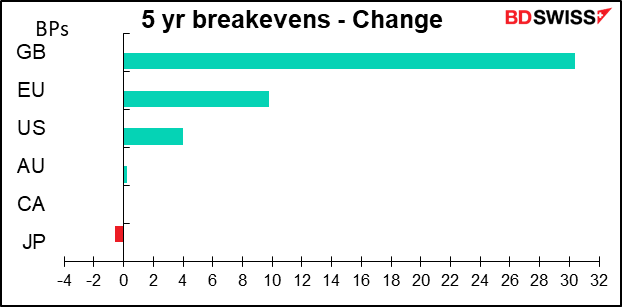
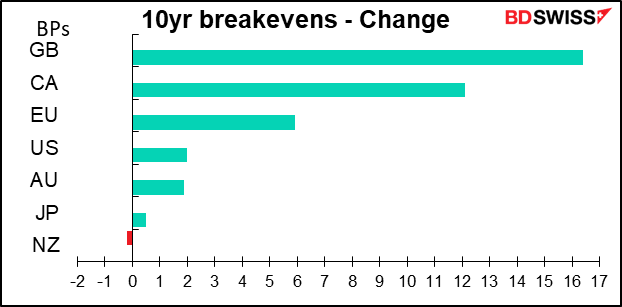
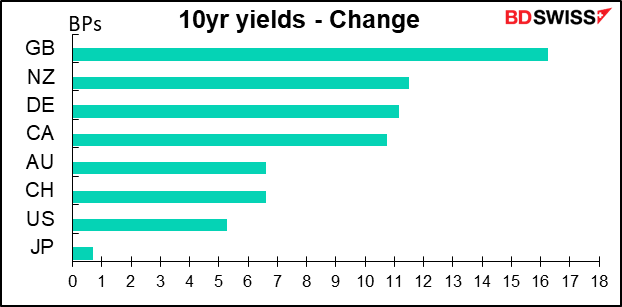
This naturally put the fear of God into bond markets globally, with Britain again leading the sell-off.

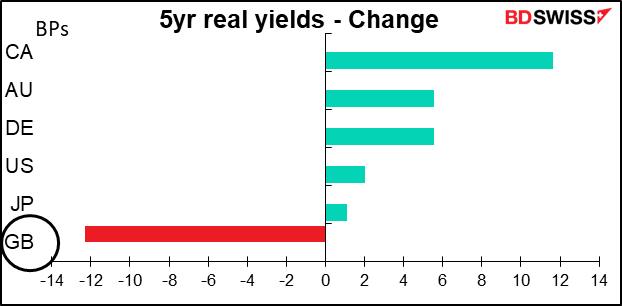
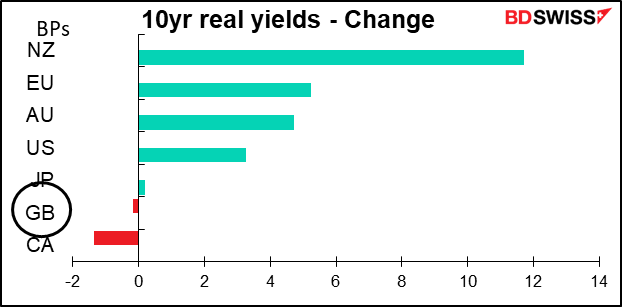
Despite the surge in UK rates, inflation expectations moved even higher, so that real UK rates actually fell at the five-year sector and were unchanged at the 10-year sector.
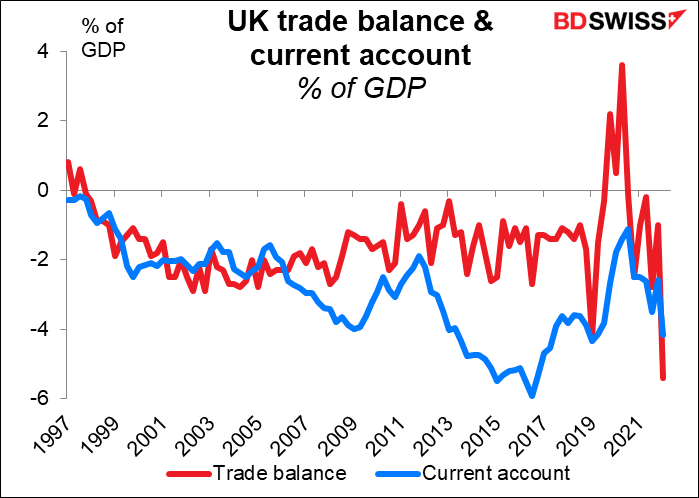
This may be one reason why the pound fell despite the surge in UK rates. It’s going to be difficult for the UK to cover its widening current account deficit if it can’t attract enough money into financial assets to cover it. That means providing investors with a discount – either by cheaper gilts prices or a cheaper currency. The market seems to have decided on both.
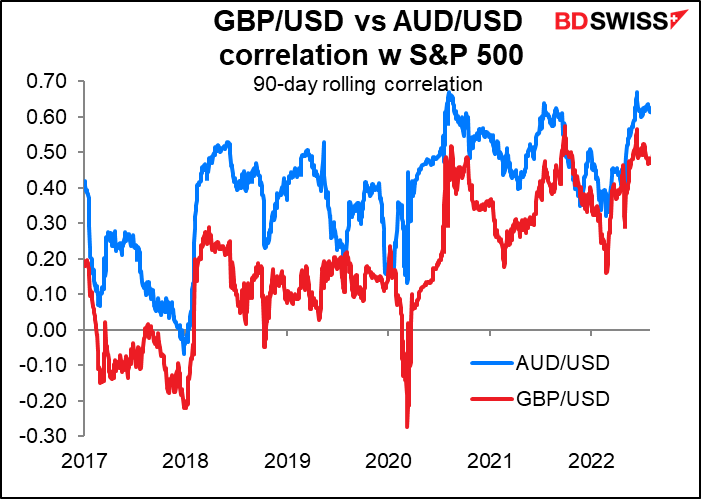
There’s also the fact that GBP has become more of a risk-sensitive currency, with its fate tied to global stock markets. Not quite as much as AUD, the major risk barometer, but getting there. The fall in stock markets may also have hindered it.
Today’s market
Note: The table above is updated before publication with the latest consensus forecasts. However, the text & charts are prepared ahead of time. Therefore there can be discrepancies between the forecasts given in the table above and in the text & charts.
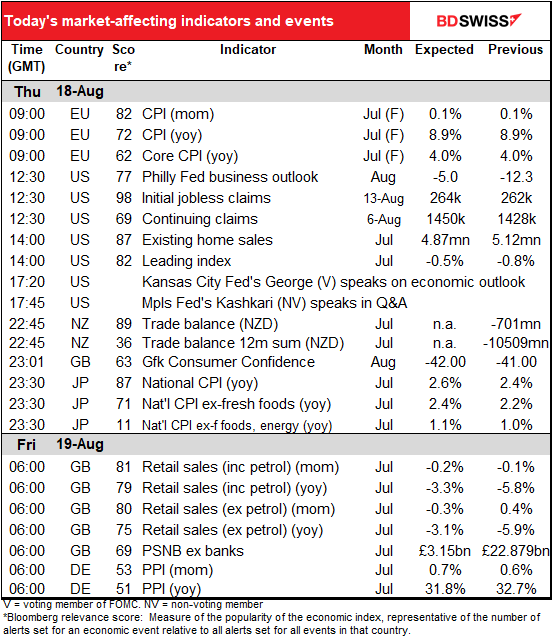
I put the final revision of the Eurozone harmonized index of consumer prices (HICP) in the schedule just in case it is revised, but usually it’s not. It could be market-affecting if there were a major revision one way or another.
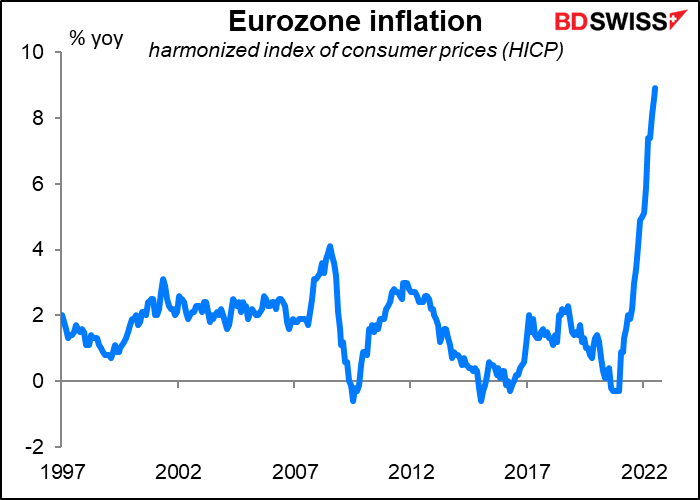
As you may remember, Eurozone CPI hit a record high of 8.9% yoy in July (data back to Jan. 1997). The US has shown some decline in inflation due to falling oil prices, but soaring natural gas prices in Europe may make it harder to see any decline in headline inflation.
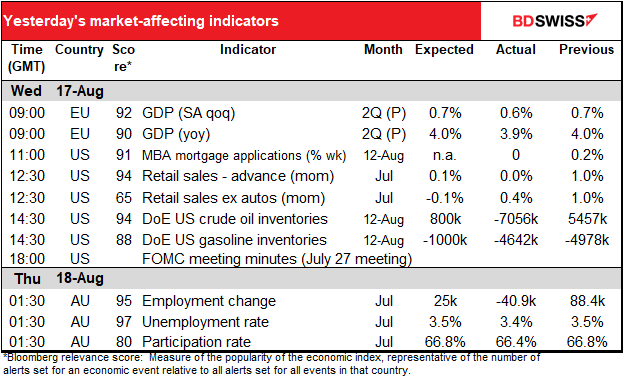
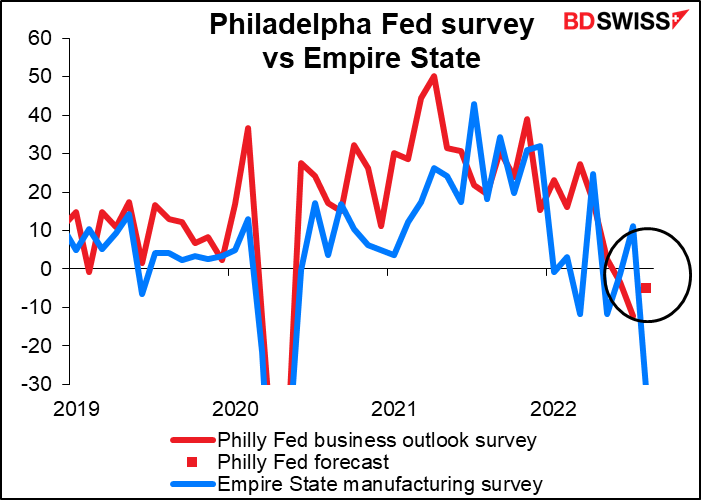
The Philadelphia Federal Reserve Manufacturing Index is expected to rise a bit. As I said on Tuesday, economists generally forecast convergence between this indicator and the Empire State manufacturing index (they’re next-door neighbors). That’s why this one was forecast to rise while the Empire State index was forecast to fall. In the event, the Empire State index plunged 42.4 points, the second-biggest decline ever. Will we see a similar surprise from today’s Philly Fed index?
Initial jobless claims have been creeping up, from their low of 166k in March to 262k last week. This week they’re expected to creep up another 3k. Not much, but it’s the direction that has people worried. Nonetheless, I wouldn’t worry too much.
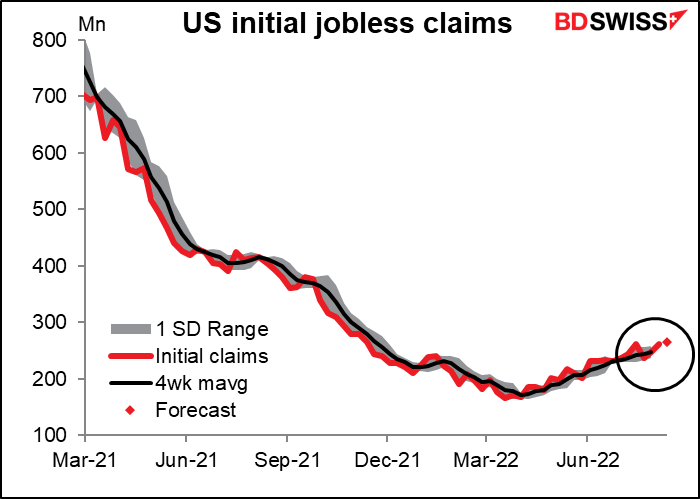
I still argue that this is a problem with the seasonal adjustment, not the jobless claims. If we look at the unadjusted figure, it’s still extraordinarily low for this time of year. The unadjusted figure last week was 203.6k, substantially lower than the 2015-2019 average of 245k. Yet on a seasonally adjusted basis it was 262k, substantially higher than the 2015-2019 average of 245k. So I don’t think this is warning about problems in the labor market. On the contrary, I think it’s still signaling a strong market.

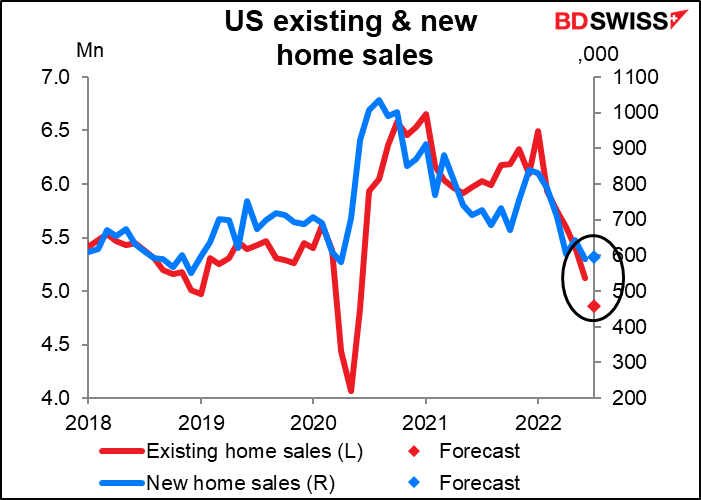
Existing home sales are forecast to be down 5.1% mom, while next week’s new home sales are forecast to be up 0.8% mom. Why? No idea. I’d expect that new home sales are forecast using building permits and the National Association of Home Builders (NAHB) index, but those haven’t been particularly wonderful recently either (the NAHB index for July fell to 55 from 67, a big drop for this index).
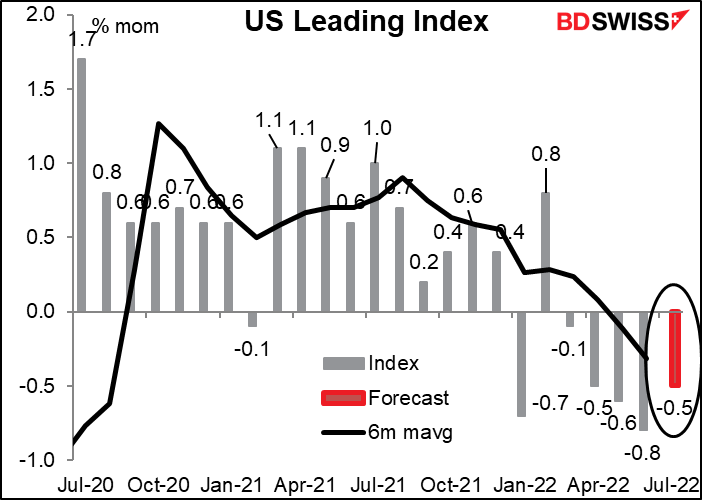
The US leading index (LEI) is expected to fall for the fifth month in a row. Not a good sign! But so far no recession is in sight.
There are two Fed speakers on the schedule: Kansas City Fed President Esther George and Minneapolis Fed President Neel Kashkari. These two make a good contrast, because Ms. George is one of the most hawkish members of the Federal Open Market Committee (FOMC) and Mr. Kashkari is definitely the most dovish. If they agree on anything, you can bet that it’s a consensus view on the FOMC.
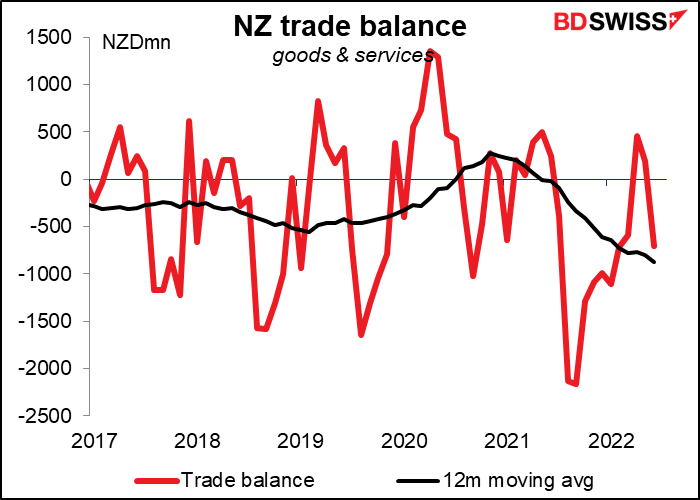
Overnight, New Zealand releases its trade data. There are no forecasts. Note that the 12-month moving average (preferable since the data aren’t seasonally adjusted) has been trending down for some time now. This is a dangerous indicator for New Zealand.
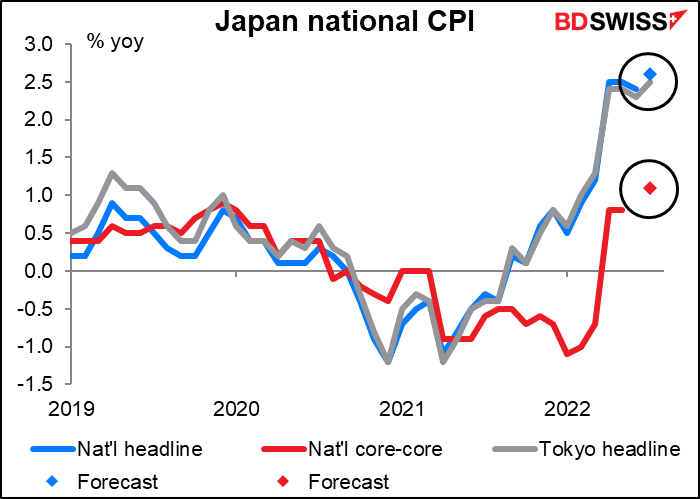
Japan, the global outlier in inflation, is forecast to see its national inflation rates inch higher. The headline rate is forecast to hit 2.6% yoy, a bit higher than the Tokyo inflation rate for the month (2.5% yoy). The headline inflation has been largely pushed higher by rising food and fuel prices thanks to the weaker yen.
Note the forecast for “core-core” inflation. This is what goes by the name “core” inflation in other countries, i.e. excluding food and energy. This too is forecast to rise, but to what? 1.1% yoy. Until this measure starts to approach the Bank of Japan’s 2% inflation target, I would doubt we’ll hear many voices arguing for a change in monetary policy. JPY-
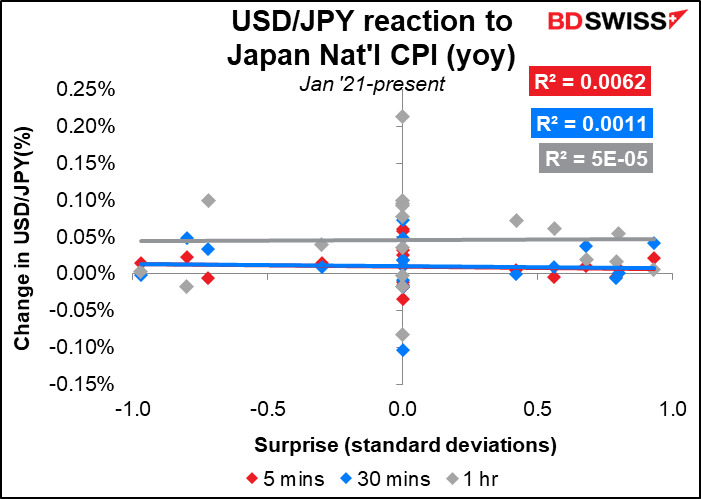
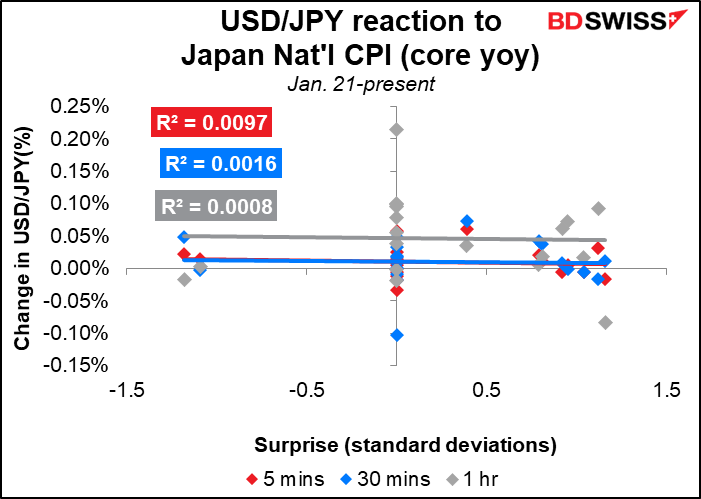
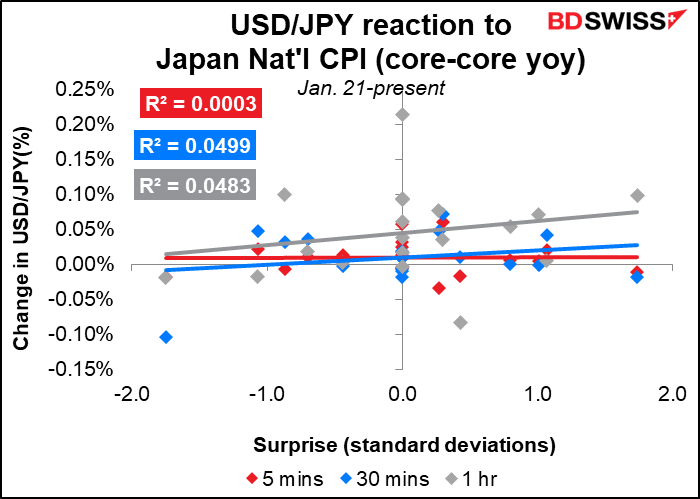
Oddly enough, USD/JPY has almost no perceptible reaction to any of the measures of the CPI. That’s unique among currencies; for most, the CPI has among the best correlation with subsequent movements of the currency of any indicator out of that country. One might think it’s because the Tokyo CPI, which comes out about two weeks earlier, provides a good preliminary version of the national CPI and so the national CPI doesn’t move the currency that much. But there’s similarly little reaction to the Tokyo CPI, either! Nor is it because the market gets the CPI right so many times. I tried taking all the hits out of the calculation and that didn’t improve the results either. I can only think it’s because everyone knows the Bank of Japan isn’t going to do anything no matter what the CPI is.
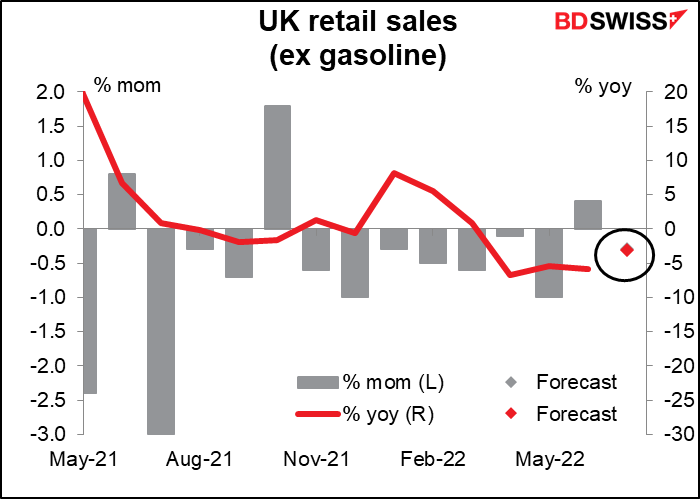
Then Friday morning, Britain releases its retail sales. Sales are expected to be down from the previous month, which got a bump up from the Jubilee weekend. The trend in retail sales has deteriorated in recent months, according to Google mobility data, which shows a drop in retail and recreational traffic. CBI retail sales data also came in negative for a fourth consecutive month (although the British Retail Consortium’s data did show a rise in sales during July).
In any event, the data will highlight the conundrum facing the Bank of England – soaring inflation and a stagnating economy. That could be negative for GBP.
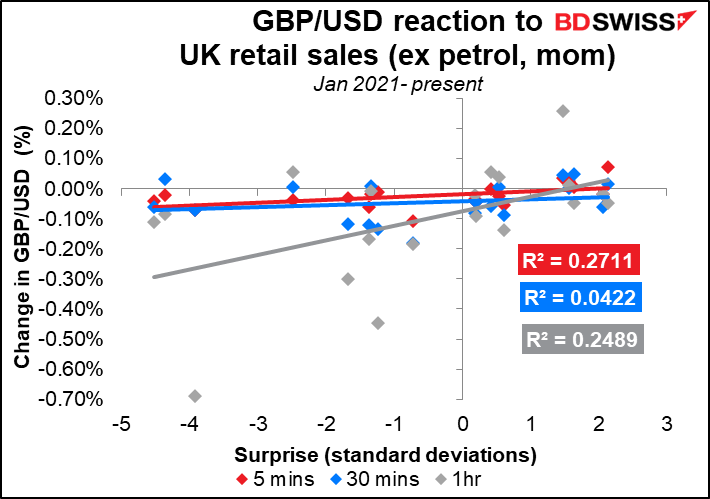
This indicator does move GBP/USD in a consistent way, although not very much.
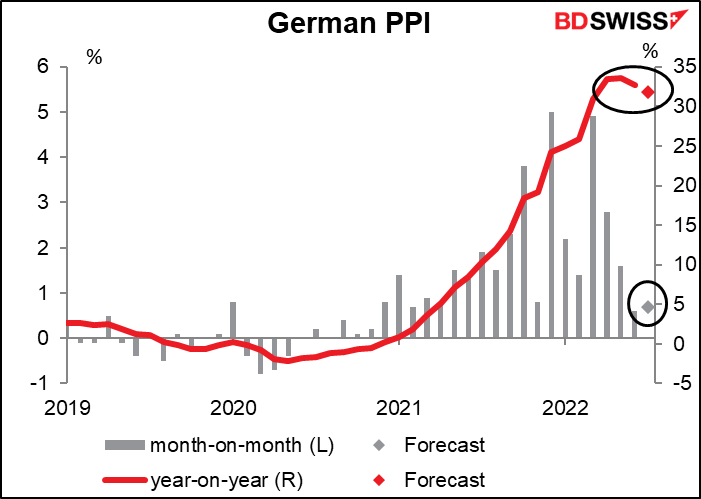
I wouldn’t make a fuss about German producer prices except the whole world is focused on inflation data now, so anything along those lines can be market-affecting. That being said. I don’t think a decline from 32.7% yoy to the market consensus forecast of 31.8% is going to rock anyone’s view of the world.
