Rates as of 05:00 GMT

Market Recap
It seems that much of Tuesday’s action was driven by something that happened Monday afternoon European time that I didn’t mention in Tuesday morning’s comment. Fed Gov. Waller said he wants to see 50 bps hikes at every meeting “until we see substantial reductions in inflation. Until we get that, I don’t see the point of stopping.” That’s odd, because it’s well known that monetary policy operates with a lag of six to nine months at least – some say as much as 18 months. It’s like saying “I’m not going to turn this oil tanker until we’re in the harbor,” neglecting to note that it takes so long to turn the ship that it will crash into the dock before it turns.
One possible reason for his determination: the politics of inflation. Right now, President Biden’s popularity is lower than even The Former Guy’s was at the same time in his administration, according to the statistical website fivethirtyeight.com (The green line is Biden’s popularity, the grey line is the other fellow’s.)

This may be why President Biden Tuesday met with Fed Chair Powell and Treasury Secretary Yellen to discuss his top priority: “addressing inflation.” Of course this is just political theater since everyone knows the President can’t do much about it. But it’s also about giving the Fed political cover if its policies prove unpopular, as Fed Chair Volcker’s did in the 1980s (when a 20% fed funds rate managed to quell inflation at the cost of 11% unemployment).
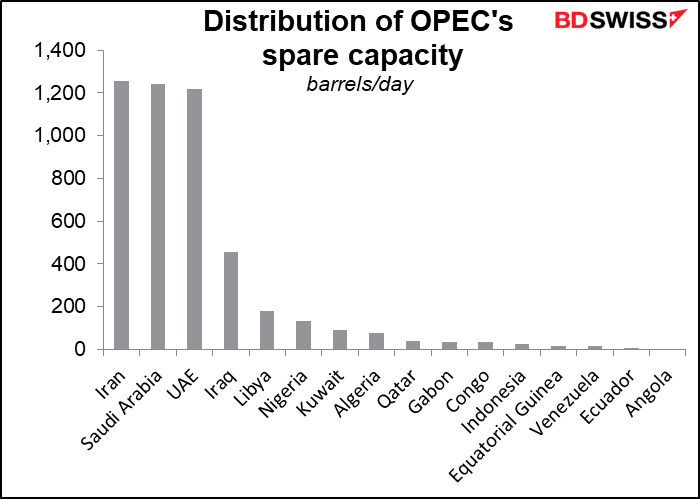
Meanwhile, President Biden may score a small victory in the fight against high oil prices. Oil prices plunged yesterday on a report in the Wall Street Journal that some OPEC members are exploring the idea of exempting Russia from the OPEC+ quota system because sanctions undercut Moscow’s ability to pump more. If Russia were outside the agreement, then OPEC+ could reallocate the quotas or redo the entire agreement, paving the way for Saudi Arabia and other countries with spare capacity to pump more.

The move might be a response to last week’s call for help from the G7, which noted OPEC’s “key role” in managing the oil market and once again called on “oil and gas producing countries to act in a responsible manner and to respond to tightening international markets.” Somehow I doubt whether this request will make much of a difference.
There are only four OPEC members who have any real spare capacity, and one of them – Iran – can’t sell all of its oil anyway, so realistically that leaves Saudi Arabia, the UAE, and Iraq, with a total spare capacity of 2.9mn barrels a day. That’s not enough to make up entirely for lost Russian production, but it would go a long way.
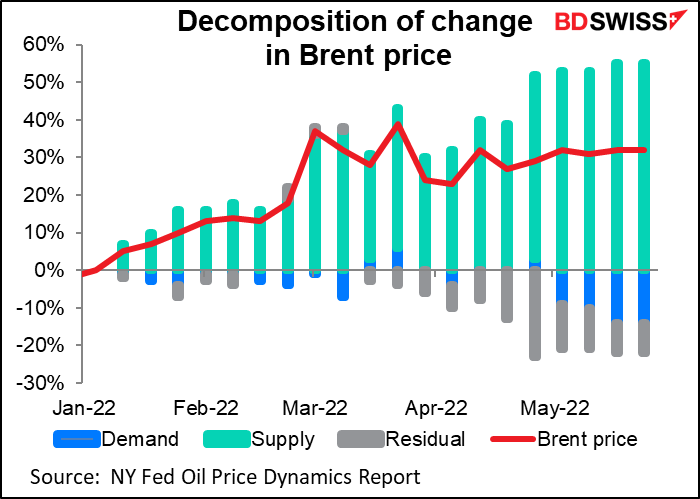
It might help, though. The New York Fed’s Oil Price Dynamics Report attributes all the rise in prices to supply constraints. Demand on the other hand is working to push prices down. So an increase in supplies would probably help to push prices down somewhat.
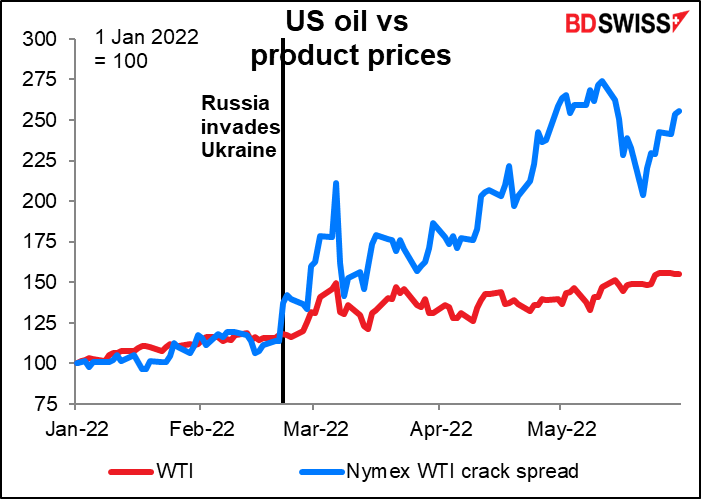
Of course, exempting Russia won’t solve all the problems in the oil market. As I pointed out yesterday, the price of refined products has soared far above what’s implied by the rise in crude oil prices because of a shortage of products and a shortage of refining capacity. The price of the US benchmark crude West Texas Intermediate (WTI) has gone up 55% so far this year but the crack spread – the value of the gasoline and fuel oil that can be refined from one barrel of WTI – has gone up 155%. I don’t know how much refining capacity OPEC members have.
In Europe, the Eurozone consumer price index (CPI) soared to a record 7.8% yoy, not that surprising after Tuesday’s blowout German CPI. The 50 bps crowd got another member: Slovakian Central Bank Governor Kazimir, who said he was “open to talk about 50 basis points” even if his baseline is still for a 25 bps move in July. That makes four of the 25-member ECB Governing Council (central bank governors of the Netherlands, Austria, and Latvia too) so hardly a majority, even considering that only 21 members vote at each meeting. And the central bank governors of Italy and Spain both argued for a gradual increase in rates, which would be consistent with 25 bps.
Still, the comments were enough to push up rate expectations. The market now expects 118 bps of tightening this year vs 109 bps a week ago. Note that there are only four ECB meetings from July to December (July, Sep, Oct, Dec) and so if they only move by 25 bps at each meeting it would be impossible to increase rates by 118 bps.

This of course begs the question of why the euro was weaker. Some commentators have attributed it to the fact that today marks the start of the Fed’s quantitative tightening (QT) process. They will start by reducing their balance sheet by $47.5bn a month, $30bn in Treasuries and $17.5bn for mortgage-backed securities. These numbers will both double after three months. We’ll have to see what impact this has on financing conditions. Ascribing the euro’s weakness to a move that hasn’t happened yet seems to me to be a bit dodgy, but I don’t have any better explanation for why the dollar is at the top of the chart today.
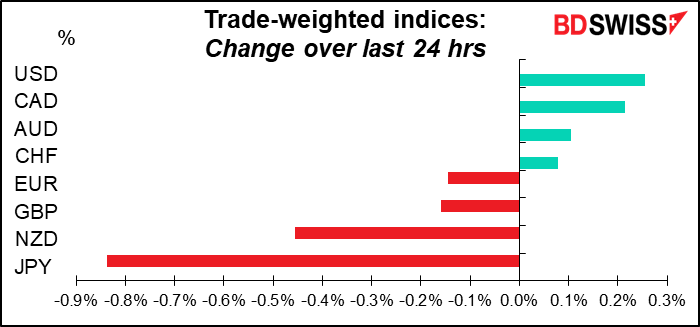
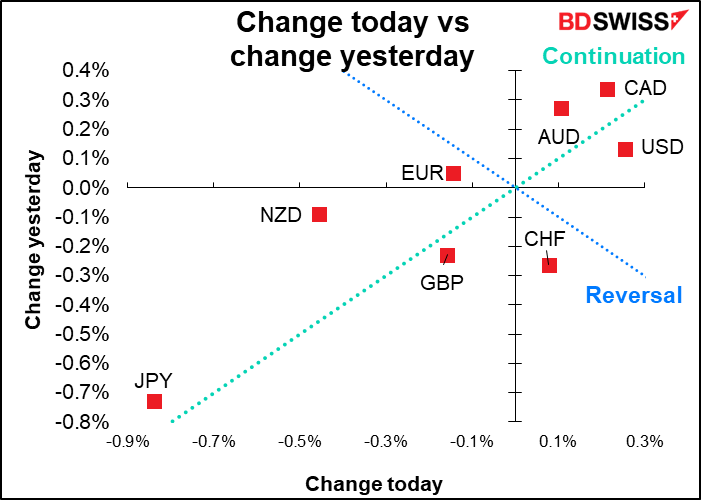
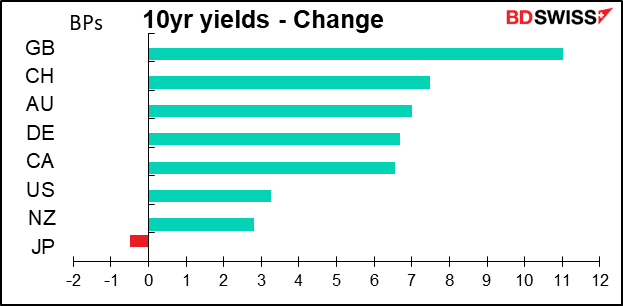
US bond yields were higher, but not by the most – that honor went to GBP.
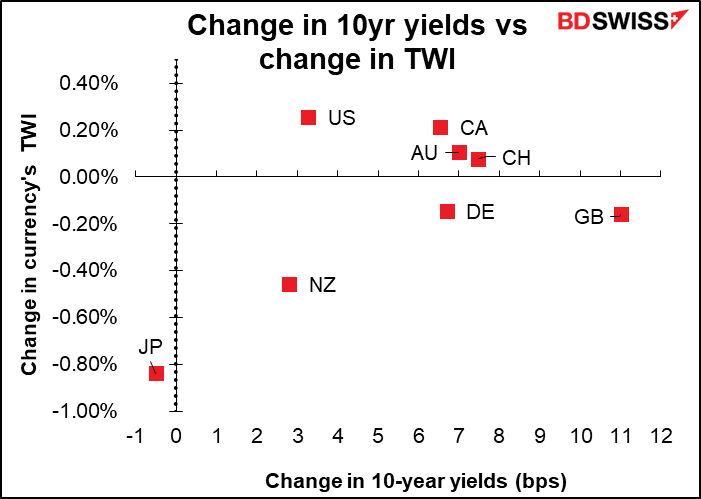
But there doesn’t seem to be much correlation between the change in yields and the change in currency values yesterday.
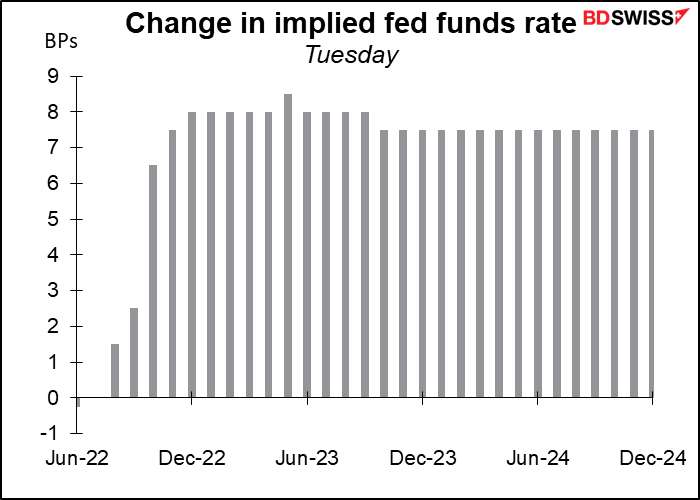
Although it could’ve been the sharp rise in fed funds expectations, which jumped about 8 bps for this year from Friday’s close (the market was closed on Monday).
That would also explain the weak yen, since, as I’ve pointed out innumerable times (“until my mouth becomes sour,” as the Japanese idiom goes) the Bank of Japan is probably on hold for the remainder of the Anthropocene Era.
Elsewhere, gold and silver fell on higher interest rates and the stronger dollar. I expect interest rates to move significantly higher in the US and so I’m not that optimistic about the future for the precious metals.
Today’s market
Note: The table above is updated before publication with the latest consensus forecasts. However, the text & charts are prepared ahead of time. Therefore there can be discrepancies between the forecasts given in the table above and in the text & charts.
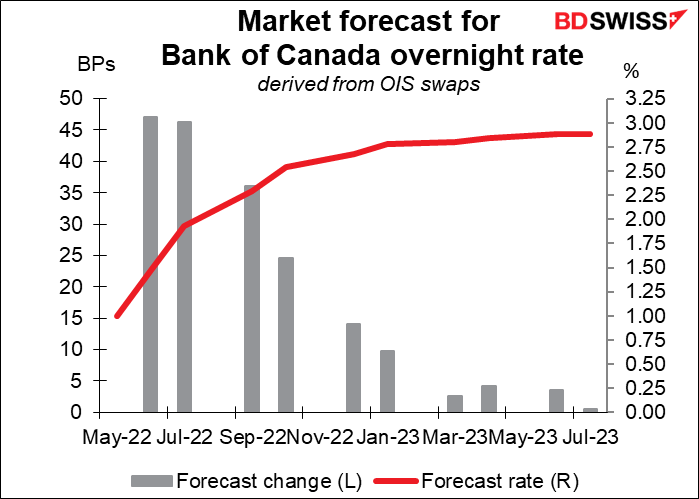
The big event today will be the Bank of Canada rate decision. I discussed this in the usual detail in my Weekly Outlook but I’ll repeat the main points here for those who may have missed that.
The market expects a 50 bps hike from the BoC at this meeting and the next, and maybe even the one after that too!
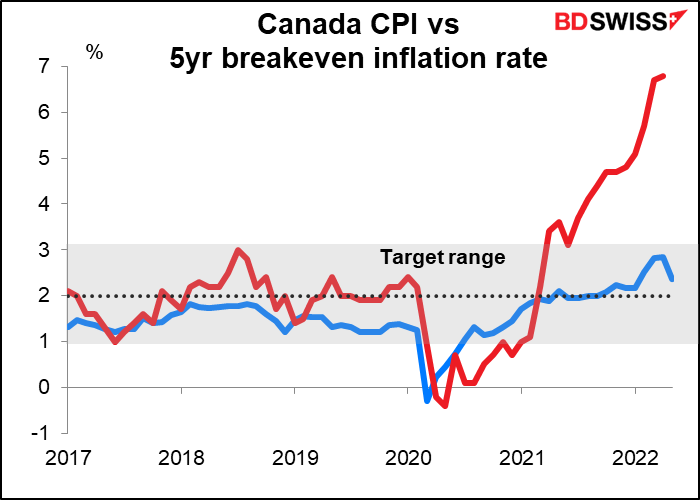
Inflation in Canada remains well above the 1%-3% target range and inflation expectations are rising too, which is Kryptonite to central bankers. The BoC said back in April that “There is an increasing risk that expectations of elevated inflation could become entrenched. The Bank will use its monetary policy tools to return inflation to target and keep inflation expectations well-anchored.”
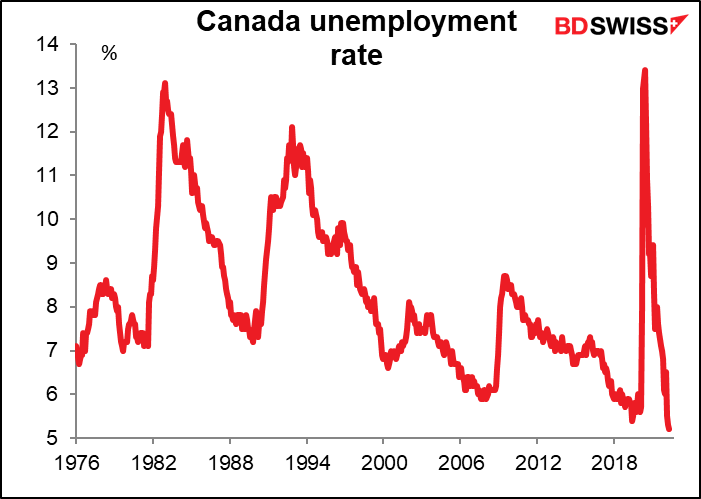
Meanwhile the unemployment rate is at a record low. Employment growth is slowing because there aren’t enough people who need jobs! No wonder the Bank said in April that “With the economy moving into excess demand and inflation persisting well above target, the Governing Council judges that interest rates will need to rise further.”
I think this meeting will be a lot like the recent Reserve Bank of New Zealand meeting, where the policy action wasn’t in doubt and the focus was instead on the outlook for future rate hikes. In that respect, I think there’s the possibility that the BoC surprises on the upside. Having said that, there won’t be a new Monetary Policy Report nor a press conference after the meeting. There will however be an Economic Progress Report by Deputy Gov. Paul Beaudry the next day – that could be an opportunity to push CAD higher.
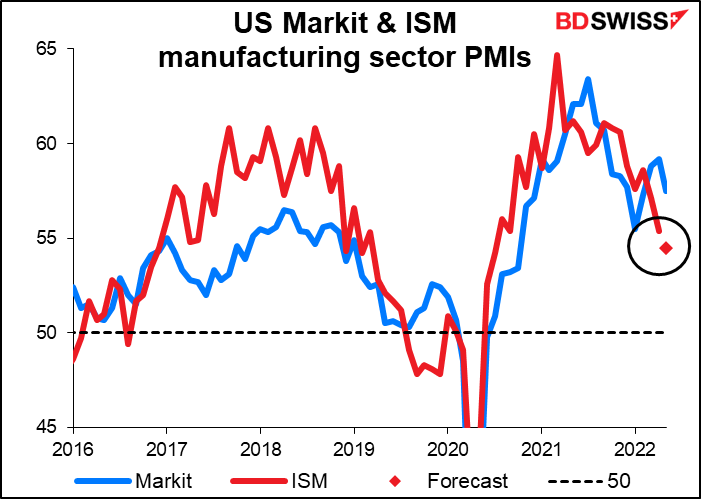
As for the indicators, today is manufacturing purchasing managers’ index (PMI) day. We get the final manufacturing PMI for those countries that have preliminary versions, such as France and Germany, and the one-and-only for the others, such as Switzerland and Canada. I won’t bother discussing them because we have no forecasts for the ones that had preliminary versions (the preliminary numbers are the forecasts) and the others aren’t that important. As you can see, the manufacturing PMIs that we’ve gotten so far have generally shown that demand is still expanding, but at a slower pace.

Fifteen minutes after the final manufacturing PMI for the US comes out, we always get the Institute of Supply Management (ISM) version of the same index. It has a long and illustrious history, stretching back to 1948. Unfortunately the methodology perhaps isn’t as great as it could be (according to Markit, at least; I’ve never seen the ISM itself defend its methodology). The main problem seems to be that they ask about the company as a whole, not just the US operations. Given that most major US companies earn about half their profits overseas, the ISM index might be a better gauge of the global situation than the US situation alone.
In any case, it’s expected to be down 1 point, vs the 1.7-point decline in the month for the Markit version.
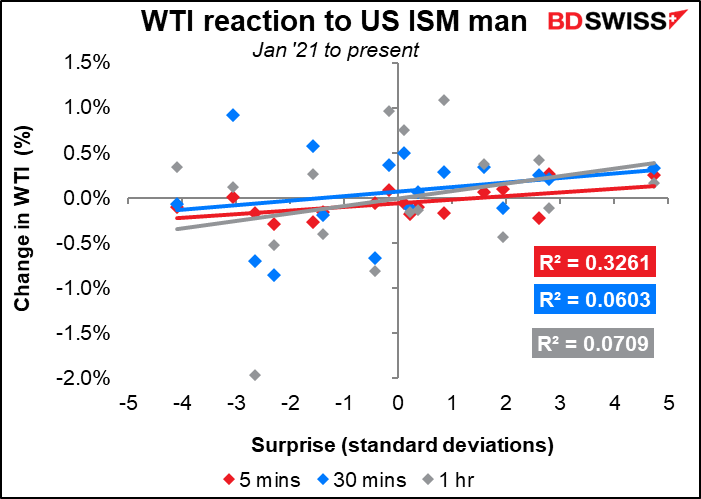
Although this is one of the most closely watched US indicators, the impact on the currency market seems quite transitory. There’s an immediate impact but after an hour very little correlation with the indicator. Oil is strongly impacted at first too.


European Central Bank (ECB) President Lagarde and many other noteworthy individuals will be participating in Green Swan 2022, a conference on central banks and climate change. According to their website, they will discuss “the topics of (i) monetary policy setting and operations in the context of climate change, and (ii) the role of finance in the climate transition, including transparency and disclosures, transition plans and financing green innovation.” I doubt if anything of immediate interest to the markets will come out of this, but I have to mention every time Lagarde or Powell appears almost anywhere (unless it says “introductory remarks” or something like that).
The Job Offers and Labor Turnover Survey (JOLTS) program is getting a lot of attention nowadays, at least from policymakers, who often cite the number of jobs relative to the number of unemployed persons as a reason why they consider the market to be “historically tight.”
The forecast is for a small (-249k) decline in job openings from March’s record high. There’s no forecast for the quit rate, the percentage of people who quit their job willingly every month. That’s an interesting indicator too because people rarely quit without another job lined up so it’s a gauge of confidence in the job market.
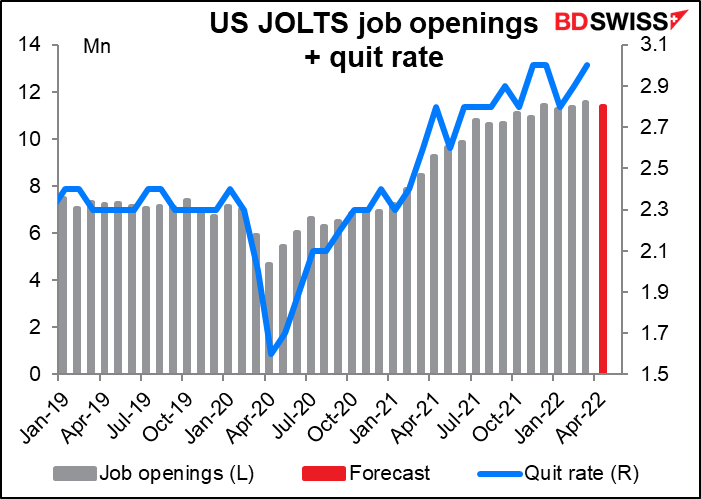
That would mean a staggering 1.92 job openings for every unemployed person. That’s down a bit from 1.94 last month but still…for most of the time we have data for (going back to 2001) there was fewer than one job per person. Now it’s almost 2. This is why Fed Chair Powell refers to the job market as “historically tight” and why they think they can tighten monetary policy without causing massive unemployment. (Back in the 1980s, when Fed Chair Volcker sent the fed funds rate up to 20% to tame inflation, the unemployment rate hit 10.8%.)

The Fed releases the “Summary of Commentary on Current Economic Conditions,” aka The Beige Book as always two weeks before the next FOMC meeting. It’s significant for the market because the first paragraph of the statement following each FOMC meeting tends to mirror the tone of the Beige Book’s characterization of the economy. The Beige Book is largely anecdotal – there’s no official “Beige Book index” or other number associated with it –so you’ll just have to watch the headlines as they come out.
I’m sure you’re dying to see a graph of the Japan monetary base, but I’m not going to bother with it since we have enough graphs already today.
Australia’s trade balance is expected to fall a bit but still be solidly in surplus. The figures aren’t seasonally adjusted so I like to look at the 12-month moving average. Using the market consensus forecast, the 12m moving average will be nearly unchanged (AUD 10.273bn vs AUD 10.294bn). It may well be that this is how people forecast this indicator: just use Excel’s “goal seek” function to find out what this month’s figure has to be to keep the 12m moving average the same. (Strictly speaking, the answer in that case would be 9,248. I have to admit that out of the 17 estimates in Bloomberg there is no one forecasting that amount or even 9,200.) In any case, I expect that if the figure comes in line with the forecast it won’t have much impact on the exchange rate as it doesn’t suggest a major change in either direction.

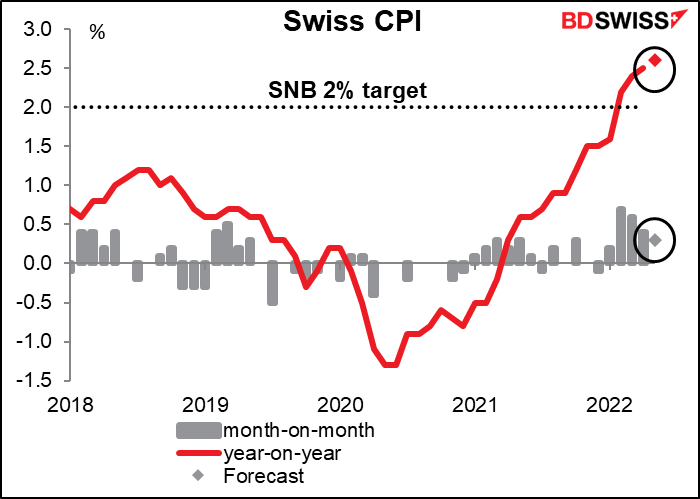
Then early in the morning, as the sound of the Alpenhorn reverberates across the mountains, Switzerland releases its consumer price index (CPI). It’s expected to move even higher above the Swiss National Bank (SNB) 2% target. That may reinforce the idea that the SNB is either going to let the CHF exchange rate appreciate to offset imported inflation and/or that it will follow the ECB with a rate hike eventually (probably at its Sep. 22nd meeting, which would be the first one after the ECB’s July meeting, which is when they’re expected to hike). A further rise in the Swiss CPI should therefore be positive for CHF.