

Rates as of 04:00 GMT
Market Recap
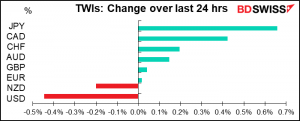
Another day, another downleg in the dollar. The Empire State manufacturing index missed expectations and fell to 3.7 from 17.2 in July, suggesting that the US expansion is beginning to stall. At same time, the National Association of Home Builders (NAHB) index came out 180-degrees opposite: it hit a record 78, just as we said it would (the only legal inside information you’re ever going to get!) Neither of those indicators had much impact on the market however – if you look at a graph of yesterday’s price action, you’d be hard-pressed to see when they came out. Rather, it was just a steady decline in USD throughout the day. There seemed to be no particular cause for the movement. Perhaps it was the decline in US bond yields, perhaps continuing disappointment with the US Senate’s inability to come up with a proposal to fund CARES 2.0, perhaps just general market sentiment against the beleaguered dollar. One might attribute it to a “risk-on” mood, but in that case, why would JPY be the best performer?
The S&P 500 managed to break above the previous closing higher of 3,386.15 set on 19 February, but failed to close above that level – nor did it break the 19 Feb intraday high of 3,393.52.
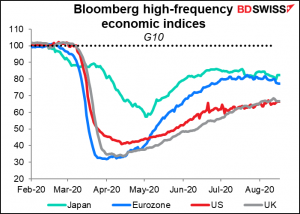
The Bloomberg summary of high-frequency indicators also suggests the recovery is losing strength in Japan and the Eurozone and plateauing in the US and UK. The Bundesbank’s weekly short-term indicator of German activity however continued to rise; I’ll publish that tomorrow along with an updated Fed index (due out later today).
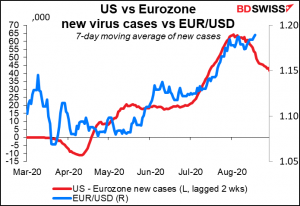
The downturn in EU activity vs the plateauing in US activity is an important indicator to watch. One of the main things driving EUR/USD higher has been the “growth divergence” play, but if that seems to be stalling, then USD/EUR could stall as well. The “virus divergence” play seems also to have run its course. Although the virus is much worse in the US than in Europe, the difference is no longer increasing.
Waning recovery could add to demand for JPY and CHF, never mind that activity in Japan is waning too. Whether it sparks a “safe-haven” bid for USD too is doubtful though – it looks like the market is getting fed up with US politics and the failure of the US to come to grips with its virus problem.
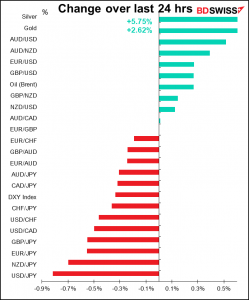
Silver was up 5.75%. Again.
Today’s market
A fairly quiet day in terms of indicators: nothing major out during the European day and just one out during the US day. The big news will come out of Japan overnight and Britain early tomorrow morning.
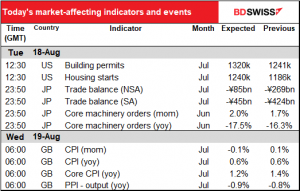
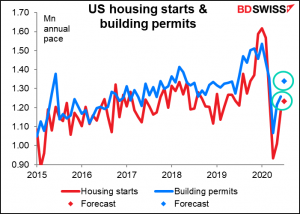
The US housing market is likely to show its strength in housing starts & building permits today and existing home sales on Friday. Starts are expected to rise 4.1% and permits are expected to rise an even faster 6.5% in anticipation of an acceleration of building in the future. This is an unanticipated outcome of the virus: as people worldwide discover that they can work from home, we’re seeing internationally a surge in people moving out of the cities and into suburbia.
Japan’s trade is expected to be more or less in balance in July. This would be an improvement on both a seasonally adjusted and unadjusted basis (in Japan, people pay more attention to the NSA figure than to the SA figure.)
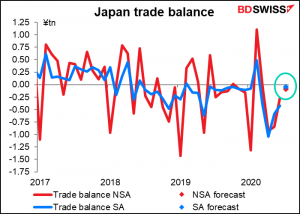
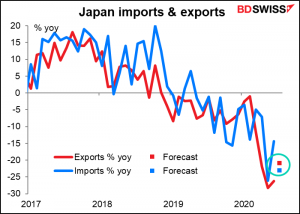
The reason though is not especially wonderful. Exports still are expected to collapse, just at a slower pace than in the previous month, while imports are expected to collapse at an even faster pace. Nevertheless, it’s the net result that matters, not the reason, and the news could be JPY—positive.
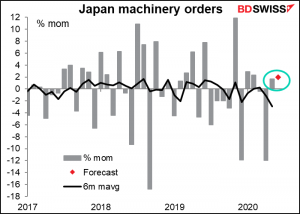
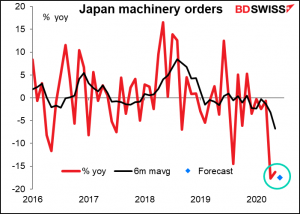
Japan’s machinery orders…the indicator that I love to hate. It is popular though; it has a Bloomberg score of 93.75, meaning 93.75% of all the people who register to get alerts on Bloomberg when indicators about Japan come out have this one registered. The mom figure is more important than the yoy rate of change, which is maybe a good thing this month, because the mom rate of change is expected to accelerate a bit, while the yoy rate of change is expected to fall further.
Then early Wednesday morning, Britain announces its inflation data. Unlike last week’s US CPI, both headline and core measures are expected to show decelerating inflation. That would be a surprise to the Bank of England. In the minutes to the latest (6 August) meeting, they said that the Bank’s research department “expected the inflation rate in July to rise further, to 0.7%, before falling sharply, and potentially turning negative, in August.” The decline would be due to two government measures recently enacted to stimulate demand: the cut in VAT on some entertainment venues and discounts for people eating in restaurants in August.
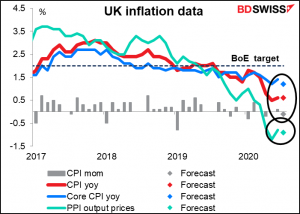
In any case, the Bank expect inflation to average around 0.25% in the latter part of the year and have vowed not to tighten policy “until there is clear evidence that significant progress is being made in eliminating spare capacity and achieving the 2% inflation target sustainably.” The question is though, what would it take for them to loosen policy?
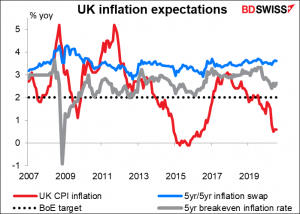
One clue is in another line in the minutes: “Overall, the Committee judged that inflation expectations remained well anchored and consistent with inflation close to the 2% target.” It’s true that UK inflation expectations are preternaturally stable. They’ve barely changed for years even as inflation has gyrated around the target. The five-year breakeven inflation rate has come down recently, but that may have more to do with the inner workings of the gilts market than with inflation expectations. The five year/five year inflation swap hasn’t budged, and both remain comfortably above the Bank’s 2% target. If inflation expectations start to dip, then perhaps the Bank will get worried. But that’s not happening yet.
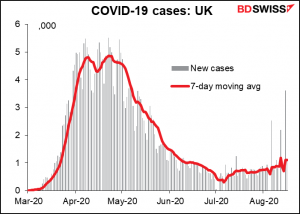
The other possibility is that the Bank’s assumptions start to go awry. The MPC assumed that “the direct impact of Covid-19 on the economy dissipated gradually over the forecast period…” and that “there was an immediate but orderly move to a comprehensive free trade agreement with the European Union on 1 January 2021.” I’m not sure which of those two assumptions is less likely. So far the virus shows no signs of “dissipating gradually,” nor have I seen any signs of a “comprehensive free trade agreement” with the EU. I think the likelihood of further easing in the UK remains high, with the likelihood of further GBP weakness accompanying it.
Questions? Comments? Complaints? Something you don’t understand? Chat with Marshall at [email protected]


