

Commitments of Traders (CoT) report
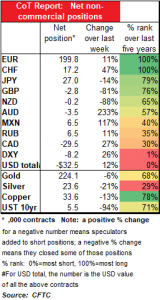
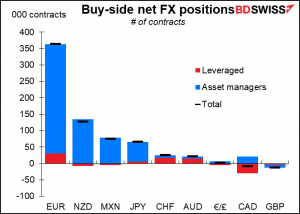
The market keeps on buying euros and selling dollars. Both the EUR and DXY contracts are at extreme positions for the last five years. CHF is also at an extreme, but as we pointed out last week, that’s only because the market has been mostly short (and wrong) for the last five years.
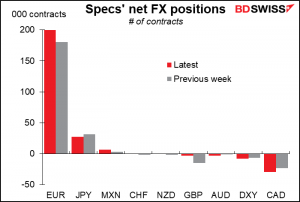
Speculators mostly reduced short currency positions last week, including GBP, NZD and AUD. However they cut JPY longs and added to CAD shorts – hah!
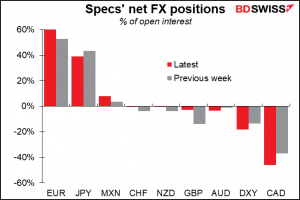
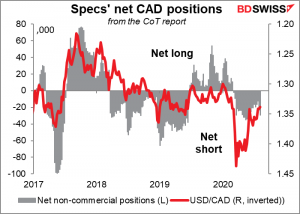
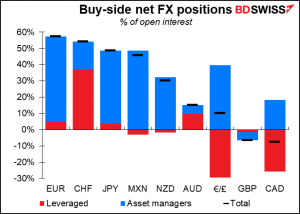
Note too that although the net short number of CAD contracts is not that great, the net shorts are 46% of total open interest, meaning the market is fairly lopsided towards the short side. That may be one reason why USD/CAD exploded higher at the end of the week (remember, these data are from Tuesday and released on Friday.) CAD positioning is not extreme, but they have been short for some time – good thing too as CAD has been one of the worst-performing G10 currencies this year. But if oil prices continue to firm, they may decide to reduce shorts more or even go long, meaning there’s potentially a lot of firepower left for the long CAD trade.
Asset managers vs leveraged funds: Breaking down the participants further, CHF and AUD are the only two currencies where hedge funds are driving the market, both in terms of the number of contracts and the way open interest is leaning.
CAD is a tug-of-war between asset managers (long) and hedge funds (short). That may be one reason why the currency was so volatile last week – hedge funds (or more accurately, Commodity Trading Advisors) in this case aren’t hedging anything and can easily change their views.
Retail investors
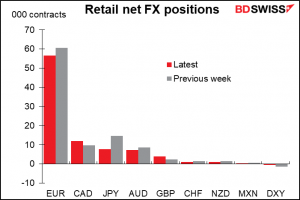
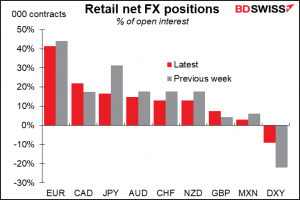
Retail speculators have some different views than professionals. While long EUR is the biggest position for both, unlike the professional world, retail is long CAD too. In fact that’s their #2 position.
Retail also trimmed their short DXY last week, although admittedly this is a tiny position. They also trimmed JPY longs, as did the pros.
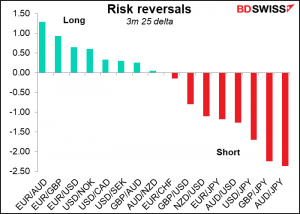
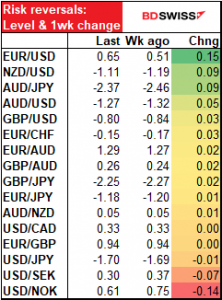
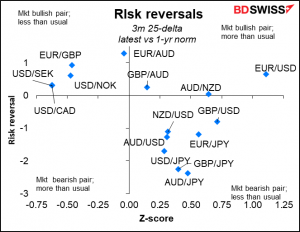
Risk reversals (RR)
The market is getting more bullish EUR/USD. The bullishness did not necessarily extend to the other EUR crossrates however which were little changed. Note that the EUR/CHF RR is virtually flat (-0.15), indicating no great conviction on the direction of that pair.
They are also getting less pessimistic on the Antipodes (AUD and NZD), as NZD/USD and AUD/JPY both became less negative over the last week. AUD/JPY remains the most bearish pair nonetheless, so we shouldn’t get carried away here. The market is also negative on GBP, as EUR/GBP is the #2 long and GB/JPY is the #2 short.
On the other hand, the market is becoming less optimistic for the Skandis.
Gold & Silver
Commitments of Traders (CoT) report
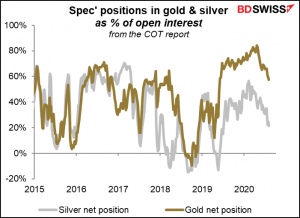
Speculators have been cutting their long positions in both gold and silver.
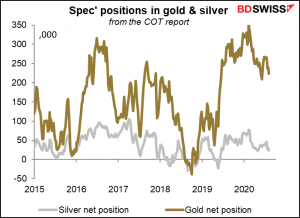
They remain more confident about gold than silver, which is surprising, given the incredible moves we’ve seen in silver this year. Still, they are trimming their longs not only outright but as a percent of their overall positions in both metals, suggesting that they have their doubts about the recent spurt.
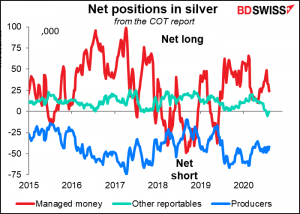
Hedge funds are reducing their long gold positions, while “other reportables” – a miscellaneous category for professional investors – have been increasing theirs. Gold producers seem to be relatively confident that prices will remain high – they’re reducing their hedges, not increasing them.
The professional world seems to doubt the silver rally – fund managers have been reducing longs and “other reportables” are slightly short.
Retail investors have similarly trimmed their long gold positions and even cut their long silver a bit, although the latter remains near recent highs.
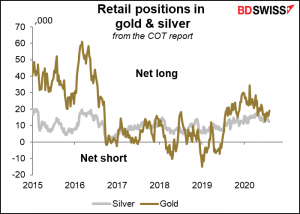
It’s hard to see from these data what’s driving the surge in precious metal prices. Whatever it is, it’s not going through the US commodity futures markets.
Risk reversals
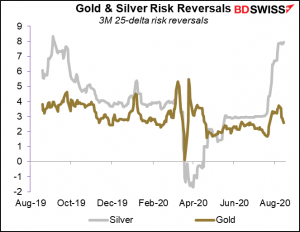
The options market remains bullish both metals. The silver RR is at the highest it’s been in almost a year. Gold has come down a bit from this level earlier in the month but remains at its highest since end-April.
EXPLANATIONS AND DEFINITIONS:
The Commitments of Traders (CoT) report, from the US Commodity Futures Trading Commission, presents data on all the futures markets in the US. The data is taken on Tuesday and is released on Friday evening in the US.
For currencies, there are three broad classifications of traders. Professional traders are separated between “commercial” and “non-commercial” participants “Commercial” accounts are those that largely using futures to hedge their positions. “Non-commercial” accounts are largely those that are using the futures to speculate in the markets, such as hedge funds, asset managers, and individual traders. We refer to them here as “speculators.” There is another category, “non-reportable,” that consists of small investors whose transactions are individually too small to report on. We present them here as “retail.”
For the financial futures, the data on professional traders are further broken down into “asset manager/institutional,” which includes pension funds and insurance companies – so-called “real money” investors – and “leveraged funds,” which are typically hedge funds and other types of speculators. (There are other categories as well, but we don’t cover them here.) These categories do not necessarily add up to the “non-commercial” figure because of overlap.
For the physical commodities, the “commercial” category, which we don’t worry about, is broken down between “producers/users” and “swap dealers.” “Producers/users” are those that mostly produce, package or handle a commodity. “Swap dealers “are entities that trade with other firms and use the futures market to hedge, such as investment banks. We ignore the swap dealers, as their activity mostly reflects what they are doing in response to other business, but include “producers” in our gold & silver charts.
The “non-commercial” category, which we refer to as “speculators,” is broken down into “managed money” and “other reportables.” “Managed money” consists of registered commodity trading advisors (CTAs), registered commodity pool operators (CPOs), or other funds that trade commodities on behalf of clients. “Other reportables” are all the other professional investors that are not in the other three categories.
“Open interest” is the number of both long and short contracts that have yet to be closed out. The “net position as a % of open interest” shows the net position as a percent of the total contracts still open. It’s important because it shows how tilted the activity is to either the long or short side.
You can think of the contracts as being like people in a boat: the “net position” tells you how how many people are on the left-hand or right-hand side of a boat, while the “% of open interest” tells you what percent that is of the total people in the boat. You can see that even if the net position is small, if the “% of open interest” is high, it’s more likely that the boat tips over.
Note that the full CoT report includes data on both futures and options. We use only the data on futures.
The Risk Reversal (RR) is a gauge derived from the FX options market of whether the market thinks there’s a greater chance of a currency pair rising or falling. If the market thinks it’s more likely that the pair will rise, then the RR will be positive; if falling, then negative. The more positive (negative) it is, the greater the chance that the market places on the pair rising (falling). Formally speaking, the risk reversal is the implied volatility of the calls minus the implied volatility of the puts.
Z-score is a measure of how many standard deviations away from the average something is. It allows us to compare series with different volatilities.


