Previous Trading Day’s Events (27 Feb 2024)
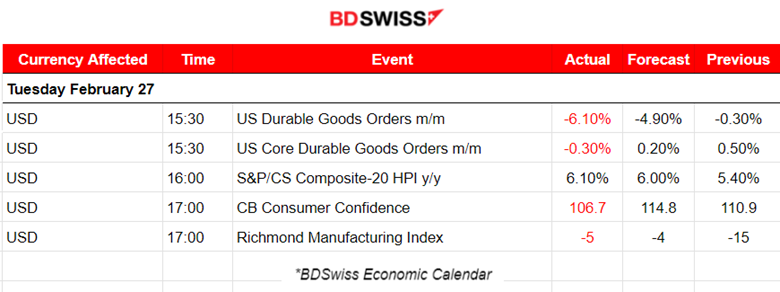
The report on consumer confidence shows that Americans are quite concerned about the economy’s outlook, especially the labour market, and the upcoming presidential election resulting in confidence retreating after three straight monthly increases. The Conference Board (CB) showed its consumer confidence index slipped to 106.7 this month from a downwardly revised 110.9 in January.
“Business capex lays the seeds for future economic growth as the expenditures enable companies to invest more to meet the demand for their goods and services down the road,” said Christopher Rupkey, chief economist at FWDBONDS in New York. “While economists have taken down their recession warnings, business leaders with boots on the ground are less certain of the economy in the future.”
“This points to a much weaker start for business equipment spending in the first quarter following a modest gain in the prior quarter,” said Priscilla Thiagamoorthy, a senior economist at BMO Capital Markets in Toronto.
______________________________________________________________________
Winners vs Losers
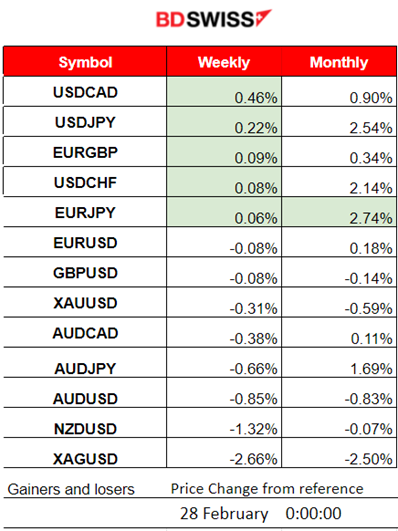
USDCAD leads this week with 0.46% gains while the EURJPY remains on the top of the month’s gainers with 2.74% gains. The USD has been gaining ground significantly since yesterday.
 ______________________________________________________________________
News Reports Monitor – Previous Trading Day (27 Feb 2024)
Server Time / Timezone EEST (UTC+02:00)
- Midnight – Night Session (Asian)
No important announcements, no special scheduled releases.
- Morning – Day Session (European and N. American Session)
At 15:30, reports for the durable goods orders for the U.S. marked the largest drop in nearly four years in January. Durable goods recorded a 6.10% decline, way more negative than expected. A sharp drop in bookings for commercial aircraft, mixed outlook for business investment on equipment, and other readings confirmed that momentum seen at the start of the year is lost for the U.S. economy. There was no major impact recorded in the market.
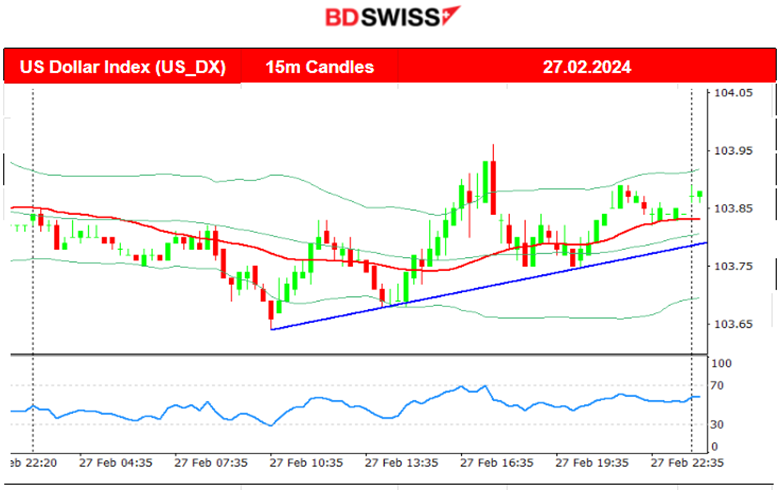
At 17:00 the CB Consumer Confidence report recorded a drop. U.S. consumer confidence soured in February for the first time in three months according to the survey. The survey’s index fell in February to 106.7, down from a reading of 110.9 in January. Americans are worried about the rising food and gas prices while focusing on the job market data as well. The market reacted with a moderate USD weakening at the time of the release.
General Verdict:
 ____________________________________________________________________
FOREX MARKETS MONITOR
EURUSD (27.02.2024) 15m Chart Summary
Server Time / Timezone EEST (UTC+02:00)
Price Movement
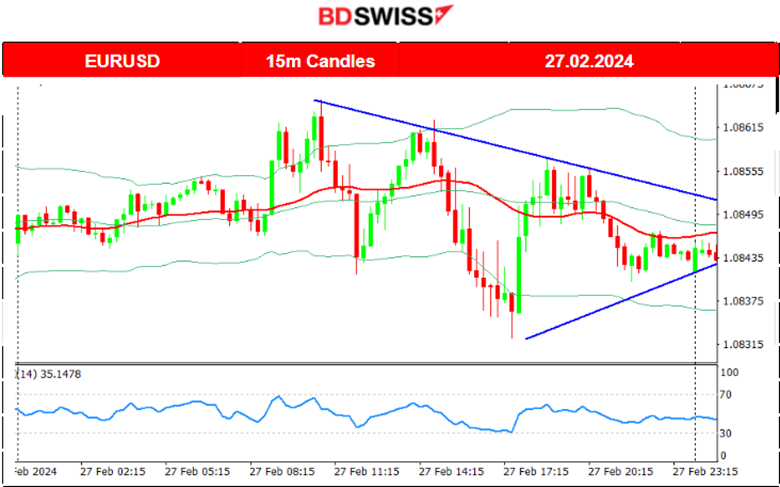
Volatility levels started to pick up early yesterday. The pair found resistance after moving to the upside and kept a rather stable sideways movement around the mean at the start of the European session. With news affecting the dollar taking place during the trading day, up-down movement around the mean was volatile, however the pair closed slightly lower. Currently, the USD gains significant ground pushing the pair to the downside.
 ___________________________________________________________________
CRYPTO MARKETS MONITOR
BTCUSD (Bitcoin) Chart Summary
Server Time / Timezone EEST (UTC+02:00)
Price Movement
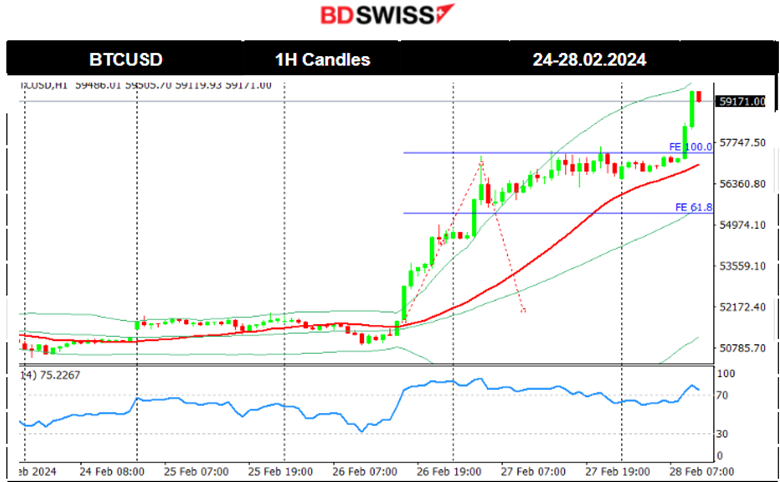
Bitcoin settled sideways for now but is governed with high volatility on its way around the 30-period MA. 52,000 USD seems to be the important resistance level. The support is apparently at 50,500 USD. On the 24th Feb, the price moved to the upside, reversing from the previous drop and after the retracement it settled near the 61.8 Fibo level near 51,450 USD. Bitcoin saw a surprise jump on the 26th Feb. The annualised funding rate in bitcoin perpetual futures listed on Binance surpassed 100% for the first time in at least a year. An upward shock took place with a chance of retracement. it reached 57,000 USD in a very short period of time from the mean near 51,500 USD. After some retracement, Bitcoin continued to surprise the markets with a further surge. It continued gaining momentum to the upside. BlackRock Bitcoin ETF hit a record volume of over 1.3B USD for the second consecutive day.
Related article:
 Crypto sorted by Highest Market Cap:
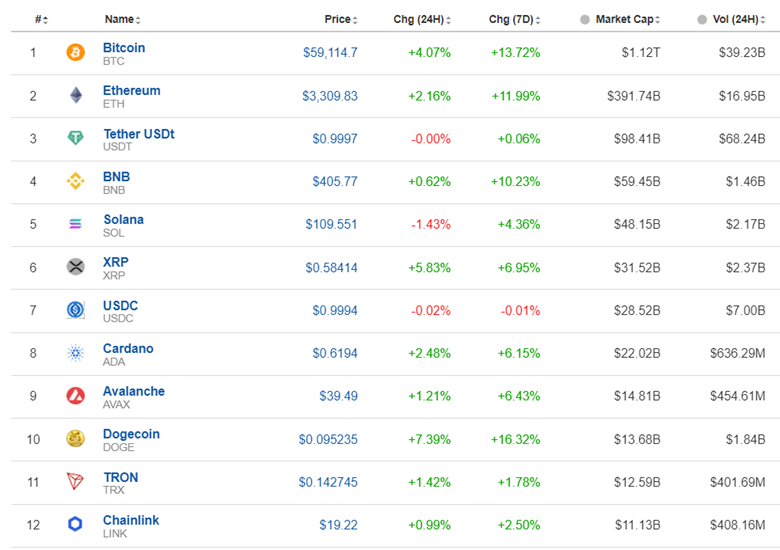 The crypto market gains activity and volume with assets gaining significantly. Bitcoin’s price is growing as ETFs gain more traction from investors. Analysts see a surge of funds into bitcoin ETFs and the asset’s upcoming “halving event” as other bullish factors.
Source: https://www.investing.com/crypto/currencies
______________________________________________________________________
EQUITY MARKETS MONITOR
NAS100 (NDX) 4-Day Chart Summary
Server Time / Timezone EEST (UTC+02:00)
Price Movement
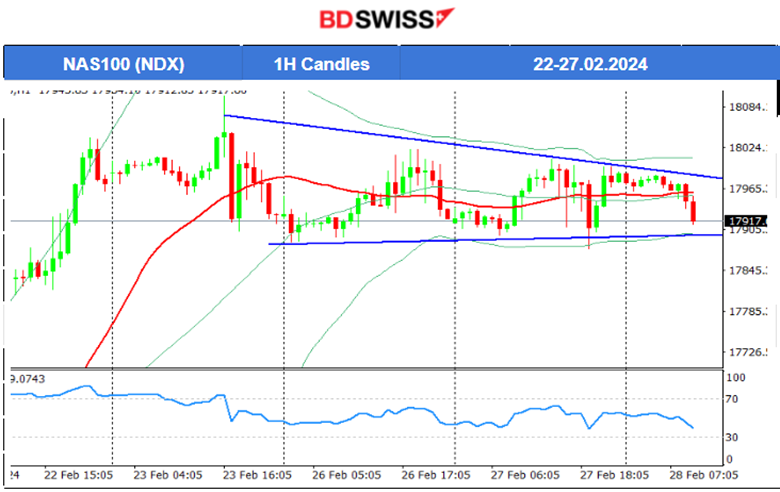
Global stocks rallied on the 21st Feb and after 22:00. All U.S. indices experienced a big jump to the upside. The tech-heavy Nasdaq 100 index jumped over 1.8%. The boss of Nvidia said artificial intelligence (AI) is at a “tipping point” as it announced record sales. It reported that revenues surged by 265% in the three months to 28th January, compared to a year earlier. On the 23rd Feb, the index moved to the upside further, breaking the 18,000 USD resistance level and reaching the one near the 18,100 USD before retracement took place. Even though the resistance was identified correctly, the retracement to the 61.8 Fibo level did not complete. The NAS100 is currently facing consolidation, calming down after the surge.
 ______________________________________________________________________
COMMODITIES MARKETS MONITOR
USOIL (WTI) 4-Day Chart Summary
Server Time / Timezone EEST (UTC+02:00)
Price Movement
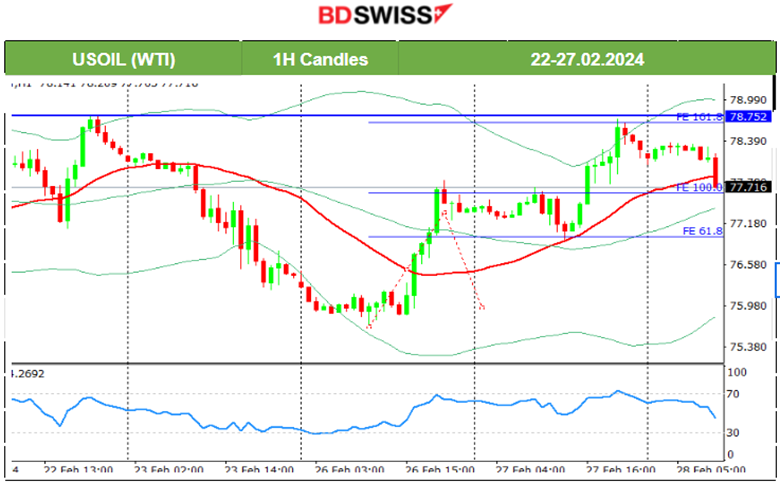
On the 23rd Feb, the price moved below the 30-period MA and dropped heavily, reaching the support near 75.85 USD/b. The retracement happened eventually on the 26th Feb, as stated in our previous report. It concluded with a full reversal to the upside. The price reached the resistance 77.80 USD/b and retraced to the 61.8 Fibo level on the 27th Feb. The price continued with an upward movement reaching the next resistance at 78.75 USD/b before retracing again to the MA. Since the precious resistance can now become a support the future price movement is more difficult to forecast based on the technicals.
 XAUUSD (Gold) 4-Day Chart Summary
Server Time / Timezone EEST (UTC+02:00)
Price Movement
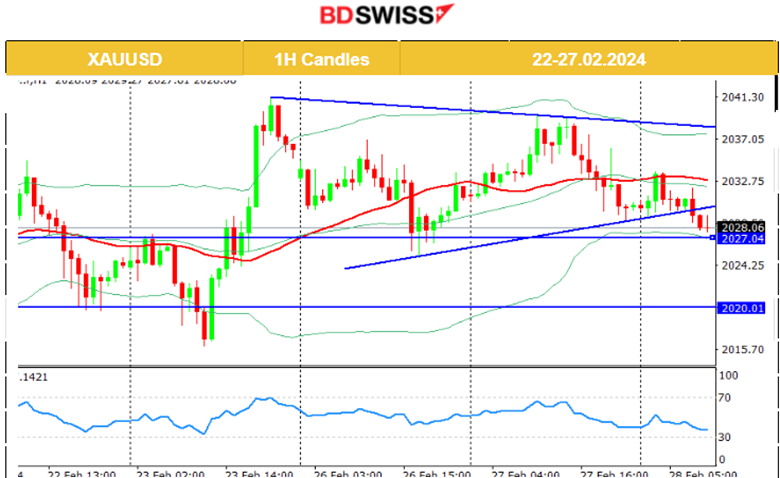
On the 23rd Feb, Gold moved to the downside, finding support at 2016 USD/oz and in a short period of time reversed significantly to the upside crossing the 30-period MA on its way up reaching the resistance at 2041 USD/oz. Since then it moved sideways around the MA, with volatility levels getting lower and lower forming a triangle. Currently, that triangle seems to have been broken to the downside as the USD is gaining strength. 2027 USD/oz seems to be the critical support at the moment.
 ______________________________________________________________
News Reports Monitor – Today Trading Day (28 Feb 2024)
Server Time / Timezone EEST (UTC+02:00)
- Midnight – Night Session (Asian)
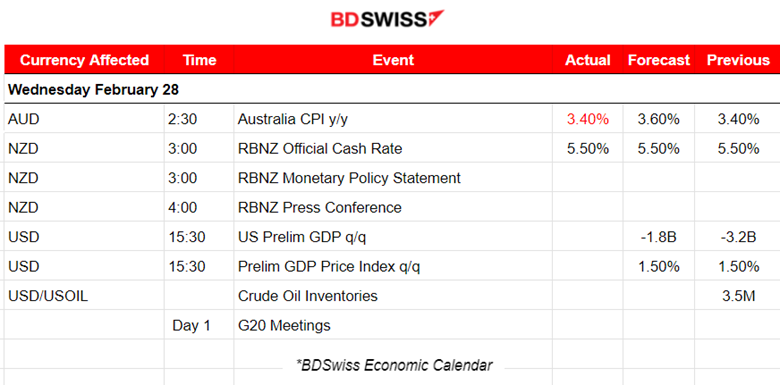
Australia’s inflation remained steady in January according to the report at 2:30 today, below economist expectations of a bounce. The market reacted with AUD depreciation but experienced only a light shock at that time. The AUDUSD only dropped significantly soon after when the USD experienced heavy appreciation.
The Reserve Bank of New Zealand (RBNZ) left the official cash rate unchanged at 5.5% and says risks to the inflation outlook are now ‘more balanced’ but there is a limit to the ability to ‘tolerate upside inflation surprises’. The NZD depreciated heavily and the NZDUSD dropped more than 70 pips since the time of the decision release reaching the support at 0.61.
- Morning – Day Session (European and N. American Session)
Canada’s preliminary GDP figure for the last quarter is going to be released at 15:30, expected to grow at a steady pace of 0.20% monthly. The CAD pairs during that time could see some more than usual moderate volatility.
General Verdict:
______________________________________________________________


