

In this Analysis, we will delve into the Daily (D) timeframe to gain a comprehensive view of the current state of EURUSD, XAUUSD, GBPUSD, USOIL, & BTCUSD for Today, 28th February, 2024.
Additionally, we will briefly touch on a fundamental factor influencing its price.
EURUSD TECHNICAL ANALYSIS: 28th FEBRUARY , 2024
PRICE ACTION:
Scenario 1 (Short): There’s a scenario where some traders might think about short positions if the value goes below 1.07257.
Scenario 2 (Long): In a different view, particularly for those more optimistic, The idea of considering long positions could come into play if the value breaks above 1.08875.
Quick Fundamental:
EURUSD is trending downward, approaching 1.0800 on Wednesday following a drop on Tuesday. The European Commission is set to publish data on Economic Sentiment Indicator, Industrial Confidence, Consumer Confidence, Services Sentiment, and Business Climate for February.
EURUSD DAILY CHART: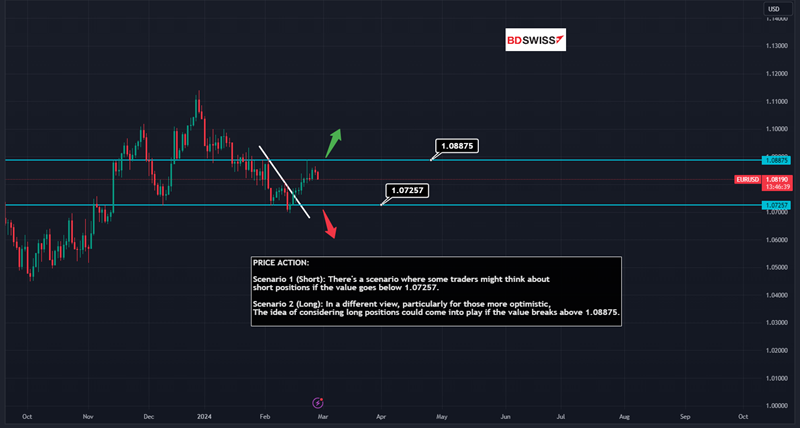 XAUUSD TECHNICAL ANALYSIS: 28th FEBRUARY, 2024
PRICE ACTION:
Scenario 1 (Short): It could be observed that there might be potential for short positions if the pivot level falls below $2010.824.
Scenario 2 (Long): In a contrasting view, there might be potential for long positions if the level rises above $2051.62, which could interest those with an optimistic outlook.
Quick Fundamental: Gold encountered resistance around the $2,040 mark on Tuesday, leading to a pullback to the vicinity of $2,030 by day’s end. On Wednesday, the XAUUSD pair was seen oscillating within a narrow band, just under the $2,030 level.
XAUUSD DAILY CHART: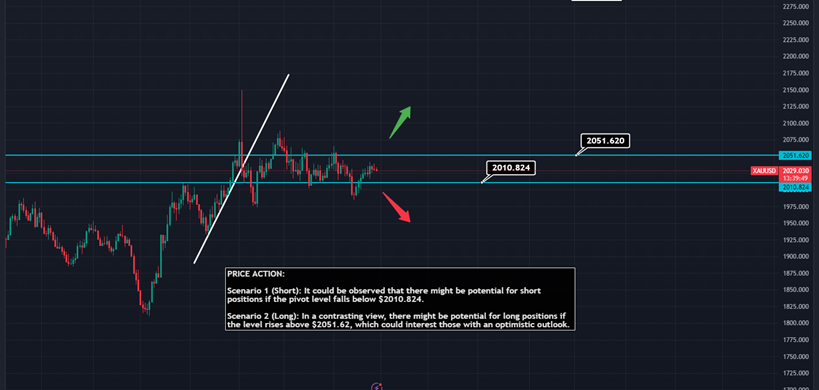 GBPUSD TECHNICAL ANALYSIS: 28th FEBRUARY, 2024
PRICE ACTION:
Scenario 1 (Short): Observationally, one might note a trend where short positions are initiated below 1.25990.
Scenario 2 (Long): From an optimistic viewpoint, it could be noted that long positions may typically start above Trendline Resistance.
Quick Fundamental:
GBPUSD slipped and fell towards 1.2650 at the beginning of the European trading session on Wednesday, after experiencing uncertain movements on Tuesday.
GBPUSD DAILY CHART: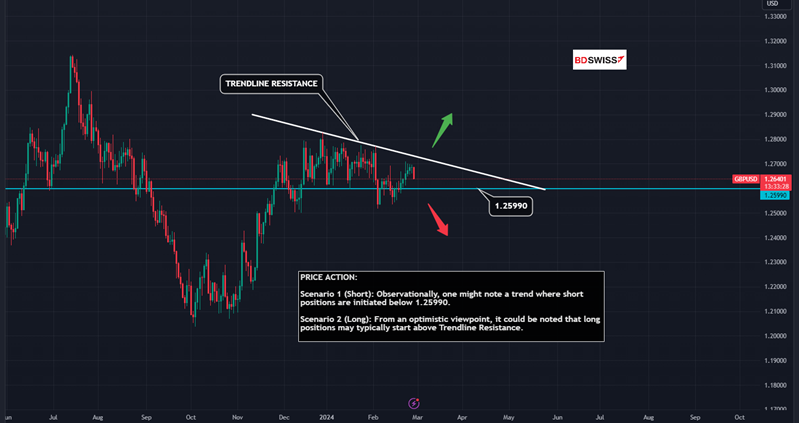 USOIL(WTI) TECHNICAL ANALYSIS: FEBRUARY 28th, 2024
PRICE ACTION:
In Scenario 1, there’s a tendency for short positions when the price falls below $76.02.
In Scenario 2, it’s often observed that long positions are considered when the price exceeds $78.72, especially among optimists.
Quick Fundamental: West Texas Intermediate (WTI) oil prices have fallen after two days of increases, with the price hovering around $78.30 per barrel in the Asian trading session on Wednesday. The decrease is attributed to challenges such as rising borrowing costs, which are negatively impacting global economic growth and, as a result, diminishing demand for oil. Additionally, there’s ongoing uncertainty about the success of ceasefire negotiations between Israel and Hamas, and Iran-supported Houthis are continuing their attacks on civilian shipping in the Red Sea.
USOIL DAILY CHART: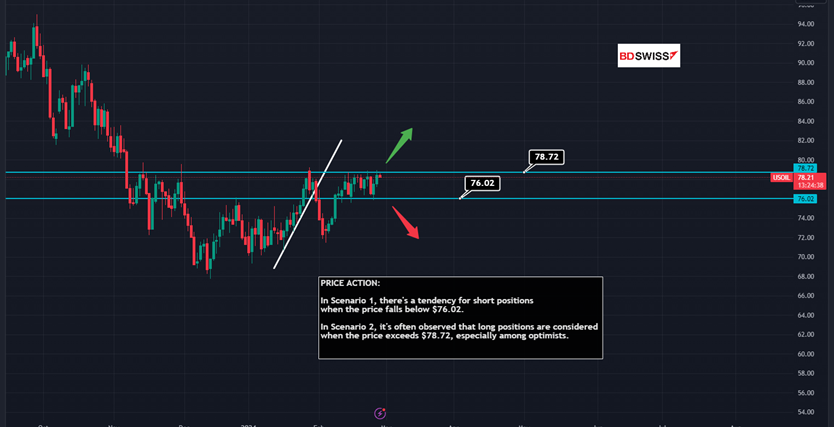 BTCUSD (BITCOIN) TECHNICAL ANALYSIS: FEBRUARY 28th, 2024
PRICE ACTION:
Scenario 1 (Short): If one were looking at potential market movements, a scenario might involve contemplating short positions if the value were to drop below $52,969.09 and break below Trendline Support.
Scenario 2 (Long): In a situation where market optimism prevails, one hypothetical approach could be to consider long positions if the value stays above Trendline Support.
Quick Fundamental:
Bitcoin’s value has surged this week, continuing the upward trend that began with the introduction of spot ETFs in January. The cryptocurrency might reach the $60,000 mark, fueled by robust demand for trading and speculation, as indicated by Glassnode. However, if Bitcoin falls below the crucial $50,000 level, it might prompt a significant sell-off, potentially dropping to $40,000. The price of Bitcoin (BTC) continues its upward trajectory, bolstered by recent reports concerning MicroStrategy and BlackRock. This trend reflects increasing market optimism and a flexible risk tolerance among investors.
BTCUSD DAILY CHART: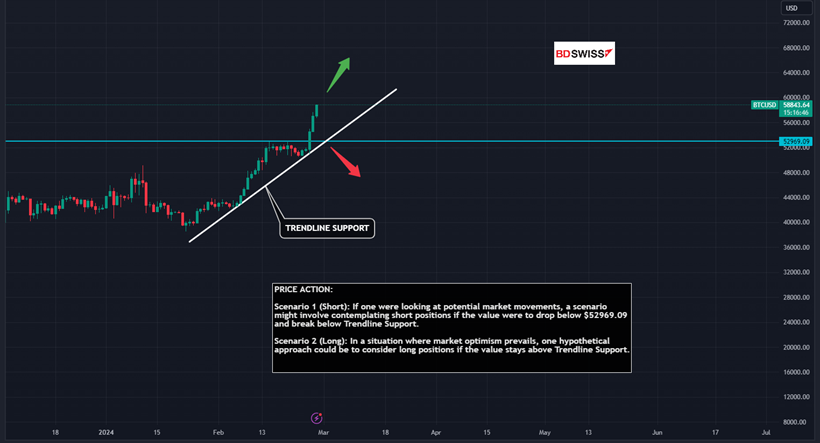
Source: Fxstreet.com | Tradingview.com


