Now that Trump is on his way out and a vaccine is on its way in, the stock market has taken off once again. Today I’d like to take a look at where there may be some value for those who are interested in getting into the market.
The main theme in the stock market recently has been a reversal of the big trend of the year: a move from the virtual world to the real world. In doing so, smaller stocks are suddenly outperforming the large-capitalization stocks as investors seek more exposure to sectors that are responsive to the normal business cycle, such as industrials and consumer discretionary.

Value stocks have started to pick up relative to growth stocks, which have far-and-away dominated so far this year.
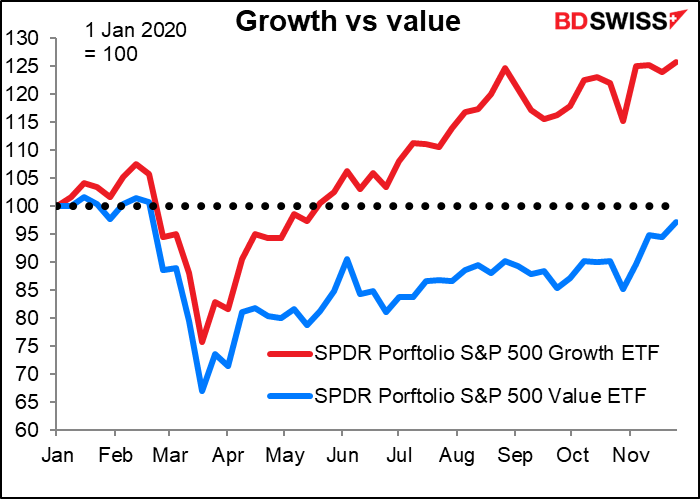
And demand for income-producing dividend stocks, as opposed to growth stocks, has jumped as well.

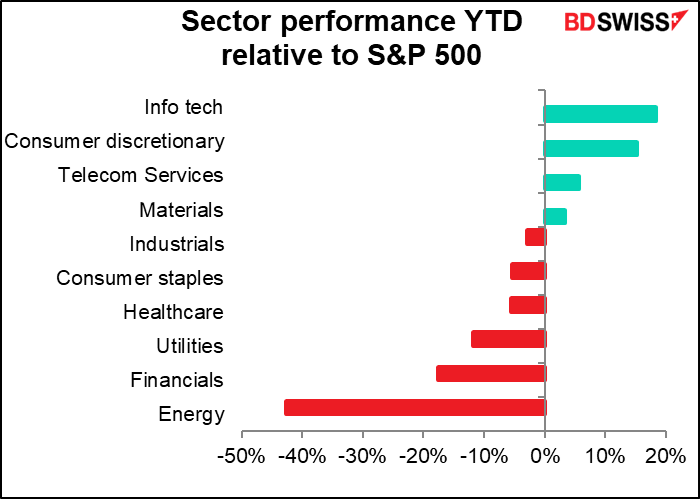
Which sectors have been performing the best?
The graph below shows the relative performance of the ten major sectors that comprise the S&P 500. This does not show the absolute performance but rather the relative performance: how that sector’s rise or fall compared to that of the S&P500 overall. Thus a sector could be up, but if it wasn’t up as much as the overall index, it would appear as a negative on this graph.
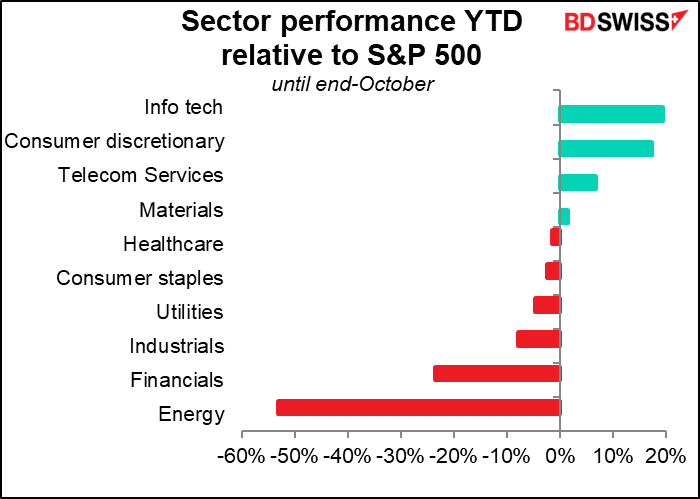
But as we all know, past performance is no guarantee of future performance. We should divide the year up into two: until end-October, before the election and the vaccine announcements, and then after.
If we look at the performance before the end of October, the graph isn’t that much different than for the year as a whole.
But if we look at it for November only, it’s very different indeed:
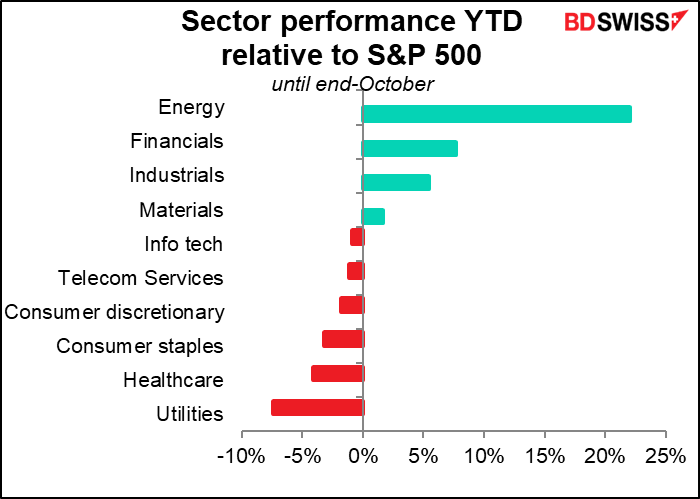
Energy, financials and industrials were the three worst-performing sectors until the end of October, in that order. Since then, they’ve been the best-performing sectors, again in that order.
We can combine the two graphs into one:
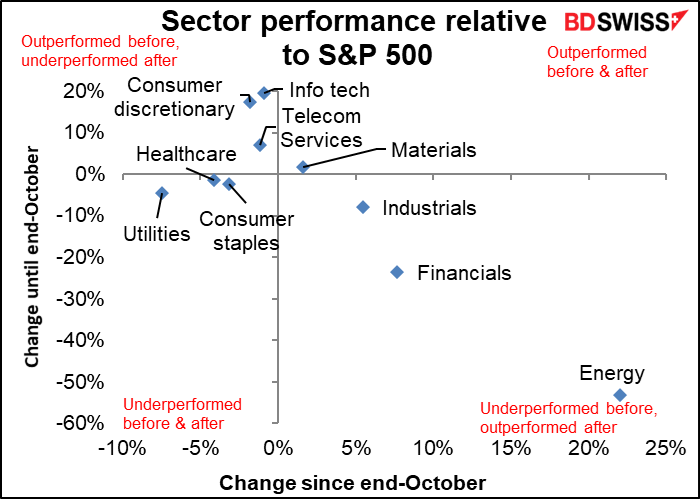
Three of the sectors that outperformed before are now underperforming (consumer discretionary, info tech, and telecom services) while three that underperformed before are now outperforming (energy, financials, and industrials). Utilities, healthcare, and consumer staples are the three sad ones that underperformed both before & after, while materials is the most consistent – it outperformed before (slightly) and is outperforming now, too (slightly). That doesn’t mean it’s the best performer, however.
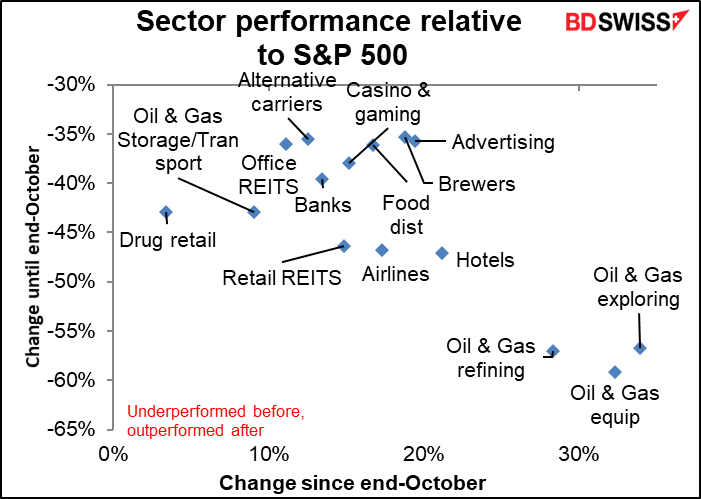
Looking at the market in finer detail, the S&P 500 is divided into 115 sub-sectors. Here are the 15 that performed the worst up until end-October, vs how they’ve performed since then. These sectors may well still have room to rebound. (I should caution you on the “drug retailers” sector, which is probably affected more by the announcement that Amazon is getting into that business than by anything else.)
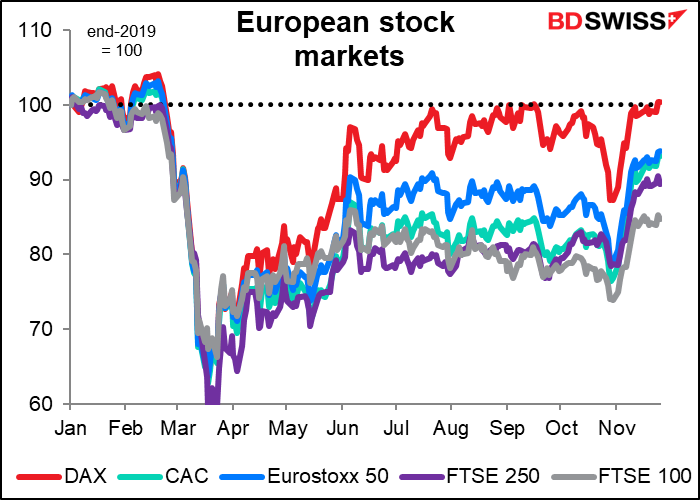
Perhaps you want to invest outside the US? Which country’s stock market is the most bombed out?

Within Europe, the German DAX has rebounded the most. That makes sense, given Germany’s high beta to international economic activity.
Note how the FTSE 100, which is mostly comprised of international companies, has underperformed the FTSE 250, which is more domestic stocks. I assume that’s because the more domestic stocks won’t be affected directly by Brexit – it doesn’t matter as much if their exports fall. I’m not sure I buy this logic, because the majors also have activities outside of the UK that will be unaffected by Brexit, but I think everyone in the country will be affected regardless of whether they export anything to the continent.
Next week’s events: OPEC+, RBA
We’re coming into the last month of the year, but activity remains high and there are a lot of risk events next week.
Oil ministers from the Organization of the Petroleum Exporting Countries (OPEC) plus other major exporters such as Russia and Kazakhstan, known as OPEC+, meet on Monday and Tuesday. They are due to decide whether to extend their current output cuts of 7.7mn barrels a day (b/d) into next year or to reduce them – that is, increase production – from the start of January by 1.9mn b/d, as was originally planned.
The consensus is that they will extend the current level of cuts, probably through Q1 of next year. The recent surge in prices has cast some doubt on that conclusion. On the other hand, OPEC’s own analysts calculate that there’s something like 1.3bn barrels more oil in storage above ground than there was at the beginning of the year, enough to meet any surge in demand. (OPEC’s current output is estimated at between 23.2mn and 24.7mn b/d.) They need to keep prices below the level that would allow North American shale producers to start pumping oil again (estimated to be $45-$55/bbl, which is almost where the market is now) but to keep it high enough to satisfy countries that are strapped for cash – as well as allowing some space for those countries that want to produce more. It’s a delicate balancing act. Keeping output at the current level is already discounted in the market; increasing it (i.e., reducing the output cuts) would probably come as a surprise and depress oil prices and oil-linked currencies, such as CAD.
At its meeting last month, the Reserve Bank of Australia (RBA) decided on a package of measures consisting of:
- A reduction in the cash rate target to 0.1% from 0.25%
- Similarly, a reduction in the target for the yield on the 3-year Australian Government bond to around 0.1% from 0.2%%
- Also a reduction in the interest rate on new drawings under the Term Funding Facility to 0.1%
- A reduction in the interest rate on Exchange Settlement balances to zero; and
- The purchase of AUD 100bn of government bonds of maturities of around 5 to 10 years over the next six months.
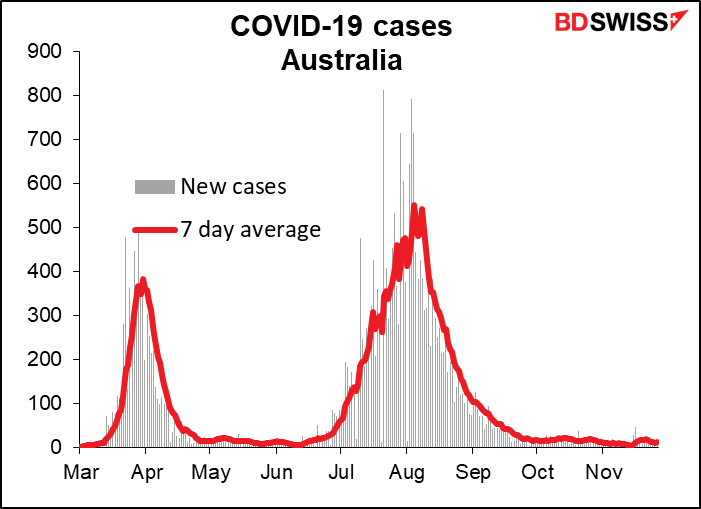
Dayenu! as we say. That’s enough for now. I don’t expect any more changes at next Tuesday’s meeting. They will probably just update everyone on how these measures are working. The market will also wait to hear how they view the new vaccines and the near-elimination of the virus in the country (down to an average of 12 new cases a day from a peak of 541 in August – this in a country of 25mn people).
As for central bankers, Fed Chair Powell appears in front of the Senate Banking Committee on Tuesday and the House Financial Services Committee on Wednesday to discuss the CARES Act. We all know what he’s going to say: give me more! Fed officials have unanimously stressed the need for continued fiscal support for the US economy, particularly as the CARES Act unemployment insurance will run out at the end of December. His pleas are bound to fall on deaf ears though as the Senate Republicans are determined to implement a “scorched earth” policy ahead of the transition, sabotaging the economy to make life as difficult as possible for the incoming Biden administration.
The talkative European Central Bank (ECB) President Lagarde speaks twice, once at some European Policy Forum on Monday and then on Tuesday at the opening of some GeoEconomics Center, part of the Atlantic Council. It doesn’t look too fascinating.
The Fed released the Beige Book on Wednesday, two weeks before its last Open Market Committee meeting of the year. While it’s entirely anecdotal, some people try to make a “Beige Book index” by counting how many times certain words appear. For example, check how many times the word “uncertain” occurs in it. That’s a good guide to the tone. It was 23 times in the last one (October) vs 27 in September, so maybe things are getting better. But then again the word appeared 24 times in April, and I’d say things were a lot more uncertain back in April.
Finally, we will have our ear to the ground listening for any news out of the Brexit talks as we get really, really down to the very thin wire. The talks are in a difficult plaice right now – with only 33 days left to go, they need to make some progress fast. EU Chief Negotiator Barnier is supposed to brief EU officials today about the fishing dispute, but it’s unclear whether he’s going to reveal a breakthrough or breakdown. It’s so stupid that the talks are stymied over an inconsequential bunch of fish while the UK just abandoned the financial industry, which accounts for somewhere north of 7% of GDP. But there you are.
Indicators: NFP, EU CPI, end-of-month Japan indicators
The big event of the week is on Friday, when we get the US nonfarm payrolls (NFP). Those have been somewhat overtaken by the weekly jobless claims, which come out every Thursday, but there still seems to be significant, if fleeting, interest in the NFP.
The market forecast is for a derisory increase of just a lousy 500k jobs, the fifth consecutive month of decrease in the number of new jobs. This compares with what will probably be some 4.6mn new cases of the COVID-19 virus during the month. So much winning! Give me a break.
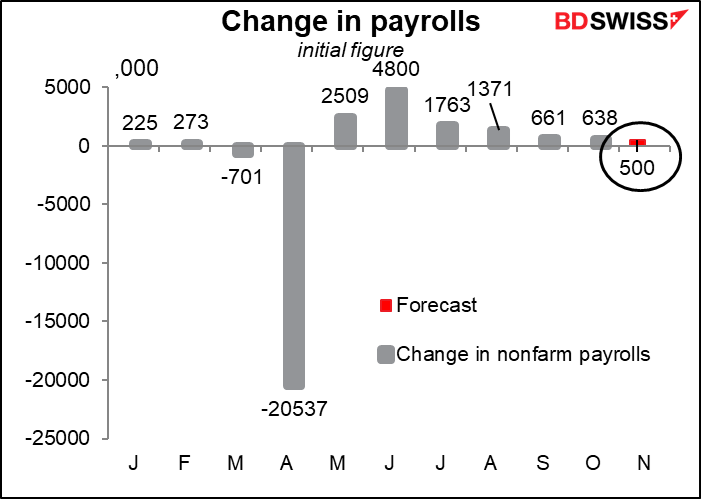
The unemployment rate is expected to fall just a tiny bit to 6.8% from 6.9%.

My guess is that these numbers would not be particularly encouraging, although given that initial jobless claims have risen for the last two weeks, they might be seen as better than the alternative: a fall in payrolls and a rise in the unemployment rate.
Wednesday as always we get the monthly estimate of the NFP figures from Automated Data Processing Inc. (ADP), another highlight although the ADP report is notoriously unreliable as a forecast of the NFP figure.
We get the final purchasing managers’ indices (PMIs) for those countries that release preliminary versions, and the one-and-only figures for those that don’t – manufacturing on Tuesday and service-sector on Thursday. With these come the Institute of Supply Management (ISM) version of the PMIs in the US, which are always closely watched, largely out of habit since the Markit versions are better gauges of the US economy (or so Markit says – you can evaluate their claim yourself. It seems convincing to me.) Meanwhile, China announces its official PMIs on Monday and the Caixin manufacturing version on Tuesday.
In Europe, Germany announces its inflation data on Monday and as day follows night, so too does the EU-wide inflation data follow the German inflation data the next day, as always. Both are expected to be up bit but to remain in deflation. No news there and no impact on the ECB, which is already planning an impressive package of easing measures that will no doubt blow your socks off when they unveil it at their next meeting on 10 December.

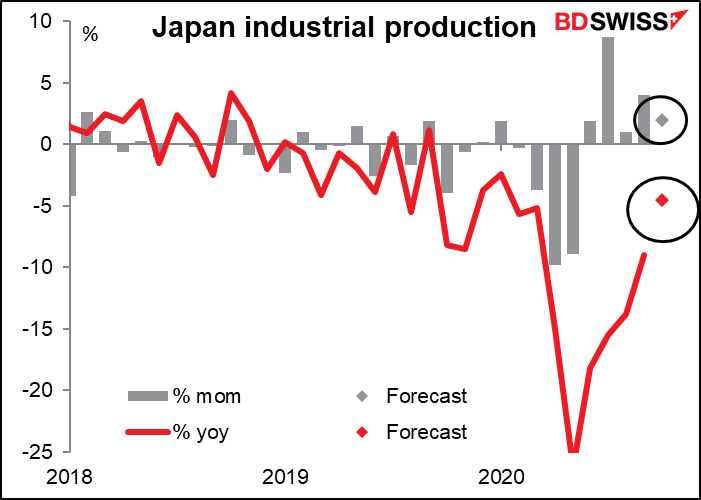
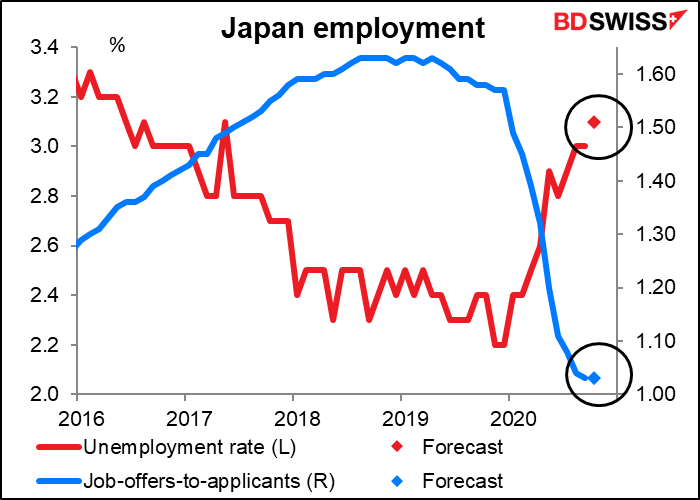
Japan as usual has its end-of-month onslaught of indicators. Monday morning it announces industrial production and retail sales, while Tuesday the employment data and capital spending (among others I don’t bother with).
Industrial production for October is expected to be up a pretty solid 2.0% mom, but that would still leave it some 6.2% below pre-pandemic levels. That’s not too bad – it’s Germany in September was 8.2% below pre-pandemic levels, while the US in October was 5.6% below. So Japan is pretty much on par for the course.
I don’t understand why Japan’s unemployment figures are so closely watched – they never change very much. The unemployment rate is expected to rise a bit to 3.1% from 3.0%, while the job-offers-to-applicants ratio is expected to be unchanged at 1.03. That’s also the same as the forecast last month. As good a guess as any, I’d say. Probably no effect on JPY.
Switzerland and Canada release their first estimates of Q3 GDP on Tuesday, while Australia releases its on Wednesday.