Rates as of 06:00 GMT
Market Recap
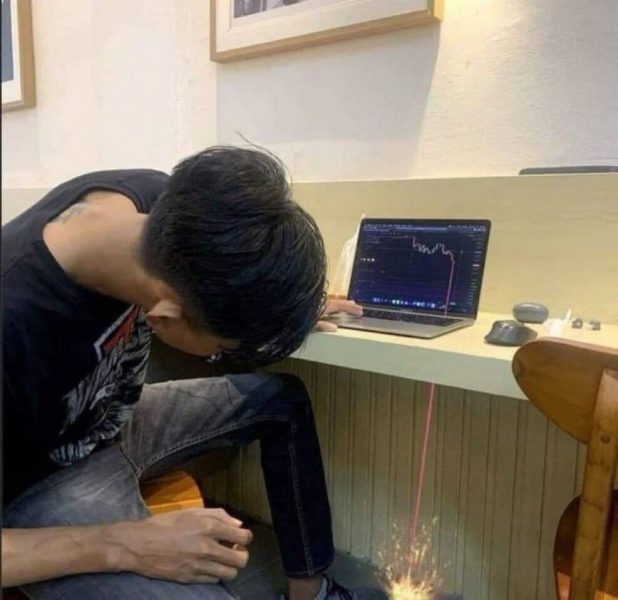
I’m sure those of you who own US equities – or any equities, for that matter – must have felt like this yesterday:
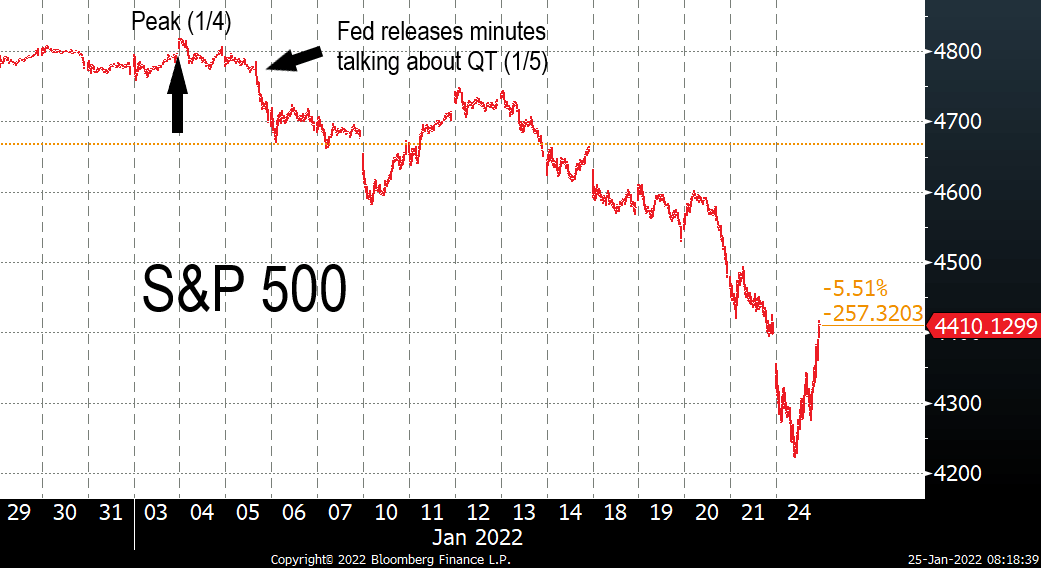
The S&P 500 was down 3.99% at one point but managed to rebound 4.44% to close up 0.28%.
Was this the kind of “selling climax” that marks the bottom for the market? While it’s true that “past performance is no guarantee of future performance,” we can get some guidance from the past. This kind of intraday volatility has only happened twice before since the NYSE started publishing high-low-close data in 1977:
16 Oct. 2008: -4.63% intraday closed +4.25%
23 Oct 2008: -4.28% intraday closed +1.26%
Was either of those days the bottom? Alas no. The bottom was nearly four months later on 9 March 2009, by which time the market had lost another 25.5%.
What caused the decline? I don’t want to depend on post hoc ergo propter hoc logic (reasoning that says because B followed A, A caused B), nonetheless it does seem significant that the peak in the S&P 500 was just one day before the minutes of the Fed meeting showed that they were already discussing quantitative tightening (QT).
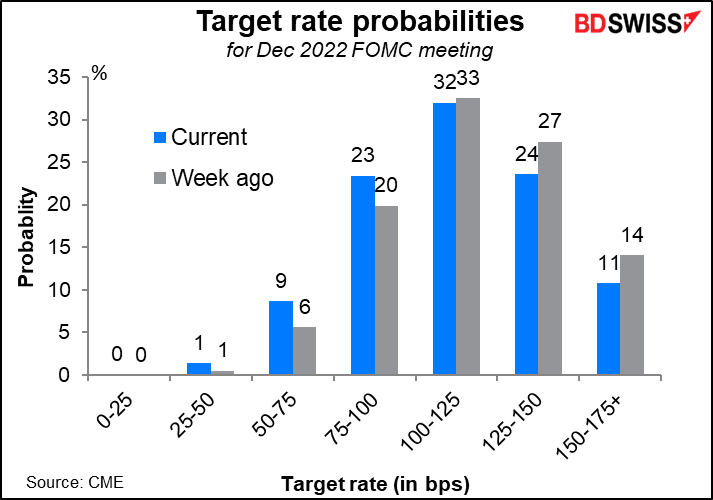
The market is reacting to – or perhaps we should say protesting – the expected tightening of monetary policy that the Fed is contemplating.
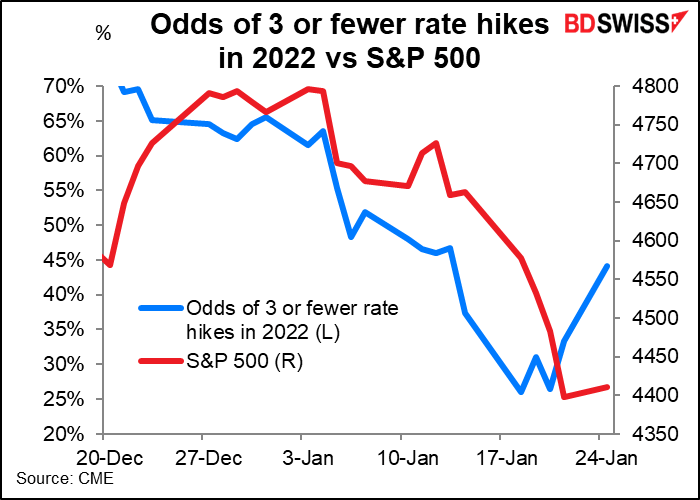
We can see how the odds of three or fewer rate hikes this year have increased compared with a week ago while the odds of five or six have fallen.
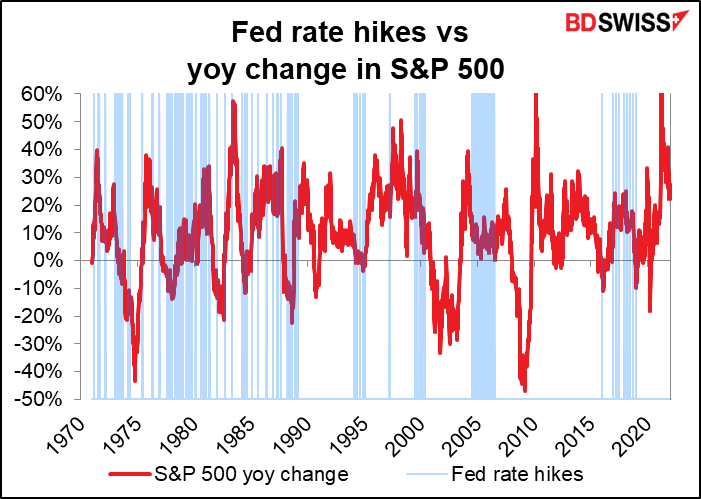
Ever since the end of the high-inflation 1980s, the Fed has tended not to hike rates when the stock market is down on a year-on-year basis. Of course the causality could run the other way – the market has risen as long as the Fed doesn’t hike rates.
The independent researcher David Rosenberg noted on Twitter that “Only once in the 10 bear markets in the Russell 2000 did the Fed dare to tighten into the drawdown and that was late 2018. Oops. [The Fed had to start cutting rates the following year.] What’s interesting is that the next move is either a pause or a policy easing — in all 10! Could the rates cycle be over before it even begins??
The Russell 2000 is in effect the opposite of the S&P 500 – it’s an index of 2,000 small-cap stocks. At its lows yesterday it was down 15.6%. A “bear market” is defined as down 20% or more.
So yesterday’s and of course today’s stock market action sets up a problem for the Fed at their meeting, which begins today. Do they go ahead and tighten and risk a plunge in the stock market, with all that that implies for the consumption-driven US economy? Or do they hold back a bit and allow the politically damaging inflation to run longer? Or maybe they can hope that the fall in the stock market helps to dampen inflation and allows them to avoid tightening so much.
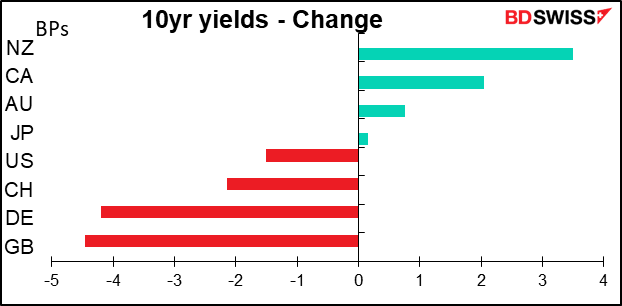
Nonetheless, bond yields were surprisingly little changed.
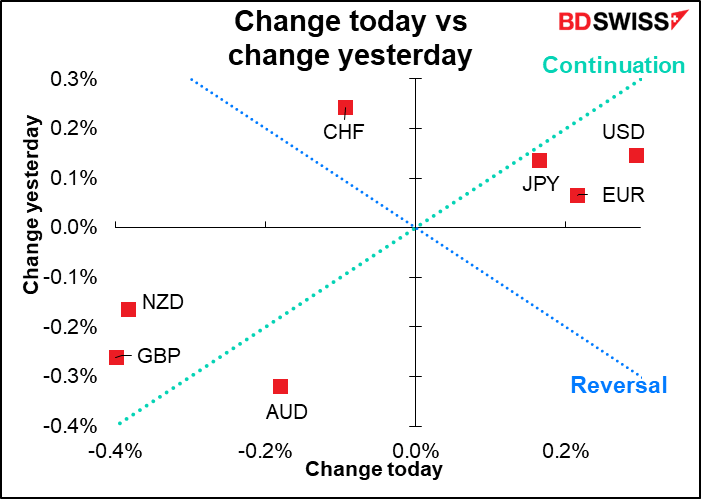
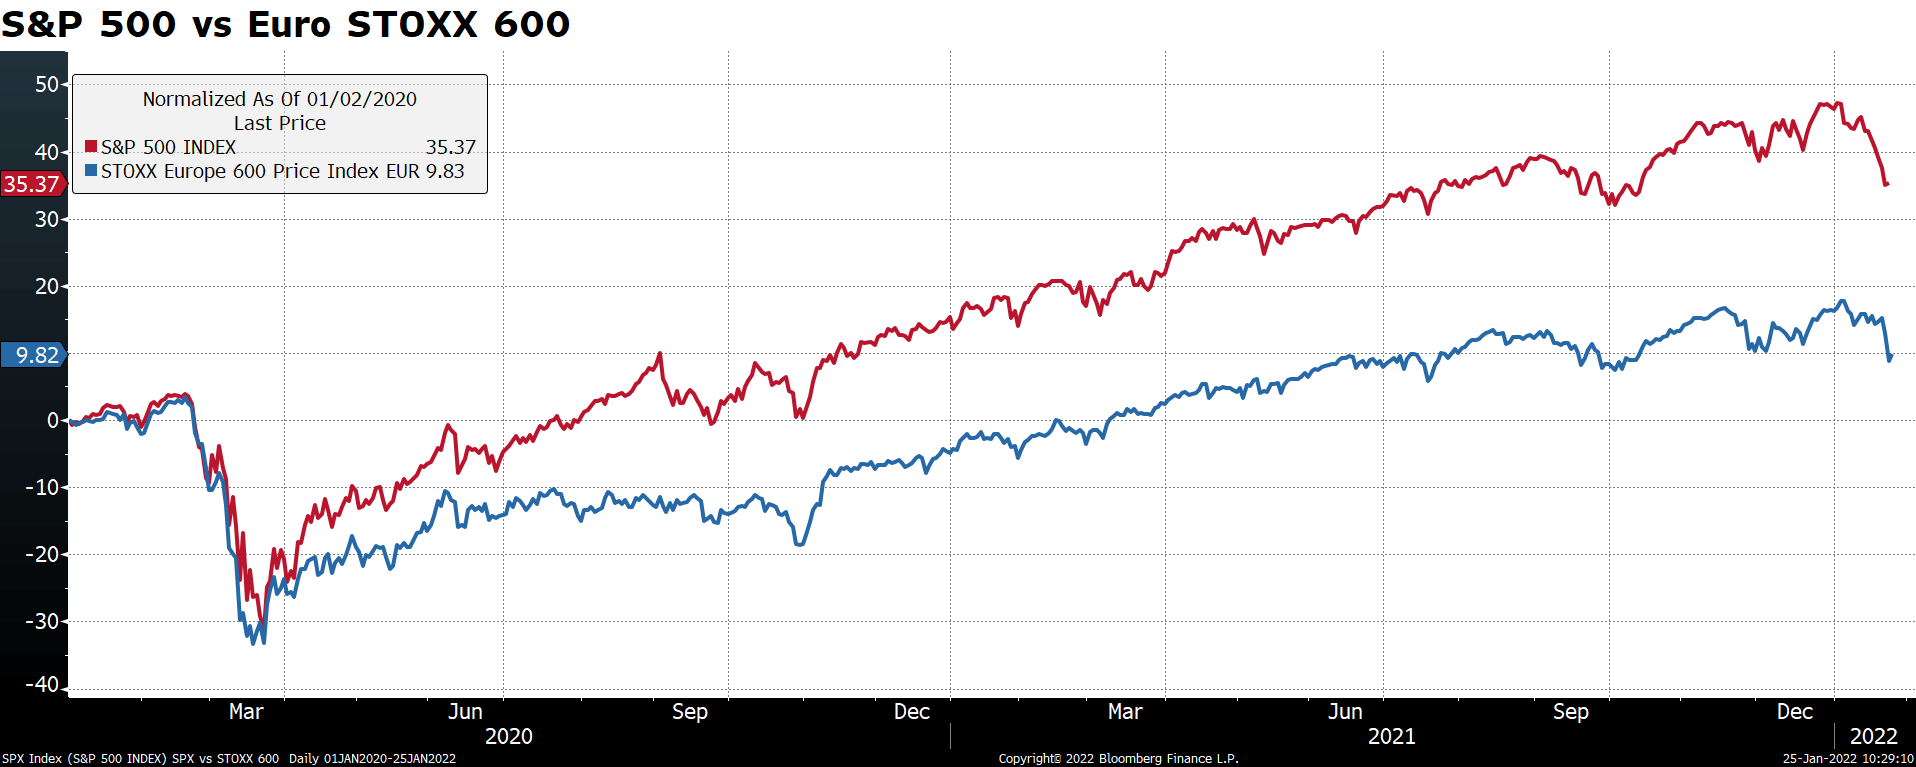
The fact that USD was the best-performing currency even as tightening expectations were pared back shows the dollar’s role as the ultimate safe-haven currency. EUR’s good performance though is a bit harder to explain – perhaps people think that since the European Central Bank isn’t planning on tightening this year anyway, European economies – and maybe European stocks – will do better than the US. Although the experience over the last two years has been quite different.
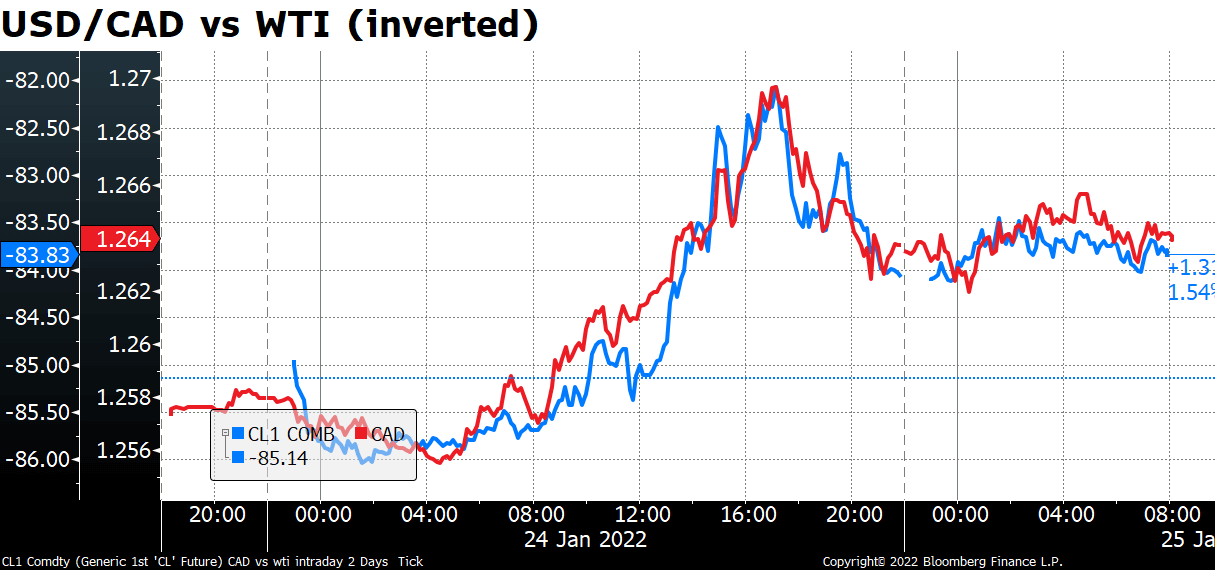
It’s no surprise in this risk-off mood that the commodity currencies fell. The fall in CAD was directly related to the movement in oil, although rate speculation has been trimmed back a bit. Expectations for the Bank of Canada’s deposit rate in December fell to 1.60% this morning from 1.64% yesterday and 1.74% a week ago.
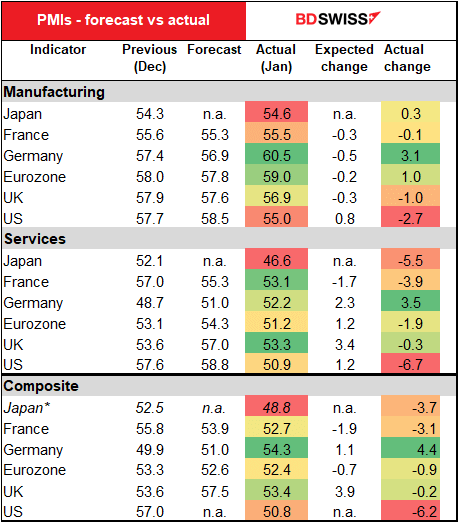
I was planning on discussing yesterday’s preliminary purchasing managers’ indices (PMIs) but they’re not as relevant to the markets anymore – it’s risk sentiment that matters. Still, the unexpected plunge in both the US manufacturing & service-sector indices was noticeable, as well as the fact that the Eurozone did worse than expected even though Germany did much better than expected. Someplace isn’t doing very well at all, apparently. The UK also did much worse than expected. Perhaps these figures will temper central banks’ urgency to tighten policy.
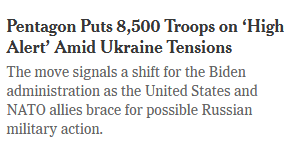
One imponderable: what is the role of increasing tensions in Europe on the markets? It’s hard to separate the factors. I’d say though that the fact that CHF fell yesterday (EUR/CHF rose) on such a risk-off day and when headlines about US troops on “high alert” are popping up indicates that concerns about war on the European continent are not what’s driving the risk-off sentiment.
Today’s market
Note: The table above is updated before publication with the latest consensus forecasts. However, the text & charts are prepared ahead of time. Therefore there can be discrepancies between the forecasts given in the table above and in the text & charts.
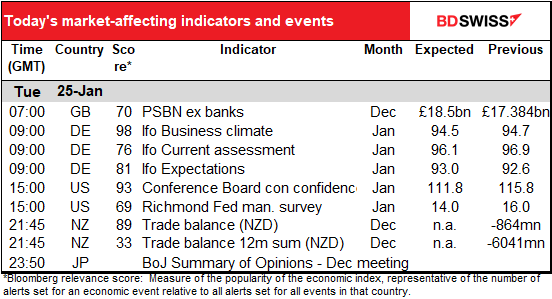
UK public sector borrowing is expected to rise, reflecting increased spending on vaccines and testing, plus some seasonal effects. However, looking at the 12m moving average, it’s forecast to continue on its downtrend. Not sure if this really affects GBP nowadays though.

Germany’s Ifo index is forecast to be down a bit. The expectations index is forecast to rise a bit, but the current situation is expected to fall by more.
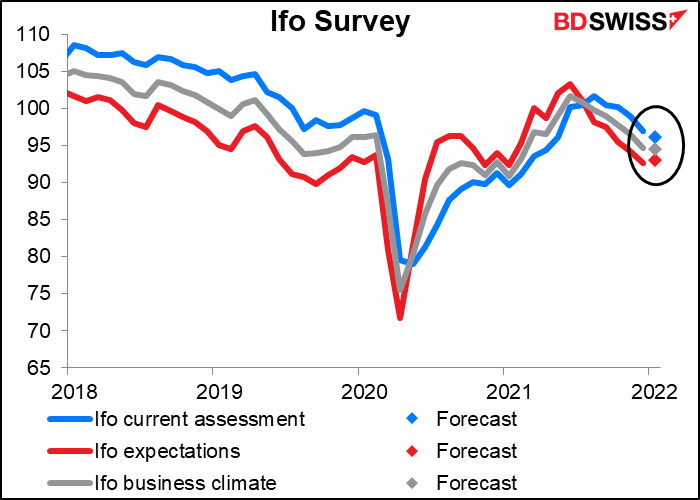
The difference between the two is forecast to narrow though. In any event, after yesterday’s better-than-expected German PMIs, we could be in for an upward surprise.

In the US, the Conference Board consumer confidence index is expected to fall. No surprise given the resurgent virus and the falling stock market, not to mention the 0.8-point fall in the U of Michigan consumer sentiment index for the month.
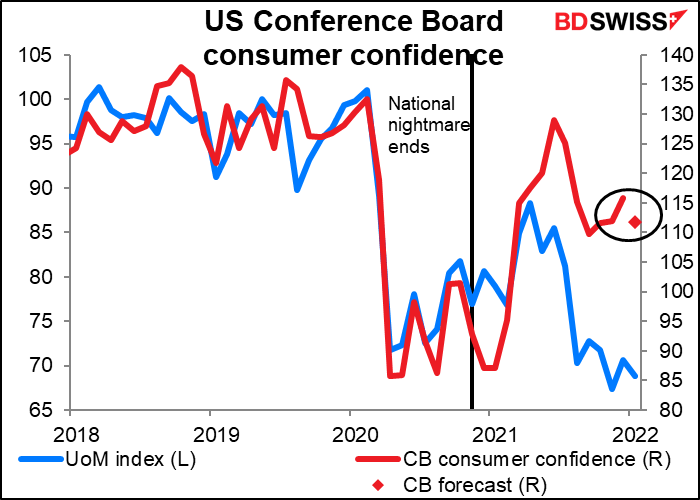
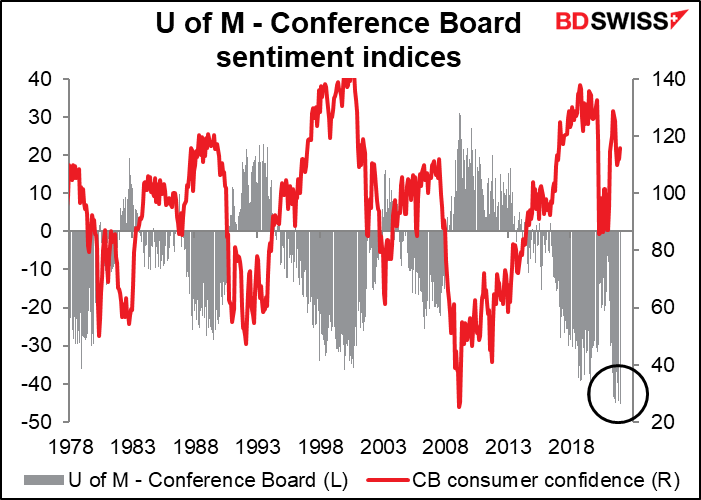
There’s now a record gap between the two indices, probably because the questions the two surveys ask have a different focus. The Conference Board’s questions place a greater emphasis on employment and labor market conditions while the U of M’s survey emphasizes individual household finances. As a result, the Conference Board survey more generally reflects consumer feelings towards the overall economy while the U of M survey reflects consumer perceptions of their own personal circumstances. The labor market remains quite healthy, but the falling stock market and rising inflation are impinging on peoples’ views of their financial situation (me too!)
The Richmond Fed survey is expected to be down a small 2 points to come into line with the average of the Empire State & Philadelphia Fed surveys, which was down a sharp 12.4 points to 11.25 (Empire State -32.6, Philly Fed +7.8). I think a small decline in this would be positive for USD after the sharp plunge in the Empire State index as it would reassure markets that the US economy is still on a growth path.
The market puts more weight on the Empire State and Philly Fed indices than on the Richmond survey, probably because they come out earlier. However the Richmond Fed survey is the one that best predicts the Institute of Supply Management (ISM) purchasing managers’ index (PMI), according to my research. The ISM is one of the most important monthly indicators and so I pay close attention to the Richmond Fed index.

Then we fundamental traders can take it easy a bit until the Asian day starts and New Zealand announces its trade data. Unfortunately Bloomberg no longer announces a consensus forecast for this, but here’s a graph anyway. The trend is not good.

Exports are increasing, but just not at the same pace as imports. Unfortunately I only have value indices for these two, not volume, so I can’t see whether this is due to the country importing more or just higher prices on what it is importing (as is the case in Japan). Looking at the breakdown of the 21% yoy increase in imports (using a 12m moving sum), vehicles account for 6.5 percentage points (ppt), meaning that NZ too has been caught out by the worldwide increase in auto prices. Mechanical equipment and machinery account for 2.7 ppt, electrical machinery & equipment 1.6 ppt, and iron & steel 1.2 ppt, and pharmaceutical products, 0.7 ppt.of the increase. Surprisingly, petroleum products only account for 0.5 ppt and fertilizer 0.4 ppt.

The Bank of Japan releases the Summary of Opinions from its Jan. 18th meeting. I haven’t paid much attention to this in recent years because usually the Monetary Policy Board’s opinion was “let’s do whatever Gov. Kuroda says,” with the exception of one or two obstreperous dissenters who were generally ignored. Now however there do seem to be genuine differences of opinion on the Board so we have another bit of bumpf to look at eight times a year.
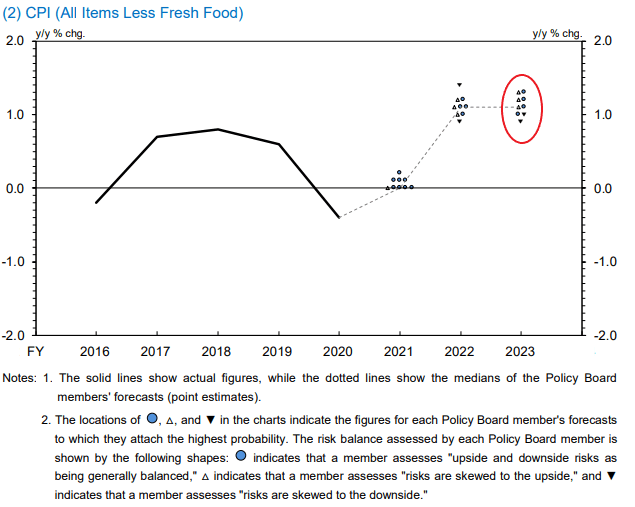
At the meeting, the BoJ kept its policy & forward guidance unchanged, in contrast to what some usually well-informed observers – aka me – expected (I was looking for some change in their forward guidance). However they did raise their economic and inflation forecasts as expected (which is why I thought they might change their forward guidance, too). Gov. Kuroda said at the press conference that the current “increase” in inflation in Japan (barely noticeable on an international scale)) is transient and the 2% inflation target remains far away. Nonetheless three of the nine Policy Board members saw a risk of higher inflation for FY2023 in their “dot plot” in the Bank’s quarterly Outlook for Economic Activity and Prices, vs only two who saw downside risks. (The BoJ’s inflation “dot plot” not only gives the rate of inflation that Members see, but also indicates the risks that they see: an upward-facing triangle means the risks are to the upside, a downward-facing triangle means the risks are to the downside, and a circle means the risks are balanced.) Investors will therefore scrutinize the Summary for any signs of a rift in views between Gov. Kuroda and his usually deferential acolytes.