")

Rates as of 05:00 GMT
Market Recap
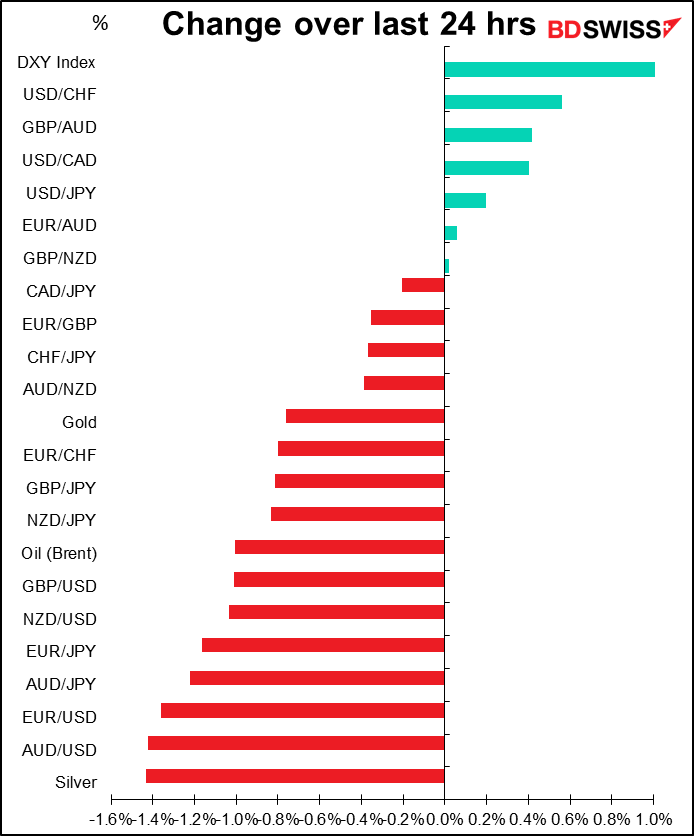
Financial markets were dominated by “risk-off” sentiment yesterday but without a clear catalyst. One can point to many factors. Four particularly stand out: 1) concerns over Russia cutting off gas supplies to Europe; 2) concerns over the recrudescence (how I love that word!) of COVID-19 in China; 4) worries about tomorrow’s US consumer price index and the impact that it might have on Fed policy and the dollar; and 4) the start of the Q2 US earnings season.
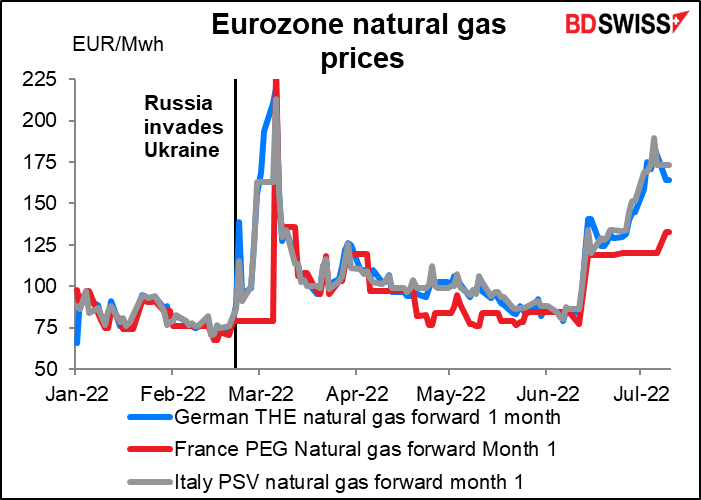
European gas: The Nord Stream pipeline is undergoing scheduled 10-day maintenance. True, German natural gas futures fell 8.3% yesterday on last week’s news that Canada would return a turbine for the Nord Stream pipeline that was being repaired (there had been fears that sanctions would prevent its return). Nonetheless it will take some time to reinstall it. And even when that’s done, there are still concerns about whether the pipeline will be turned back on again after the maintenance is over. Moreover, French Finance Minister Bruno Le Maire said that the French government is preparing for a total cutoff of Russian gas supplies, which it sees as the most likely scenario. This is bad enough for France, which gets only 17% of its natural gas from Russia, but what about Germany? French natural gas prices, which have lagged behind other European markets, rose 11%.
In China, “Multiple Chinese cities are adopting fresh COVID-19 curbs, from business halts to lockdowns, to rein in new infections, with the commercial hub of Shanghai bracing for another mass testing effort after finding a highly-transmissible Omicron subvariant,” according to Reuters. If China resumes its “zero tolerance” policy and locks down many industrial hubs again it will have a ripple effect throughout supply chains. Fears of another widespread lockdown in China have hit oil prices today.
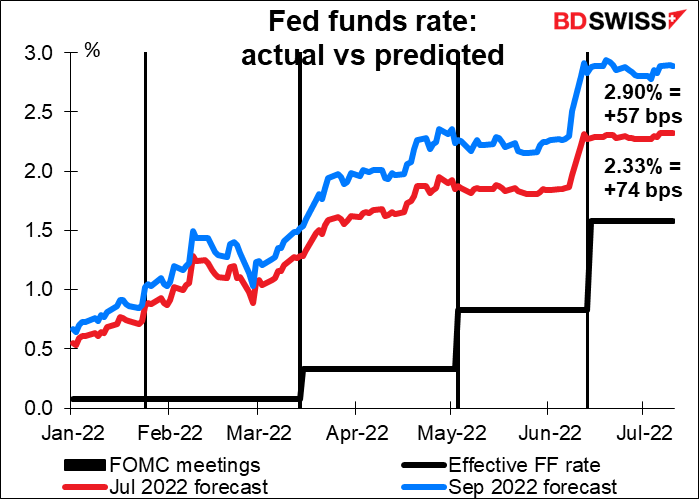
As for Wednesday’s US CPI, market expectations for the July and September Fed rate hikes keep creeping up as investors anticipate a further rise in inflation.
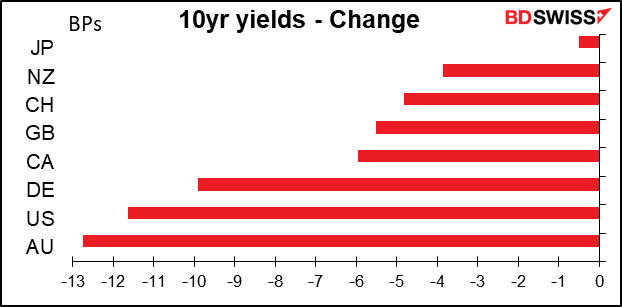
As the market discounted greater tightening, bond yields around the world came down.
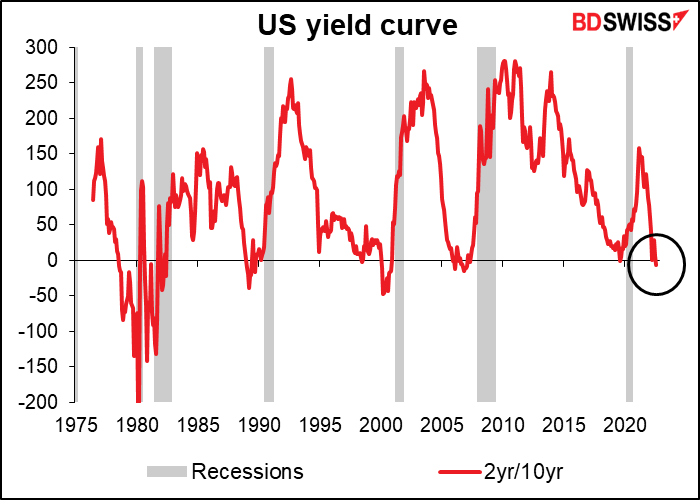
As long-term rates came down, the US yield curve further inverted, signaling the market’s increasing concern about a recession. It’s been inverted for about a week now.
This may be one reason why stocks on both sides of the Atlantic fell yesterday. Asian markets continue weak today. Dissecting the move in US stocks, it was a classic “risk-off” rotation: only utilities and real estate gained (the latter just barely). On the other hand, tech stocks led the declines, with the S&P 500 off 1.2%, the NASDAQ down 2.3%, and the FANG+ index of 10 mega-cap tech stocks off 4.5%.
As the market revises up its expectations for Fed tightening, the contrast with the European Central Bank (ECB) – which hasn’t even started its tightening cycle yet – becomes more pronounced. This is one reason why EUR/USD is sitting at parity nowadays.

I think unless the ECB starts to show a lot more concern about inflation or the war in Ukraine takes a major turn, EUR/USD is likely to be headed lower still.
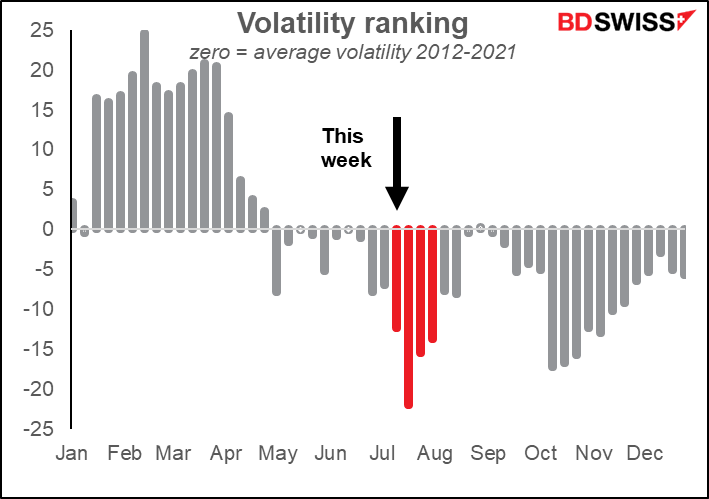
Looking at the chart at the bottom, the volatility in EUR/USD is amazing – two standard deviations away from the norm. It’s particularly amazing when you consider that we are now entering into what’s usually the least volatile time of the year. What I did was to range the volatility of currencies for each week from the most volatile (100) to the least volatile (0) of the year. I then took the average for 2012-2021. If volatility were distributed randomly, over time each week should have an average ranking of around 50. The graph shows the divergence from 50. Weeks with positive bars have been more volatile than average, those with negative bars are less volatile. This time of year is normally about the least volatile, but not this year!
Today’s market
Note: The table above is updated before publication with the latest consensus forecasts. However, the text & charts are prepared ahead of time. Therefore there can be discrepancies between the forecasts given in the table above and in the text & charts.
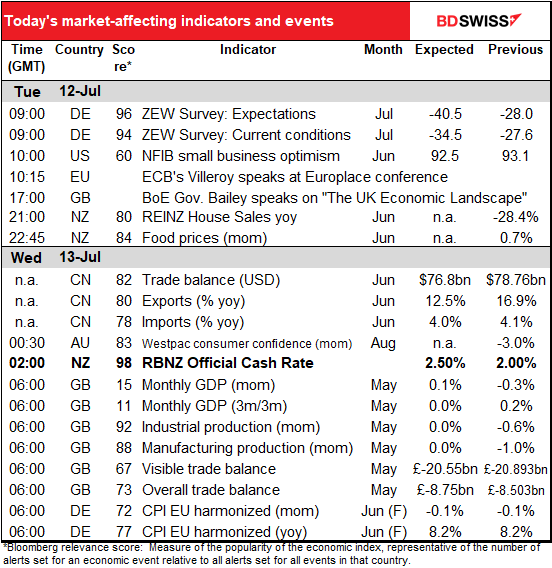
Not that thrilling a day ahead. Most of the excitement will occur overnight when the Reserve Bank of New Zealand (RBNZ) Monetary Policy Committee meets and then a few hours later, the “UK short-term indicator day” will bombard us with UK data before we’ve even gotten out of our pajamas.
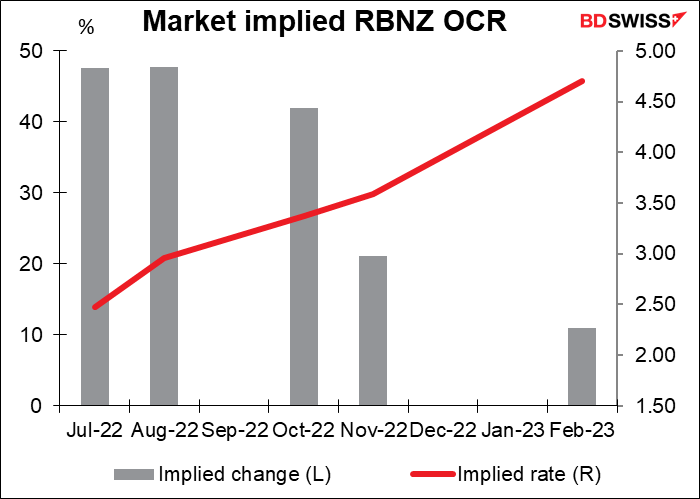
The market unanimously looks for a 50 bps hike in the RBNZ’s official cash rate (OCR) (18 out of 18 estimates in Bloomberg, plus the pricing of the overnight index swaps). Accordingly, anything outside of that would be a major shock, particularly as this is an interim meeting and therefore won’t be accompanied by any updated forecasts for inflation or growth.
The risk is that they tone down their statement somewhat as some of the recent data on economic activity has been on the soft side (EG building permits -8.5% mom in May, house sales -28.4% yoy in June, consumer confidence -2.2% in June, etc). A softer tone could reduce expectations for 50 bps hikes at the October and November meetings and dampen sentiment toward NZD.
Also, it’s not on the schedule but EU ministers are due to pass the final three legal acts required for Croatia to become the 20th member to adopt the euro.
Also in New York today is “Manhattanhenge,” the day when the sun sets in perfect alignment with the borough’s east-west numbered streets.

As for the indicators, I’ll deal with them in chronological order.
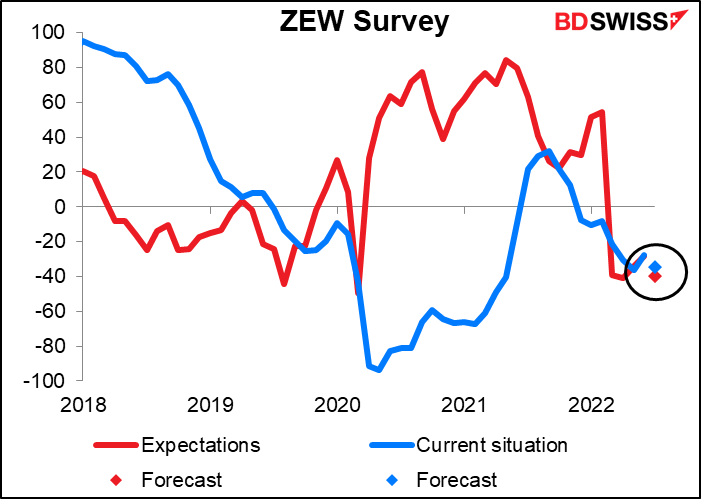
The ZEW survey of analysts, economists, and other parasites making a living telling people why they were wrong last month but you should believe them this month, is expected to show a further deterioration in sentiment. Both the current situation and the expectations indices are expected to fall, with expectations falling below the current situation, meaning that not only are things getting worse but also they’re expected to get even worser. This could be negative for the euro.
Bank of England Gov. Bailey will speak on “The UK Economic Landscape.” You can register for the event here if you want to listen or read the text here.
Not much else during the European or US days.
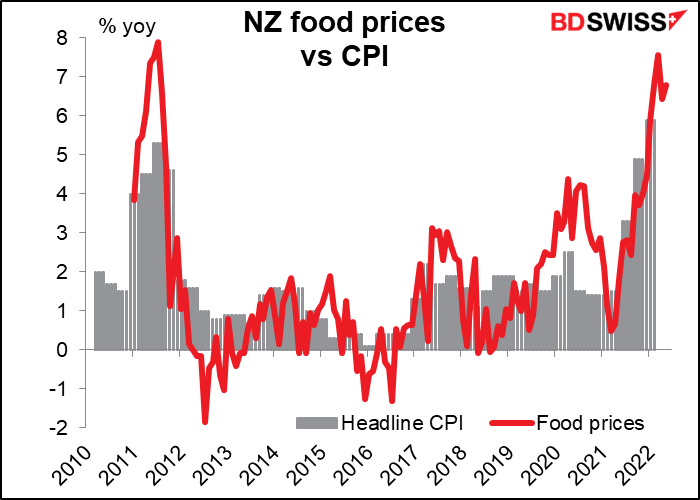
A bit before the RBNZ meets, New Zealand releases its food prices. This indicator has a surprisingly high Bloomberg relevance score although no forecasts. Experts in the field say people watch it because the government issues inflation-linked bonds and food prices are a big part of inflation. The inflation data only comes out quarterly so this monthly series is the best up-to-date estimate of NZ inflation available, flawed though it may be.
Then we get China trade data. The trade surplus is expected to rise a tiny bit as imports fall slightly and exports fall even more (on a percentage basis). The overall trade figure is nice but what matters for other countries is imports. The small decline seems to me to be hardly worth talking about so perhaps it’ll be neutral for the commodity currencies.

Then…Wednesday morning at 7 o’clock as the day begins..the UK has “short-term indicator day,” featuring the monthly GDP, industrial and manufacturing production, and trade data.
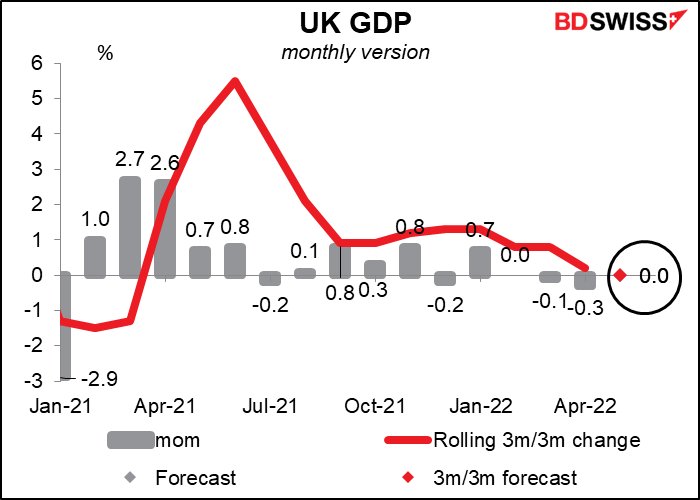
The most important of these is the monthly GDP data. The market expects no growth in GDP month-on-month and no growth 3m/3m, either (which is why there’s only one dot visible in the chart). Weak sentiment, falling export orders, and lower household consumption (particularly for services) as higher inflation squeezes incomes is likely to offset any boost from stronger construction data.
The figures are even weaker than they look because of the Jubilee holiday. That caused the late May bank holiday (usually the last Monday in May) to be shifted into June (a two-day holiday instead, Thursday and Friday, 2nd and 3rd), hence there was one more working day than usual in May and two fewer working days in June. The data are not adjusted for working days, meaning that the May figure is artificially inflated (and the June figure will be artificially depressed).
The GDP figures should highlight the conundrum that the Bank of England finds itself in: the fight against inflation could send the economy into recession. So far though the Monetary Policy Committee (MPC) members don’t seem dissuaded. Although they said after their last meeting that any future moves “will reflect the Committee’s assessment of the economic outlook and inflationary pressures,” meaning that they do take the economic outlook into consideration, they were clear which way their responsibility lies: “The Committee will be particularly alert to indications of more persistent inflationary pressures, and will if necessary act forcefully in response.” I don’t think this figure would be bad enough to dissuade them from hiking further. The next MPC announcement is on Aug. 4th so this will be the last GDP figure they get before that meeting.
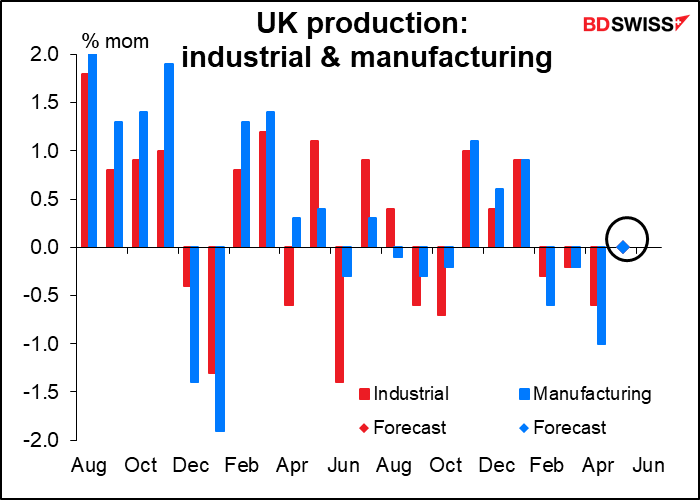
Industrial and manufacturing production are both expected to be unchanged on a month-on-month basis, in line with the expected GDP figure.
The trade figures are expected to be essentially unchanged. Looking at the six-month moving average though it does seem as if the trend is for a wider trade deficit, belying the promises that the Brexit supporters made.