Rates as of 04:00 GMT
Market Recap
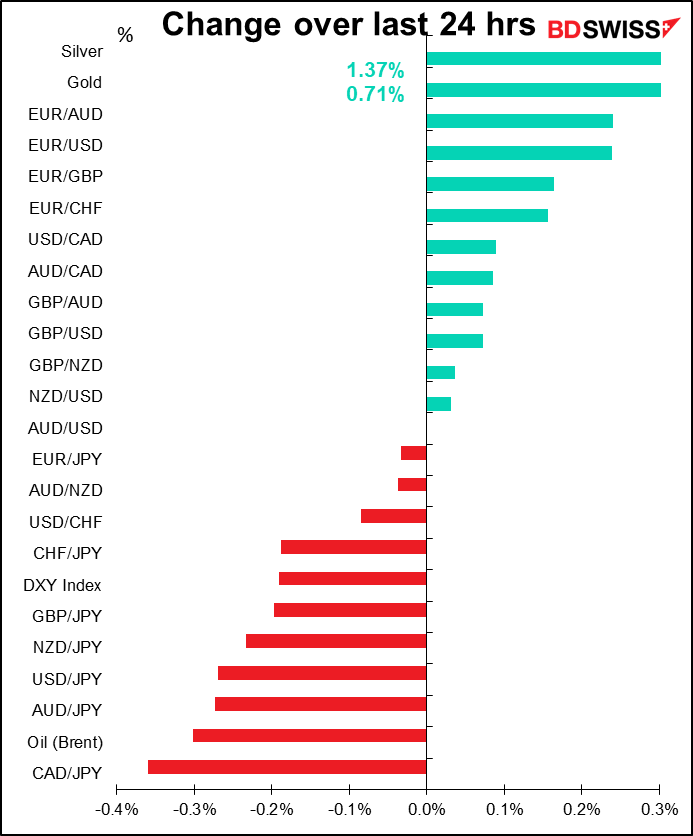
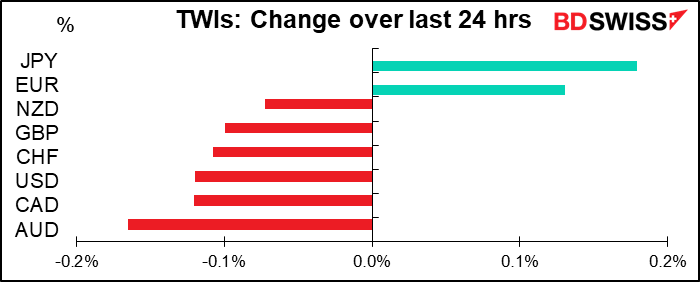
I’ve rarely seen such a narrow trading range on a day. The major trade-weighted indices were all within a ±0.2% trading range. That’s barely even worth discussing – just Brownian Motion in the FX market.
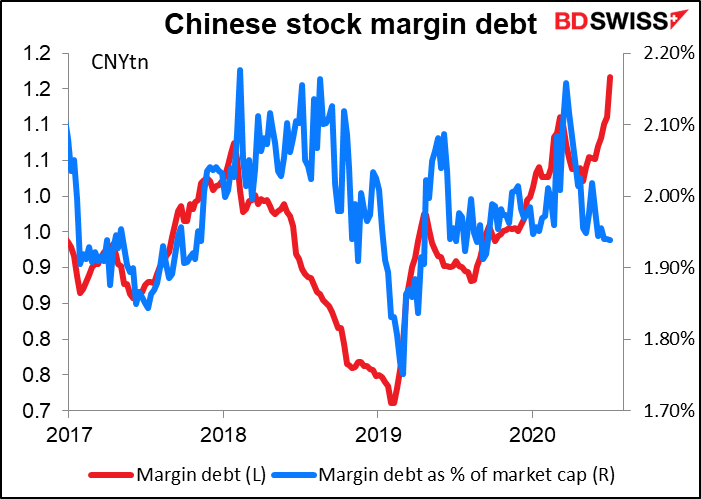
Not so elsewhere in the financial world. The big story overnight was the “melt-up” in Chinese stocks, which I mentioned briefly yesterday. The Shanghai Composite index had its best day in 5 years, closing up 5.7%. Margin debt in China has hit the highest level since the bursting of the 2015 mega-bubble.
However, the activity in China wasn’t mirrored in the US. Although the NASDAQ hit a new record high and the S&P 500 rose for the fifth consecutive day – the first time since December – most of that activity was right at the opening. After opening 43 points or 1.4% higher, the index traded in a 27-point (0.9%) range all day. That’s about half the 55-point average daily range over the last month.
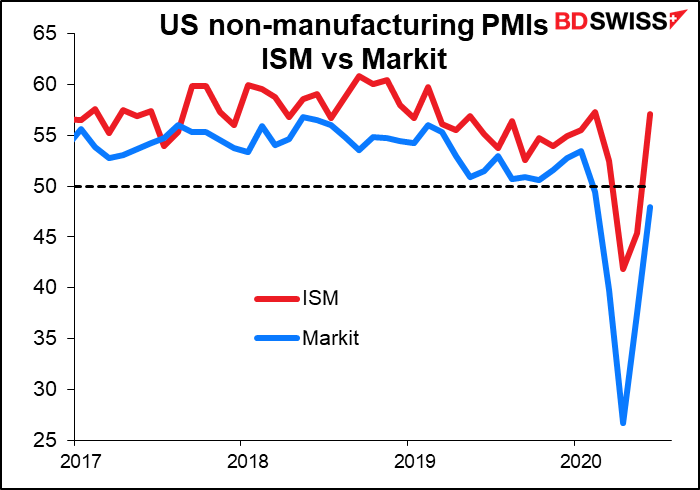
The US economic news was good: the Markit US June service-sector purchasing managers’ index (PMI) was revised up and 15 minutes later, the Institute of Supply Management (ISM) version of that index came out with a record 11.7-points jump to a whopping 57.1, just 0.2 point shy of the high for the year, set in February.
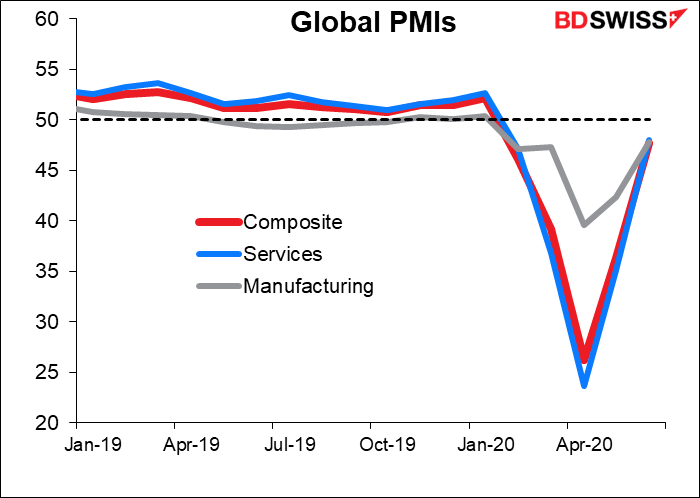
The revision to the US data brought the global services and composite PMIs back to their highest level since January. The predictions of a V-shaped recovery appear to have been correct – so far at least.
The question then is, why was the general movement in FX – modest though it was – in a “risk-off” direction? My guess is that it’s concern over the virus creeping in once again. There was talk that Australia’s second-largest state, Victoria, might have to go into lockdown. And while China reported no new infections for the first time in nearly a month, other places are seeing a rising pace of new cases, raising fears about the dreaded “second wave.”
The rates above were taken before the release of the Reserve Bank of Australia (RBA) rate decision. There was little change afterward, however. The RBA reiterated its previous cautiously optimistic view and made no change in its policy stance. It said “the worst of the global economic contraction has now passed…” and “the downturn has been less severe than earlier expected.” “Despite this, the outlook remains uncertain and the recovery is expected to be bumpy…” it noted. The last paragraph, the one with the forward guidance, was unchanged from the previous month..
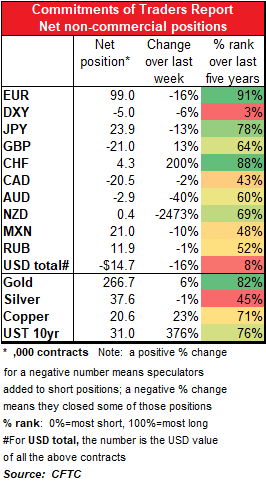
Commitments of Traders (CoT) report
Due to the 4th of July holiday last week, Friday’s CoT report was delayed until Monday.
The theme of the CoT report was cutting risk. Most currency positions were cut, whether long or short, the exception being short GBP.
Although speculators continued to bail out from the DXY index, they also reduced their overall long position in currencies (short USD). Most of that came through a large decrease in long EUR, plus a decrease in long JPY and an increase in short GBP.
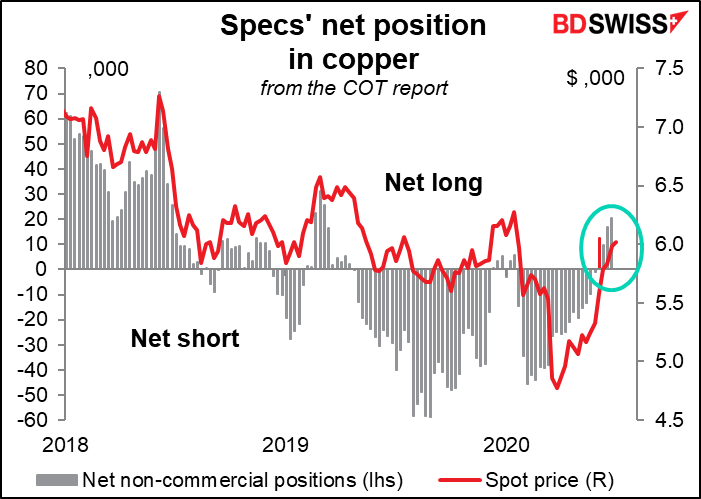
Long copper positions continued to rise, a sign of confidence in the recovery. Copper prices recently high a five-month high.
Today’s market
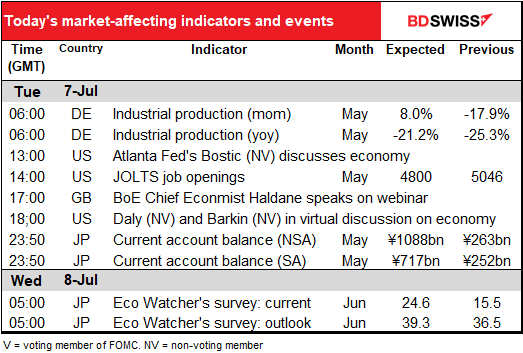
German industrial production is already out by now, I’m sure, so no point talking about that just so you can be reminded of how utterly wrong I was. (It was +7.8% mom, missing expectations of +11.1%. Yesterday’s German factory orders also missed.)
Not much else going on during the European day.
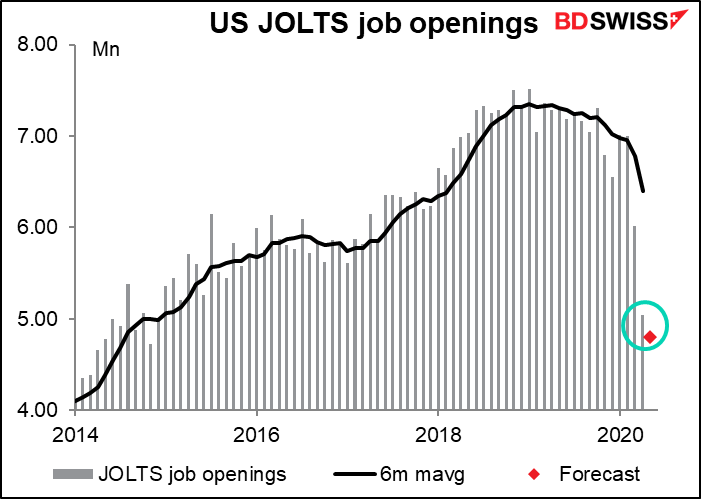
When the US opens for business, we get the mostly-ignored JOLTS report – Job Offers and Labor Turnover Survey. This was big stuff when Janet Yellen was heading up the Fed, as she used it as a major indicator of labor market tightness (or not). Since then it’s slipped back into a fair measure of obscurity. Especially now with millions and millions of people unemployed, the details that this indicator offers on why they left their jobs etc. is sort of a quibble. The market is expecting a further drop in the number of jobs, back to a level last seen in 2014 – when of course the US labor force was a lot smaller, too.
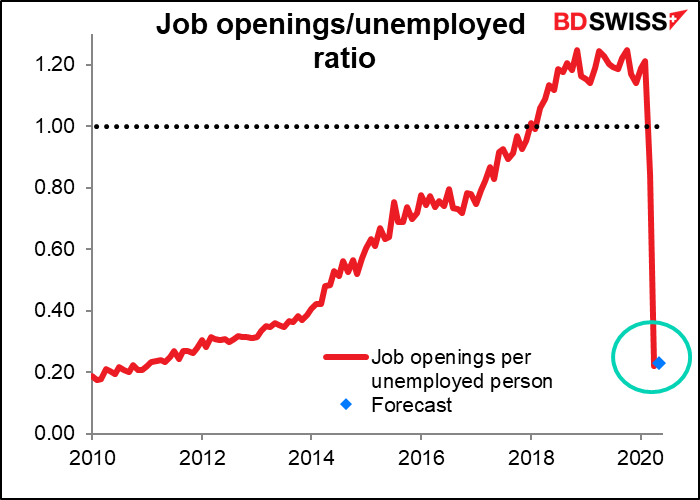
That would leave the job openings per unemployed person – my own version of Japan’s job-offers-to-applicants ratio – at about the same level in the previous month. The 0.23 ratio is hardly unheard of though, so perhaps things aren’t quite as desperate as we think. Still, back to 2014 levels is no great accomplishment, considering that the US was still recovering from the Global Financial Crisis then.
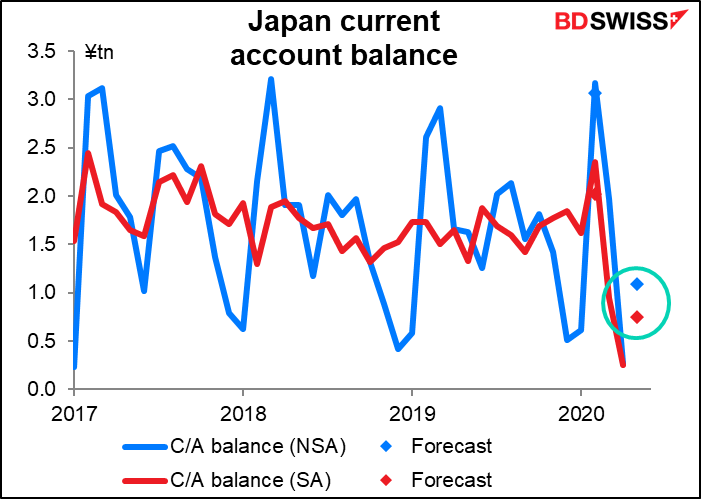
Overnight, Japan releases its current account. The current account surplus is expected to be modestly higher. That’s fairly good, considering how exports have been plunging (-28% yoy). I’m not sure whether it will be a significant-enough difference to boost the yen however.
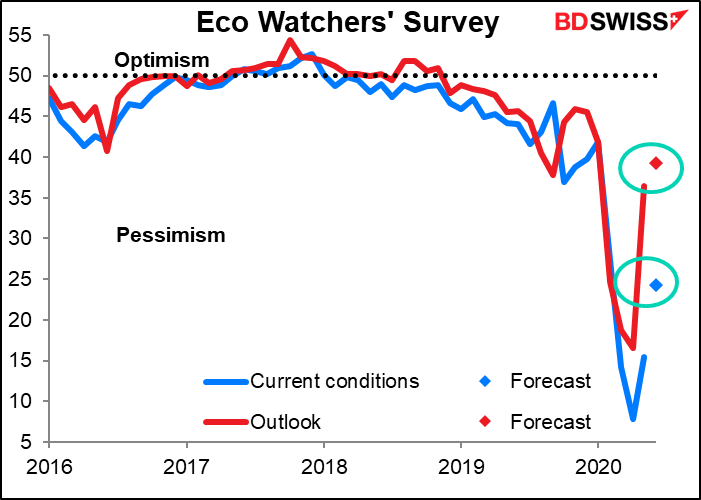
Then later in the Tokyo day we get the Eco Watcher’s Survey. This one normally doesn’t get much attention. Bloomberg quantifies the attention that various indicators get, using as a metric the percent (I assume it’s percent; please correct me if I’m wrong) of people who have asked for alerts on that country’s indicators who have an alert on that particular indicator. For the NSA version of the current account balance above, it’s 94.7. For the Eco Watcher’s current situation index, it’s 7.4. IE, almost no one. So why am I bothering to write about it? Because I get paid by the word? No, it’s because everyone wants to know how the service sector is doing right now, and this indicator seems to be a bit more sensitive to changing conditions than the service-sector PMI (which by the way has a “market attention score” of 70).
Both current conditions and expectations are expected to improve, but current conditions are expected to remain in a critical area.