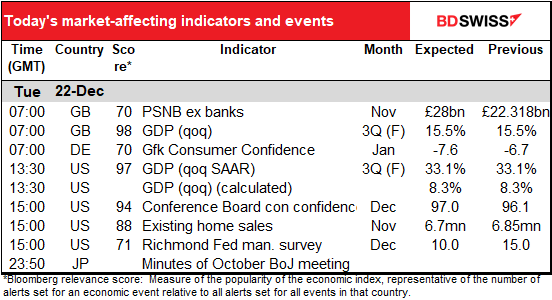
Note: The table above is updated before publication with the latest consensus forecasts. However, the text & charts are prepared ahead of time. Therefore there can be discrepancies between the forecasts given in the table above and in the text & charts.
Rates as of 05:00 GMT
Market Recap
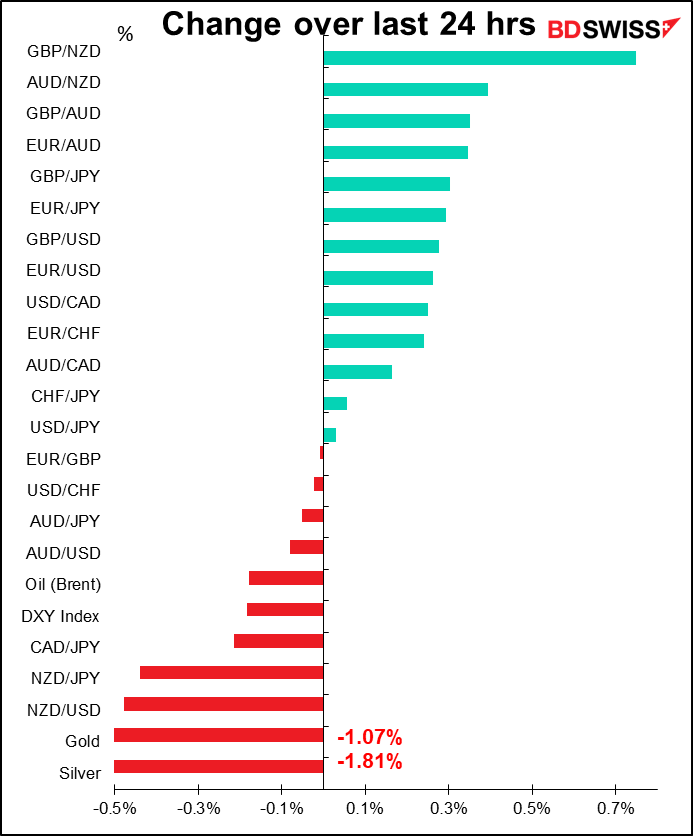
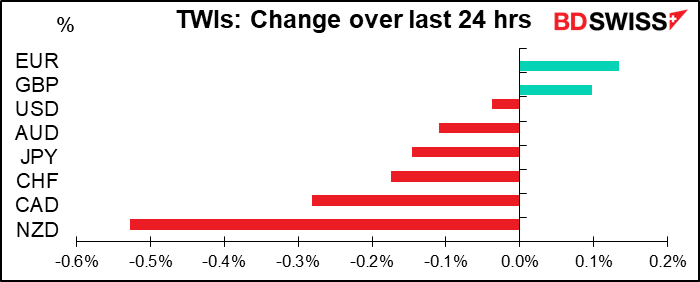
I’m always mystified when I see a chart like that above – how can six currencies go down and only two go up? And how can the “downs” go down by so much more than the “ups” go up? It seems to be a mathematical impossibility. It must be that the trade-weighted indices include more currencies than are in the table – eg China, for example.
Moreover, today’s FX market movements don’t show the usual “risk-on” or “risk-off” pattern – JPY and CHF are down along with the commodity currencies.
Yet yesterday was a big “risk-off” day. It was a tug-of-war for sentiment between two bits of news: the passage of the long-awaited and much-doubted fiscal package in the US on the one hand (risk-on) and the news of a more virulent mutant strain of the virus in the UK (risk-off). The latter clearly won. One indication: the STOXX Europe 600 index plunged 2.33% as European countries cut off their connections with the UK. The US stock market (S&P 500) was down almost 2% at one point but made a fairly good recovery during the day to close down only 0.39%. But the carry-through has been largely negative this morning and almost all Asian stock markets are lower, except Thailand for some reason. The S&P 500 is indicated to open down around 0.7%.
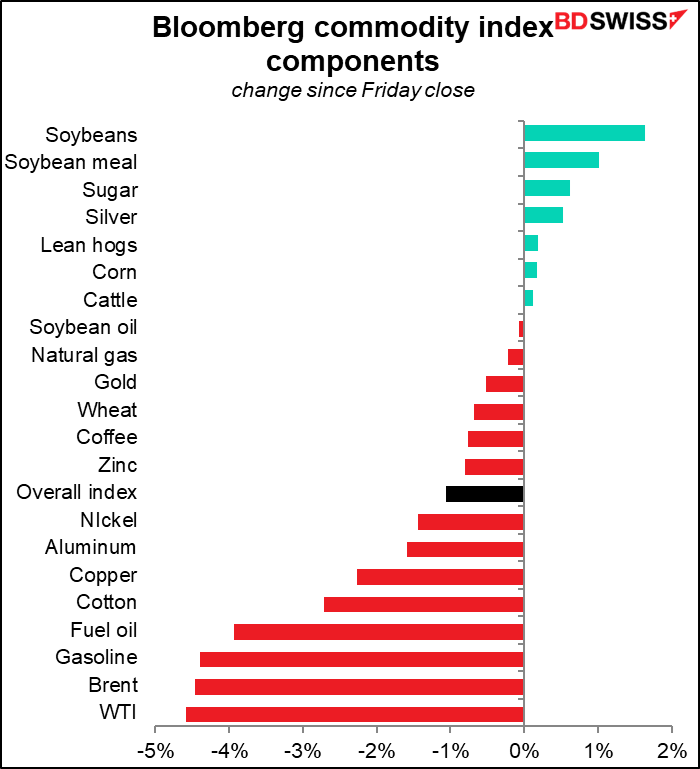
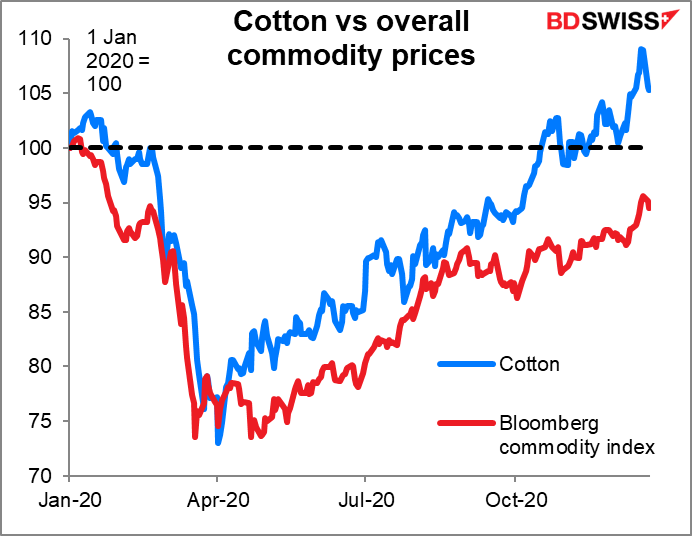
Note the decline in industrial commodities yesterday – first is energy, as more lockdowns mean less moving around. Then comes the industrial metals. (The fall in the price of cotton, the odd man out in this list, was attributed to the lockdown too – my guess is that people buy fewer clothes when they’re staying home. See the New Yorker cover below.)
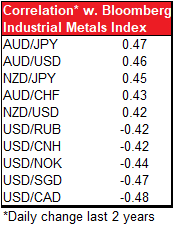
Here’s a chart of the the currency pairs that have been the most highly correlated with the Bloomberg industrial metals index on a daily basis over the last two years. The highest ones are mostly some combination of the commodity currencies (AUD, NZD, CAD) vs the safe-haven currencies (JPY, CHF). USD/JPY is fairly low on the list however (correlation of only 0.11).
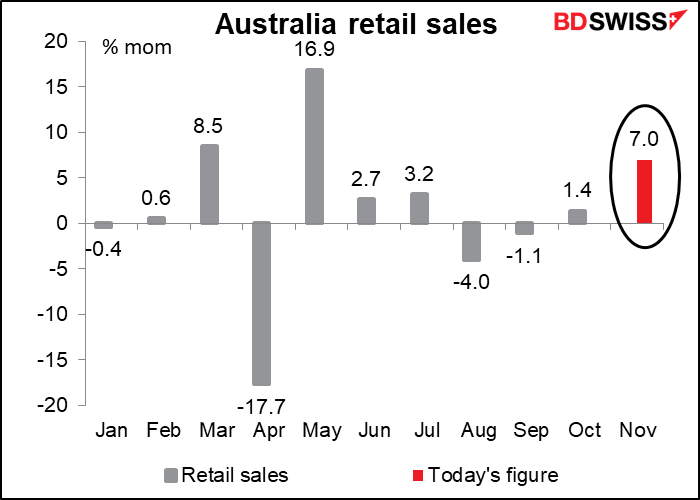
Although in theory AUD’s higher correlation with global activity should’ve made AUD/NZD decline today, it went up after Australian retail sales massively beat expectations – up 7.0% mom vs +2.0% expected. This was the fastest growth since the big rebound in May. My guess for the big decline in NZD then is just people buying AUD/NZD on good news for AUD, not necessarily because of any negative news for NZD. Someone in the market may also have been defending an AUD/NZD option strike price.
The pair is starting to come down now however. I think it could retrace further during today’s trading.
Why cotton prices are falling too:

As for GBP, PM Boorish Johnson made yet another final, this-is-it, never-again-to-be-repeated offer on fish. He’s now suggesting the EU reduce the value of the fish it catches in UK waters by about a third, down from the 60% cut it insisted on last week. The EU is demanding no more than a 25% reduction, up from its previous offer of 18%. So will they settle for 29%? Tune in later!
Today’s market
Another relatively slow day today.
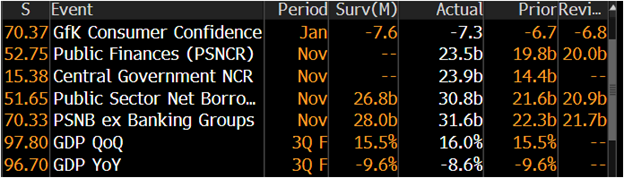
Yesterday we briefly discussed – and dismissed – the UK public sector net borrowing (PBNB) excluding banking groups, the 3rd revision of UK Q3 GDP, and the German Gfk consumer confidence index. Besides, I never get up early enough to get this comment out before the early-bird UK indicators are out. As you can see, the GDP figures weren’t significantly revised.
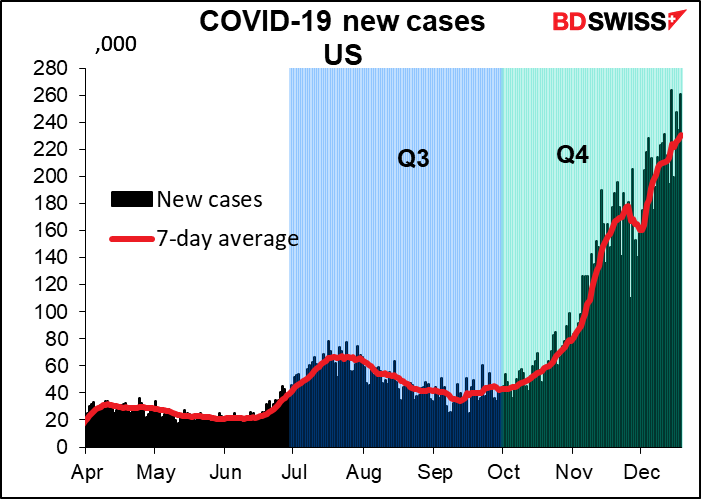
Next up is the equally boring third-and-final revision of US Q3 GDP. It’s probably not going to be revised very much, and even if it is, frankly who cares? It’s ancient history by now. The business cycle is dominated by the pandemic, meaning that Q3 has no predictive power for telling us how Q4 is likely to turn out. With the pandemic being so much worse in Q4 than it was in Q3, there’s no question but that the economy is going to be affected.
So that leaves us with US Conference Board consumer confidence, which I similarly doubt is going to shake the FX market to its very roots.
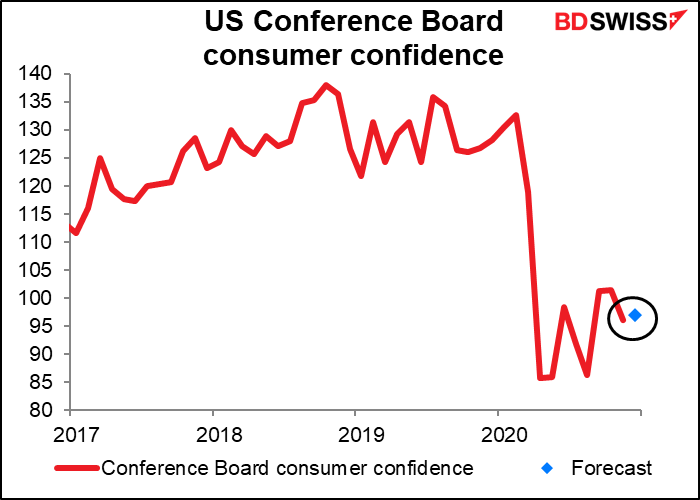
Why consumer confidence has been so steady while the world has been going through such cataclysmic changes is beyond me, but it seems to be a general international trend. After the initial plunge back in the spring, it’s been pretty steady.
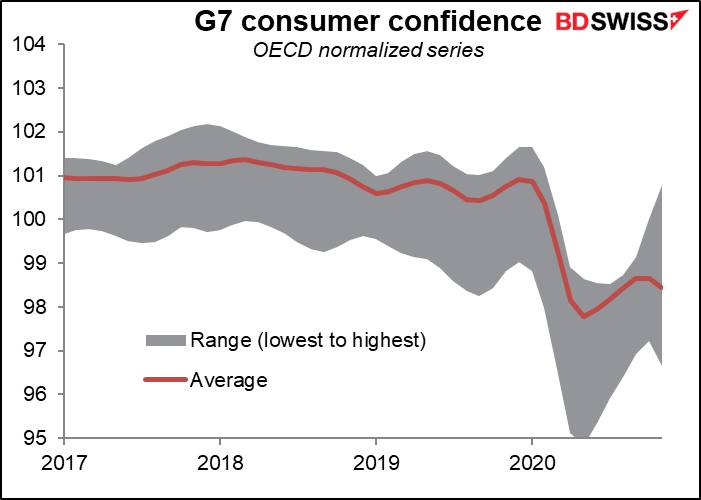
The “low” in this graph for the last two months has been the UK while the “high” has been Australia. Makes sense when you think of the virus toll there – at the end of November, the end of this data, there were 224 new cases a day per 1mn people in the UK and 0.39 case per million in Australia. I think that pretty well explains the difference.
US existing home sales are expected to be down slightly (-2.2% mom). Again, is this due to economic conditions or the virus? Maybe people simply don’t want to go look at houses now. Or perhaps the pent-up demand from earlier in the year, when people really couldn’t look at houses, is starting to fade.
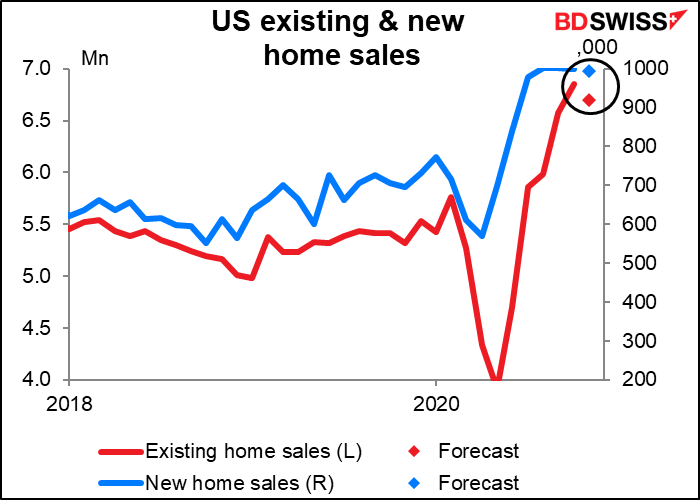
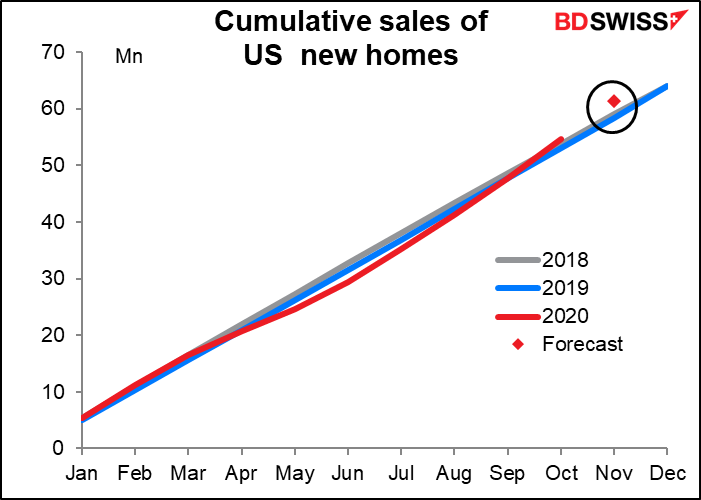
Already in October, more new homes had been sold in the US this year than in 2018 or 2019 (54.7mn vs 53.1mn and 53.8mn, respectively). Some slowdown would be natural, although of course nothing is “natural” about this year.
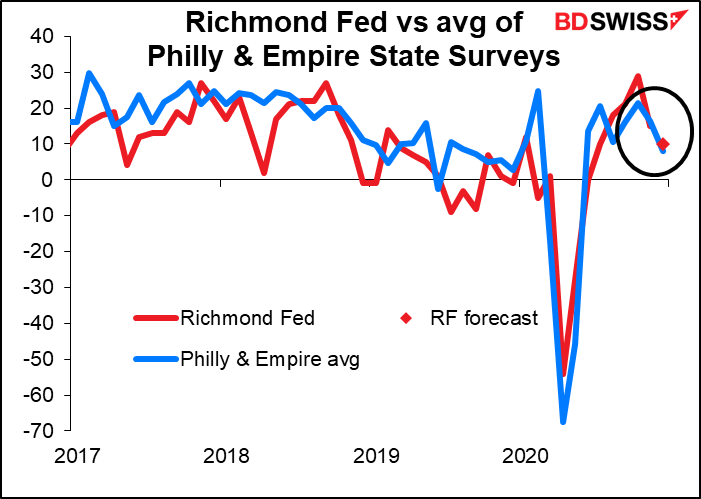
The last indicator on the schedule today is the Richmond Fed survey. The Bloomberg relevance score shows that the market doesn’t watch it as closely as it does the Empire State or Philly Fed indices, but investors certainly should: my research shows that among the five regional Fed surveys, it’s the best correlated with the Institute of Supply Management (ISM) manufacturing survey, which is what people are trying to forecast. (It doesn’t have much power at explaining the Markit manufacturing PMI however – the only one that’s good at that is the Empire State survey.) The forecast decline is exactly in line with the decline of the Empire and Philly Fed indices, so it shouldn’t come as any surprise to anyone.