

FX:
Commitments of Traders (CoT) report
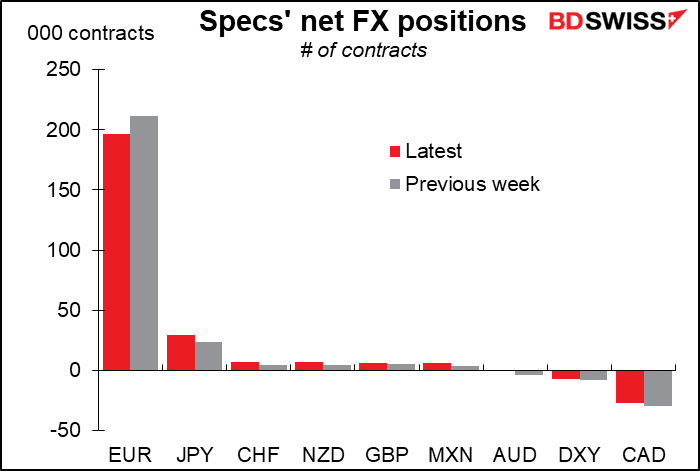
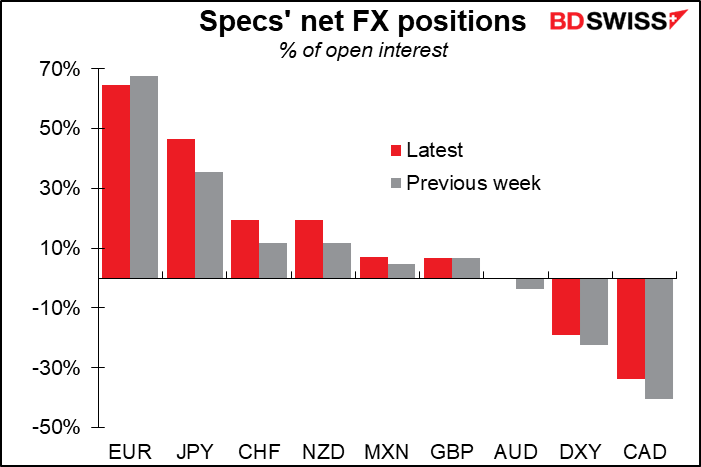
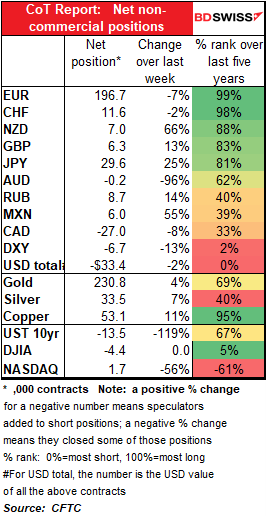
Speculators reduced their record-long EUR positions during the latest week, both in absolute terms and as a percent of open interest. Their EUR position is so big that a small move there outweighed all the other moves and resulted in a small reduction in their overall USD short. Nonetheless this was definitely a move out of EUR and not a move into USD as most other currencies saw either an increase in longs — JPY, CHF, NZD, and GBP – or a decrease in shorts – AUD and CAD.
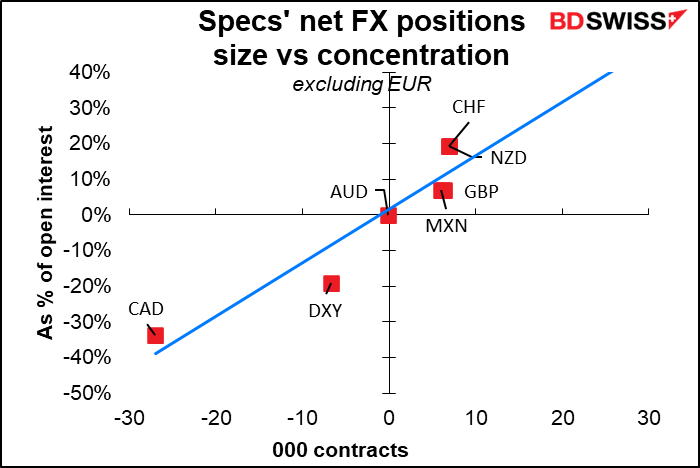
Concentration: The DXY position remains the one slight outlier in that speculators have a higher concentration of short positions in the DXY than their net position would suggest. This confirms their bearish view of USD.
This week’s focus: JPY
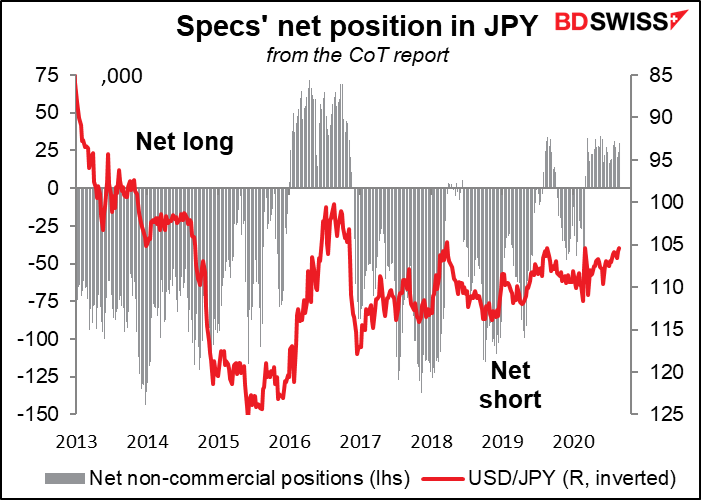
Outside of EUR, the biggest change in position this week in absolute terms was in JPY. Nonetheless, the net JPY position remains well within the recent range – it hasn’t gone over 35k contracts since late 2016. I’ll be watching this contract to see how specs react to the change in government there – I can’t get too enthusiastic about JPY unless specs’ long positions break out to a higher level.
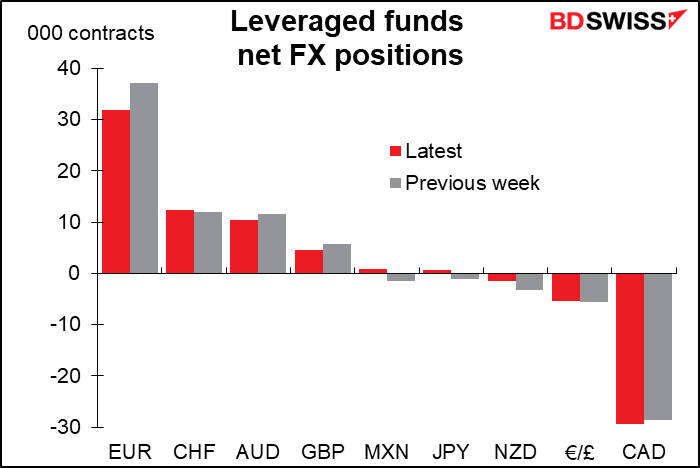
Leveraged funds went from small short JPY to small long JPY – see below.
Asset managers, leveraged funds and retail
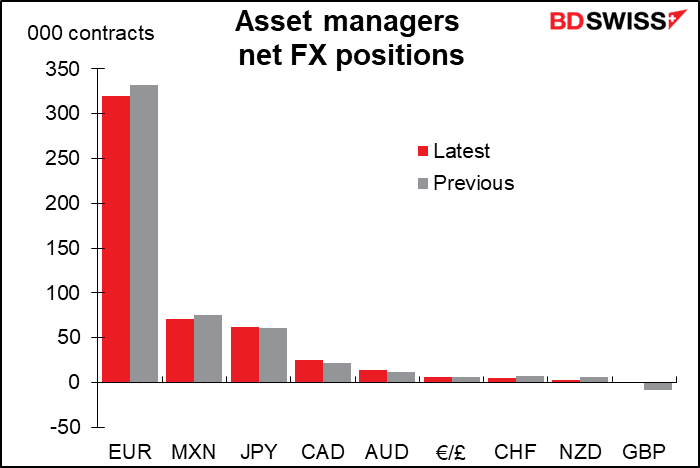
The move out of EUR was unanimous – asset managers, leveraged funds and retail all reduced their long EUR positions.
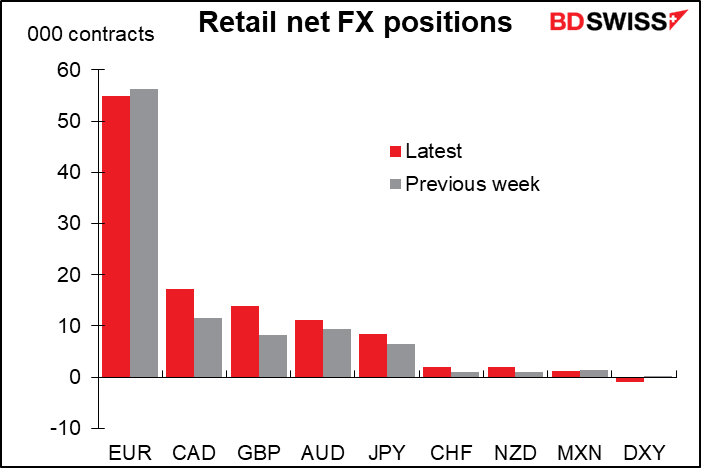
Leveraged funds increased their CAD shorts while retail increased their CAD longs – it will be interesting to see which is the “smart money” this week. I agree with the retail in this case (see my Weekly Outlook for my expectations for this week’s Bank of Canada meeting.)
In fact, retail increased most of their positions, aside from EUR, and switched from a small DXY long to small short. They thus followed the basic move of the speculators in reducing exposure to EUR but not increasing exposure to USD.
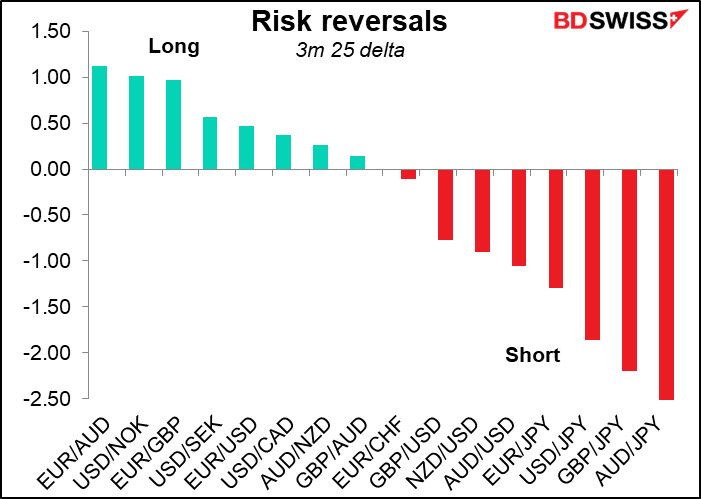
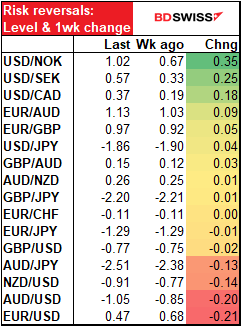
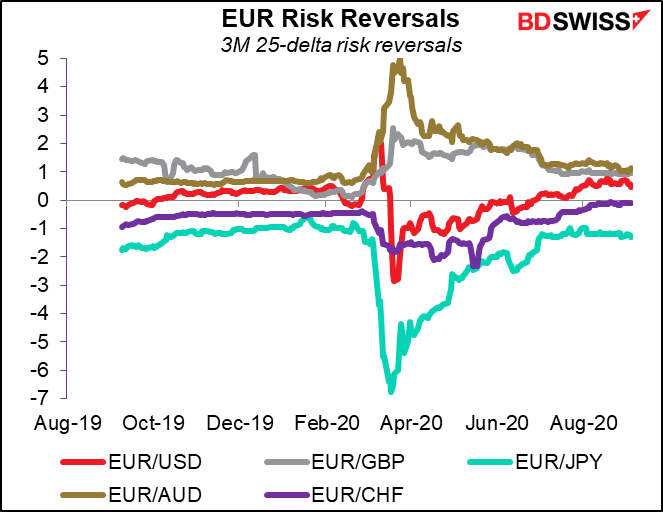
Risk reversals (RR)
EUR/AUD and AUD/JPY remain at the extremes of the risk reversals, indicating continued concern about a fall in risk-seeking behavior as stock markets
The biggest gain was in the Skandis. Both USD/NOK and USD/SEK RRs rose sharply, indicating more bearishness towards those two currencies.
USD/CAD RR also rose, perhaps some people expecting a dovish Bank of Canada meeting this week? Or thanks to the fall in oil prices?
On the other hand, EUR/USD showed the biggest decline. It’s still positive, indicating people wanting to catch EUR/USD upside, but clearly not as urgently as before.
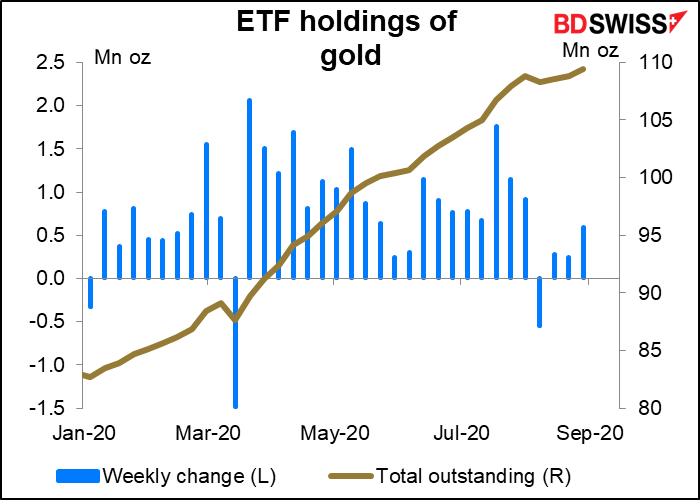
Gold & Silver
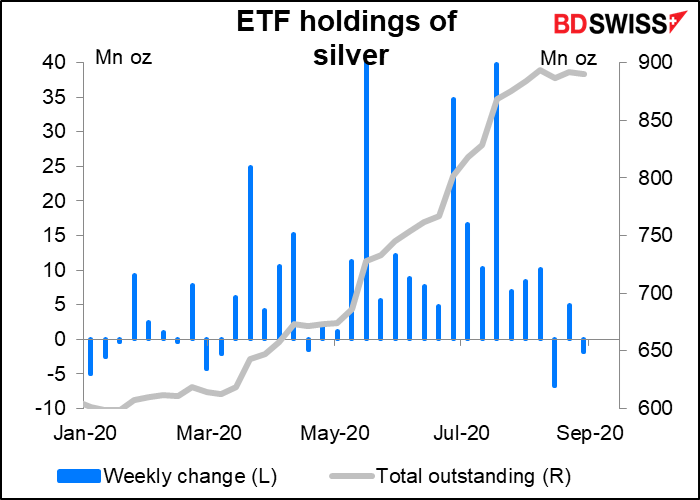
EFTs: Exchange-traded funds (ETFs) holdings of gold increased in the week by the most in five weeks, whereas silver holdings fell.
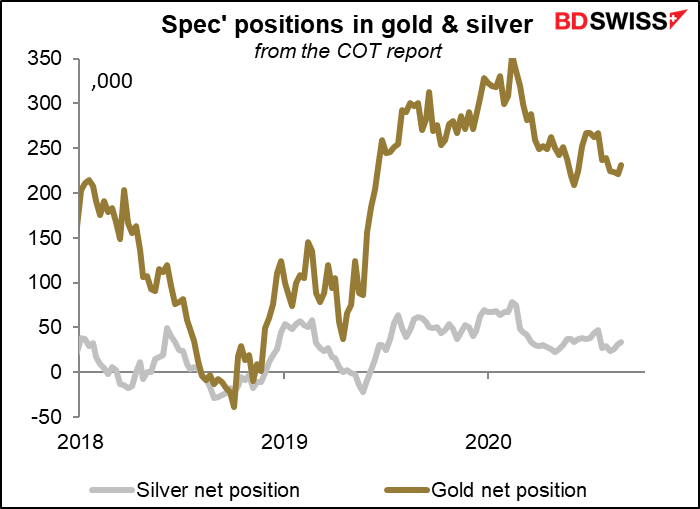
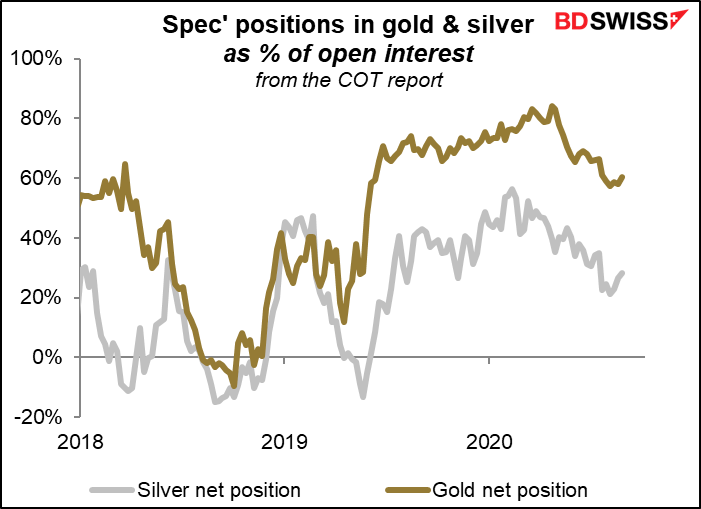
Commitments of Traders (CoT) report: Speculators
Speculators were net buyers of both gold and silver in the latest week.
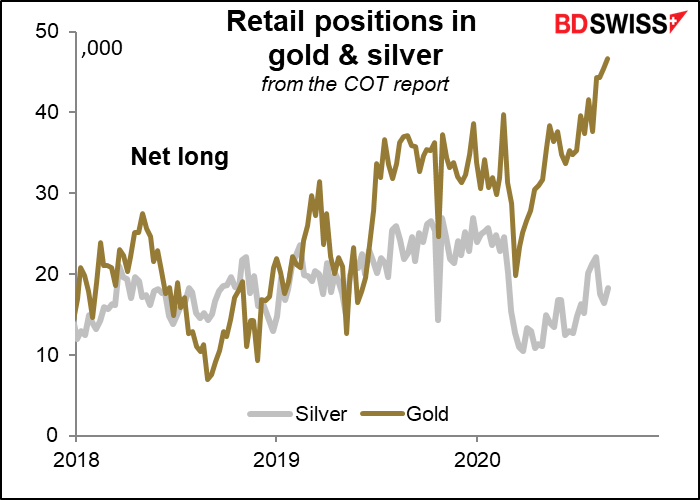
CoT report: Retail positions
Retail is enthusiastic about gold but somewhat cautious about silver. They added to their silver positions but not like they added to gold.
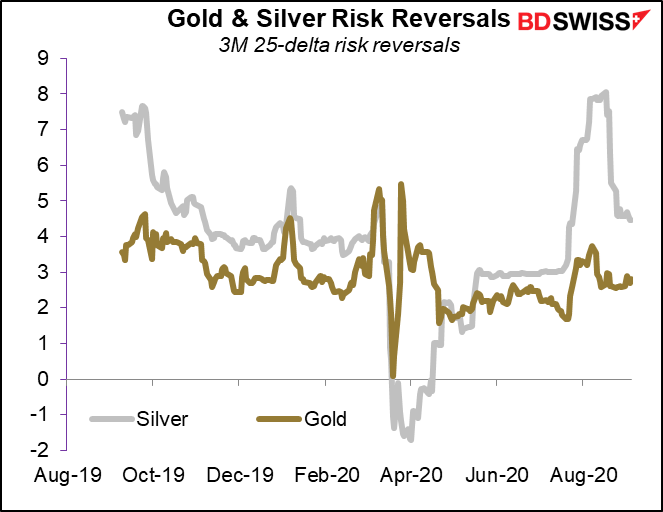
Risk reversals
Not much change in the risk reversals. Silver bullishness continued to decline, while gold bullishness increased a bit, but nothing significant.
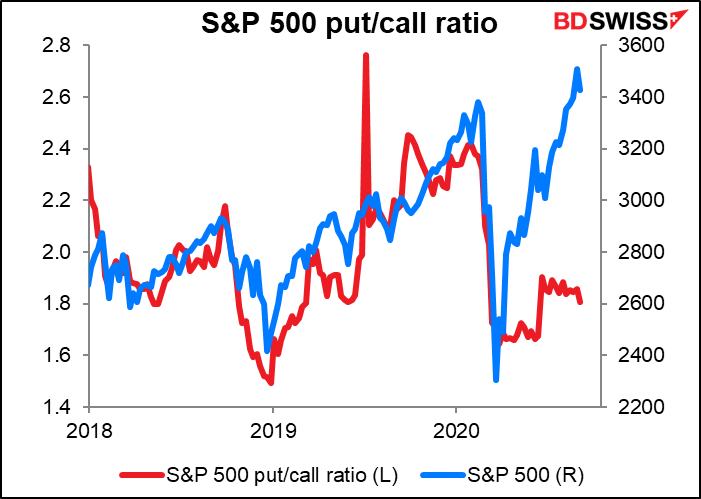
Equities: Put/call ratios
The S&P 500 put/call ratio declined as the market came down.
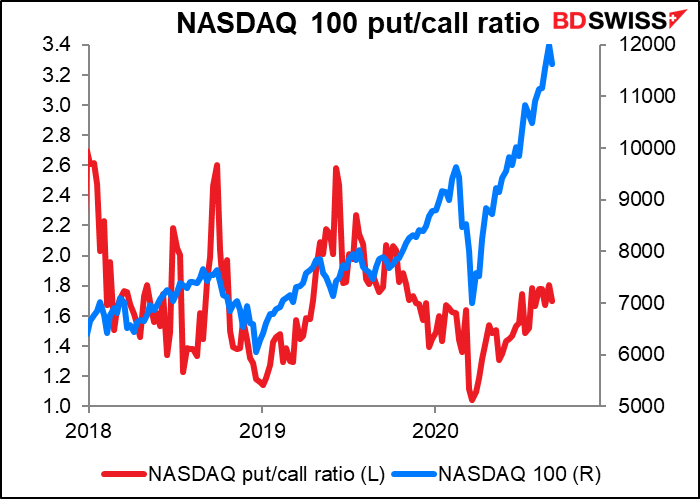
Same with the NASDAQ 100.
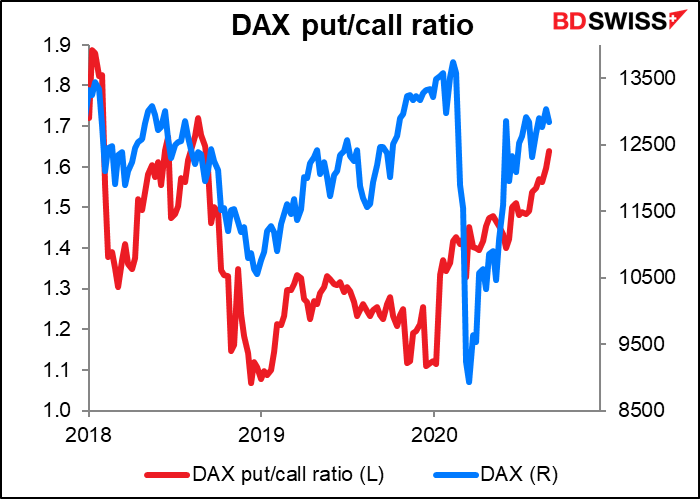
The DAX put/call ratio on the other hand rose, perhaps because the index didn’t fall as much as the US ones did.
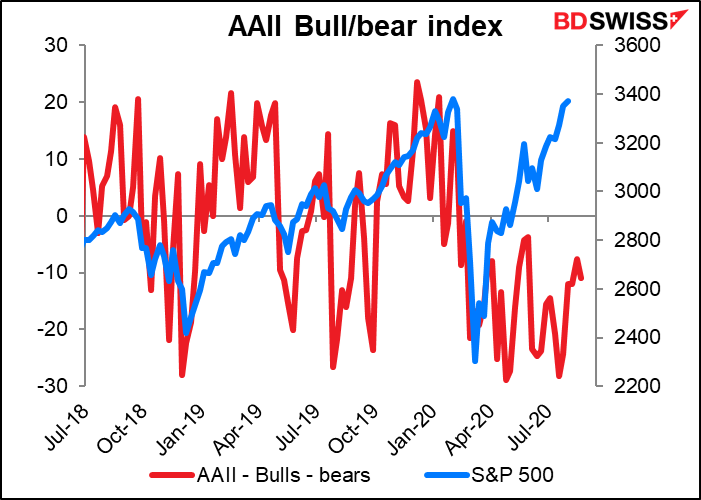
AAII “Bull/Bear” Index (see “Explanations and definitions” below)
The AAII “Bull/Bear” index fell marginally during the week. Remember it comes out on Wednesday, so this was before the big collapse in the NASDAQ and some of the favorite stocks of retail investors
The AAII commented:
Pessimism among individual investors about the short-term direction of the stock market rebounded, continuing its streak of staying above 40%. The latest AAII Sentiment Survey also shows small declines in bullish and neutral sentiment.
Bullish sentiment, expectations that stock prices will rise over the next six months, declined 1.3 percentage points to 30.8%. Bullish sentiment remains below its historical average of 38.0% for the 26th consecutive week and the 31st week this year.
Explanations and definitions:
The Commitments of Traders (CoT) report, from the US Commodity Futures Trading Commission, presents data on all the futures markets in the US. The data is taken on Tuesday and is released on Friday evening in the US.
For the financial futures, such as currencies, there are three broad classifications of traders. Professional traders are separated between “commercial” and “non-commercial” participants “Commercial” accounts are those that largely using futures to hedge their positions. “Non-commercial” accounts are largely those that are using the futures to speculate in the markets, such as hedge funds, asset managers, and individual traders. We refer to them here as “speculators.” There is another category, “non-reportable,” that consists of small investors whose transactions are individually too small to report on. We present them here as “retail.”
For the financial futures, the data on professional traders are further broken down into “asset manager/institutional,” which includes pension funds and insurance companies – so-called “real money” investors – and “leveraged funds,” which are typically hedge funds and other types of speculators. (There are other categories as well, but we don’t cover them here.) These categories do not necessarily add up to the “non-commercial” figure because of overlap.
For the physical commodities, such as gold, the “commercial” category, which we don’t worry about, is broken down between “producers/users” and “swap dealers.” “Producers/users” are those that mostly produce, package, or handle a commodity. “Swap dealers “are entities that trade with other firms and use the futures market to hedge, such as investment banks. We ignore the swap dealers, as their activity mostly reflects what they are doing in response to other business, but include “producers” in our gold & silver charts.
The “non-commercial” category, which we refer to as “speculators,” is broken down into “managed money” and “other reportables.” “Managed money” consists of registered commodity trading advisors (CTAs), registered commodity pool operators (CPOs), or other funds that trade commodities on behalf of clients. “Other reportables” are all the other professional investors that are not in the other three categories.
“Open interest” is the number of both long and short contracts that have yet to be closed out. The “net position as a % of open interest” shows the net position as a percent of the total contracts still open. It’s important because it shows how tilted the activity is to either the long or short side.
You can think of the contracts as being like people in a boat. The “net position” tells you how many people are on the left-hand or right-hand side of a boat, while the “% of open interest” tells you what percent that is of the total people in the boat. You can see that even if the net position is small, if the “% of open interest” is high, it’s more likely that the boat tips over.
The full CoT report includes data on both futures and options. We use only the data on futures.
The Risk Reversal (RR) is a gauge derived from the FX options market of whether the market thinks there’s a greater chance of a currency pair rising or falling. If the market thinks it’s more likely that the pair will rise, then the RR will be positive; if falling, then negative. The more positive (negative) it is, the greater the chance that the market places on the pair rising (falling). Formally speaking, the risk reversal is the implied volatility of the calls minus the implied volatility of the puts.
Z-score is a measure of how many standard deviations away from the average something is. It allows us to compare series with different volatilities.
Put/Call ratio: The put/call ratio is the same concept of the risk reversal, but uses trade volume instead of price. It shows the number of puts that have been bought on a market index (in this case) or a stock divided by the number of calls. Note: the direction of the signal that this gives is the opposite of the risk reversal. That is, when it’s positive, it means more puts are being bought than calls, which means there is more of a demand for downside protection than for upside.
AAII Bull/Bear ratio: the American Association of Independent Investors (AAII) every week polls their members and asks a simple question: what direction do you think the stock market will be in the next six months? The bull/bear index is a diffusion index of the percent of people who think it will be up minus the percent who think it will be down. For more information see the AAII’s website.


