Commitments of Traders (CoT) report
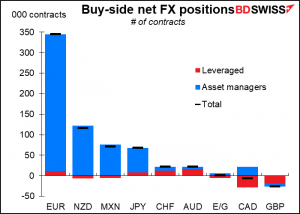
Speculators just keep getting more and more long EUR and short USD. Most of the change last week was through an increase in long EUR positions, with some additional GBP (closing shorts), CHF, JPY, and AUD (closing shorts). On the other hand, speculators added to CAD and NZD shorts and trimmed MXN longs.

While the CHF position is the longest it’s been in five years, that’s more a commentary on how speculators have been playing CHF for the last five years – mostly from the short side. Back in 2007 they were short almost 80k contracts so the current positioning of long 11.7ki shouldn’t be an obstacle to going further long.


Breaking down the participants further, most of the action is with real money investors. Hedge funds and other leveraged investors are not that active in FX. Among the asset managers, long EUR is of course their biggest position but long NZD is #2, which is not evident from the aggregate data. Hedge funds on the other hand have a small net short in NZD.
Asset managers and hedge funds hold opposite views about CAD.

Retail investors also remain heavily long EUR, and indeed long every currency. They switched from short GBP to long GBP last week, leaving DXY their only net short.

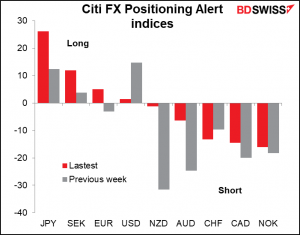
The Citi FX Positioning Alert Indicators (“FX PAIN”)
The Citi positioning indices though show long JPY as the largest position for fund managers. They also suggest some large changes in positioning – a big cut in USD longs and an even bigger cut in NZD shorts (smaller reduction in AUD shorts). EUR switched from short to long in the latest week. They claim that fund managers got even shorter CHF.


Risk reversals (RR)
The options market remains bullish EUR and bearish AUD, but somewhat less bearish AUD than last week. It’s also negative GBP. Every GBP RR I track is still positioned for a weaker GBP, although the GBP/USD RR saw the largest contraction over the last week. The biggest moves last week were bullish JPY, as in USD/JPY and EUR/JPY becoming more negative. Note that the market is more bullish JPY than EUR as the EUR/JPY RR is -1.25 and EUR/USD is +0.59. AUD/JPY remains the most extreme of the pairs that we track.


Explanations:
The Commitments of Traders (CoT) report, from the US Commodity Futures Trading Commission, presents data on all the futures markets in the US. The data is taken on Tuesday and is released on Friday evening in the US.
For currencies, there are three broad classifications of traders. Professional traders are separated between “commercial” and “non-commercial” participants “Commercial” accounts are those that largely using futures to hedge their positions. “Non-commercial” accounts are largely those that are using the futures to speculate in the markets, such as hedge funds, asset managers, and individual traders. We refer to them here as “speculators.” There is another category, “non-reportable,” that consists of small investors whose transactions are individually too small to report on. We present them here as “retail.”
The data on professional traders are further broken down into “asset manager/institutional,” which includes pension funds and insurance companies – so-called “real money” investors – and “leveraged funds,” which are typically hedge funds and other types of speculators. (There are other categories as well, but we don’t cover them here.)
The Citi FX Positioning Alert Indicators (“FX PAIN”) “infer positioning of active currency traders from relationships between exchange rates and currency managers’ returns. A positive reading suggests that currency traders have been net long the currency and a negative reading suggests that currency traders have been net short the currency.”
The Risk Reversal (RR) is a gauge derived from the FX options market of whether the market thinks there’s a greater chance of a currency pair rising or falling. If the market thinks it’s more likely that the pair will rise, then the RR will be positive; if falling, then negative. The more positive (negative) it is, the greater the chance that the market places on the pair rising (falling). Formally speaking, the risk reversal is the implied volatility of the calls minus the implied volatility of the puts.
Z-score is a measure of how many standard deviations away from the average something is. It allows us to compare series with different volatilities.


