


Rates as of 04:00 GMT

Market Recap
CAD was the best-performing currency as oil prices rose. Bet you’ve seen this graph before:

The currency also got some support from reports that former Bank of Canad and Bank of England Gov. Mark Carney is advising PM Trudeau on the Canadian government’s response to the pandemic helped market sentiment toward the currency – apparently people in the market have confidence in Mr. Carney. Also, a weekly gauge of consumer confidence in the country managed to poke its nose above the 50 line that signifies the difference between net negative and net positive views.

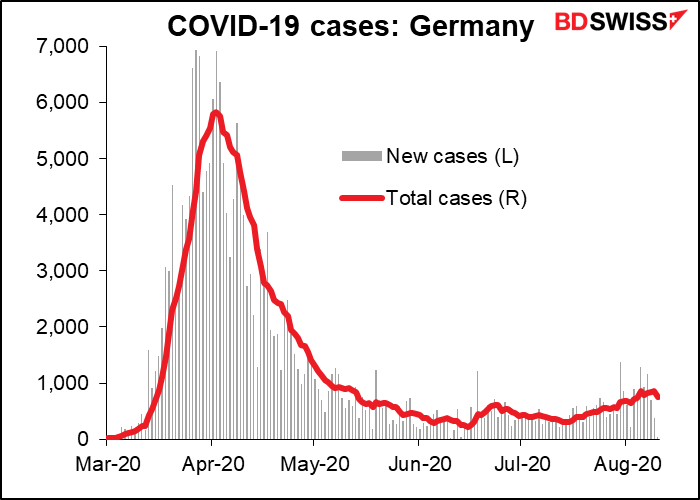
As for oil, it gained after the head of Saudi Aramco gave an upbeat assessment of the oil market. He told reporters on a video conference that global demand for crude oil is around 90mn b/d, just 10mn b/d below pre-pandemic levels, and could recover to “the mid-90s” by year-end. Also there are signs that the spread of the virus is peaking in the US (see graph below) – although I must say, the US government is doing everything it can to prevent the virus from peaking, what with its energetic “back to school” and “reopen the economy” moves. And international air travel is recovering.
On the other hand, EUR was the main loser after the Bank of France warned in its monthly report that the pace of economic recovery is slowing in France. Bloomberg’s summary of high-frequency data suggests that that’s correct, not just for France but for the Eurozone as a whole. The recovery appears to be hitting a plateau (or even trending down in Spain):

(The Eurozone figure is an average of the four countries, weighted by their share of the ECB’s capital key, a measure that combines population and GDP. The four account for 75% of the Eurozone.)
After the euro’s recent rise, the news was a good opportunity to take some profits.
However, FX is a relative game, and the question I have is, where isn’t the economic recovery slowing? The same set of indicators suggests that it’s pretty much the same story everywhere.

And while the virus is indeed creeping back up in Europe, again on a relative basis it’s nothing like it is in the US:

In fact if you just look at the US vs Germany, the Eurozone’s biggest economy, there’s no comparison. Germany’s economy continues to accelerate, according to yesterday’s update from the Bundesbank. It’s now in positive territory for the year.

The rise in GBP was probably just a function of the fall in EUR as some speculators that follow technical trends were said to be selling EUR/GBP.
As for silver…up another stunning 3.5%.
Today’s market
The main point of interest is the Reserve Bank of New Zealand (RBNZ) meeting overnight. Since it’s happening overnight, I’ll discuss it further down in the text.
We discussed the UK employment data yesterday and besides, I can’t possibly be expected to get this comment out so early, especially considering my long & difficult commute through heavy traffic every morning.
So let’s start with the ZEW survey of analysts and economists – not to be confused with the Ifo Survey or the purchasing managers’ indices (PMIs), the ZEW is a sentiment survey. The forecast is that the current situation is looking a little better than last month, but expectations aren’t as high as they were.

That would make sense as Germany comes out of lockdown and finds that the virus is creeping up again. (Although we should keep things in perspective: Germany’s 744 new cases a day on average over the last week is about the same as the US state of Oklahoma (763), where if you remember Trump had a rally a few weeks ago. Germany has 83.02mn people, vs 3.96mn in Oklahoma.)
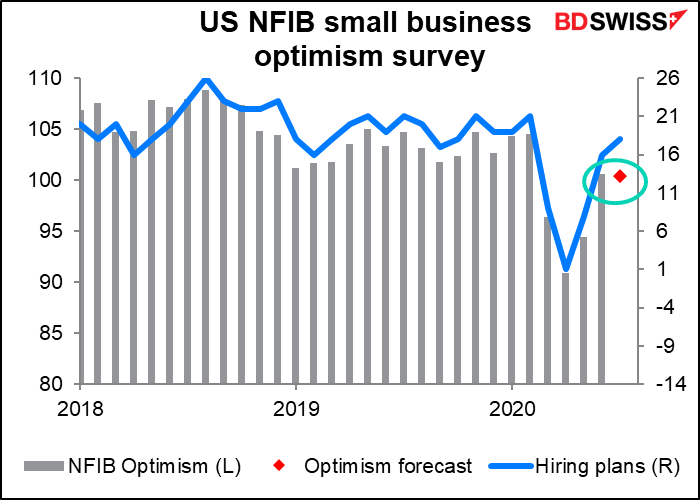
The National Federation of Independent Businesses (NFIB), the US small-business association, releases their small business optimism index. How optimistic are these people? The market expects them to be about the same as last month. Maybe most of them don’t live in Oklahoma. (At this point, 36 out of 52 states & territories are seeing increasing virus counts, so that’s unlikely to be the reason.) What’s interesting about this index is the part that’s already out, namely the “hiring plans” index, which rose – great news and surprising news!
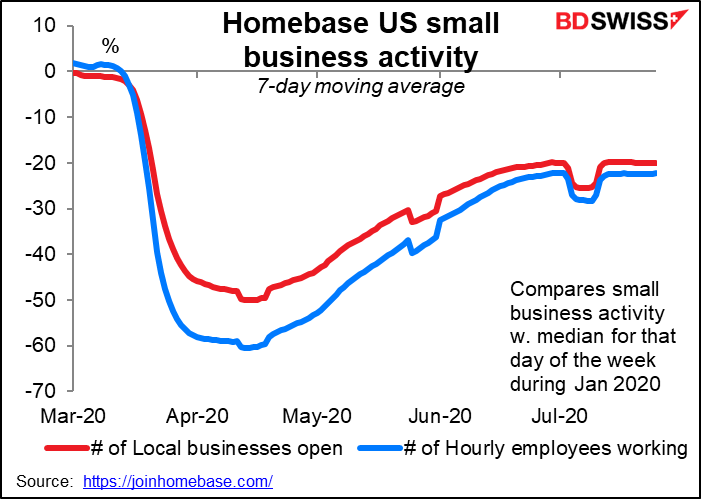
The comparable high-frequency data would be the Homebase data of how many small businesses are open nowadays. I only have that data up to 25 July, but it certainly shows a plateau in small business activity in the US. Not necessarily a downturn (yet) but the curve has flattened, in this case unfortunately.
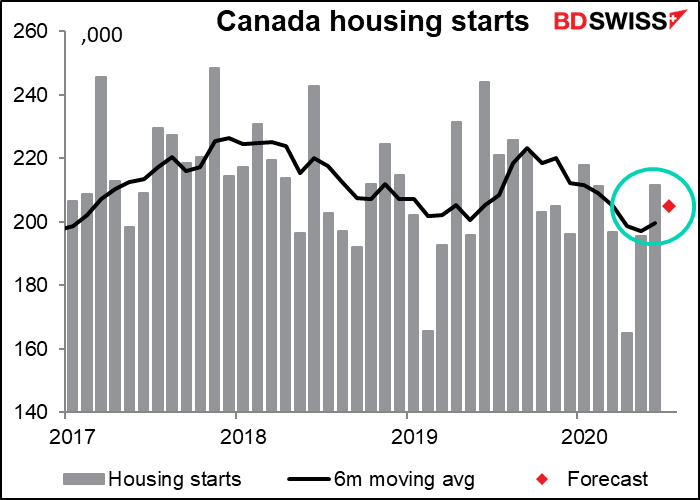
(Somehow I got Canadian housing starts in yesterday’s schedule. My apologies. Repeating here with a little bit more)
Canada’s housing market, like that of the US, has withstood the pandemic fairly well. Housing starts slumped in April, but rebounded in June back to the same level as February, before all the excitement began. July is expected to be down a bit, but not significantly and still above the six-month moving average.
I saw a little tidbit about Canadian housing on Twitter yesterday: Here’s a COVID trend for you. Downtown Vancouver condo sales collapsed, falling 18% Y/Y in July. House sales in the Fraser Valley surged 56%. So what’s happening in the US is happening in Canada too (and elsewhere, I gather): people who’ve discovered they can work from home are abandoning the cities and moving to the suburbs, where the same amount of money will get them a much bigger house with a garden etc. This trend is likely to support housing starts, as there may be more demand for single-family homes than for multi-unit buildings.
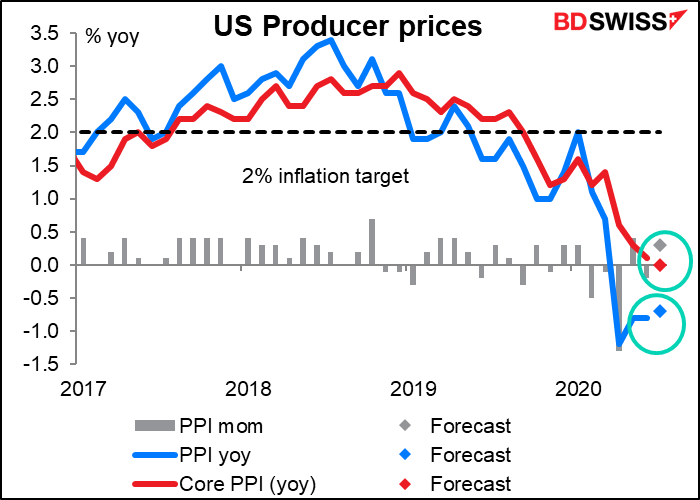
US producer prices might be of interest to equity analysts, who are trying to work out the sales margin of companies, but at this point no one in the FX market is particularly worried about US upstream inflation, so I doubt if this will have much effect on the FX market.
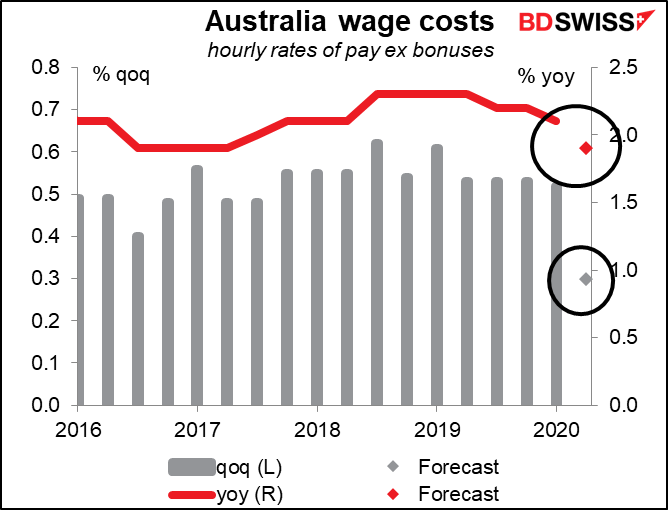
Australia wage costs are expected to fall – another indication of the deflationary nature of the virus shock. No surprise to the Reserve Bank of Australia, which is expecting deflation.
We now get to the Reserve Bank of New Zealand (RBNZ) meeting. .I expect that they will follow all the other G10 central banks recently and keep policy unchanged. The real action will be in the accompanying Monetary Policy Statement, as it was last week with the Bank of England.
In the statement following the June meeting, they said
“The Monetary Policy Committee is prepared to provide additional stimulus as necessary. As well as potentially expanding the Large Scale Asset Purchase (LSAP) programme, the Committee continues to prepare for the use of additional monetary policy tools as needed…We will outline the outlook for the LSAP programme and our readiness to deploy alternative monetary policy tools in our August Statement. We are committed to meeting our inflation and employment mandate.”
The last line is important because later in the Minutes, it says “…the Committee agreed that it is not yet clear whether the monetary stimulus delivered to date is sufficient to meet its mandate.” If they decide no, it isn’t, then they’ll have to think of the next step.
What might the next step be? The minutes said the Bank’s staff are working on measures such as “a term lending facility, reductions in the OCR, and foreign asset purchases, as well as reassessing the appropriate quantum of the current LSAP.” Two of these stand out. First, the Committee has specifically not ruled out negative rates, so a further reduction in the official cash rate (OCR) is still a possibility even though it’s currently at 0.25%. No “effective lower bound” here!
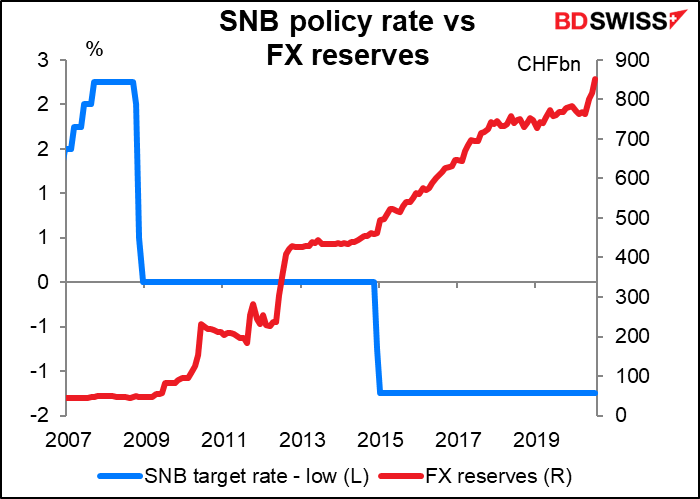
Second, they mention a dramatic one: foreign asset purchases. This would be importing the Swiss National Bank (SNB) playbook into New Zealand. The SNB started intervening heavily in the FX market at the same time that it instituted negative interest rates. It cut the lower bound of its policy rate to -0.75% from 0% in December 2014 (and to -1.25% the following month). In December, when rates first went negative, reserves jumped 7%. In the year before they instituted negative rates, FX reserves grew 6.2%. In the year after, they grew 22%. And they’ve kept on growing ever since.
This is of course the quintessential “beggar thy neighbor” policy that most countries try to avoid, at least on the surface (Japan does it much more subtly). The reason Switzerland has been able to get away with it and New Zealand probably could too is because they’re tiny countries. No one really cares if New Zealand runs a big trade surplus because it’s not going to be that big in the scheme of things. In fact, last year their trade was well balanced: they ran a tiny surplus in trade in goods and services of NZD 266mn.
As a result, all eyes will be on the Monetary Policy Statement to see what tricks they have in store for us. Any hint that they might consider foreign asset purchases as a tool of monetary policy would be negative for NZD, I should think.
Then, once again in the early morning European time, we get the monthly deluge of UK economic indicators in UK short-term indicator day: GDP, industrial production, and the trade balance.
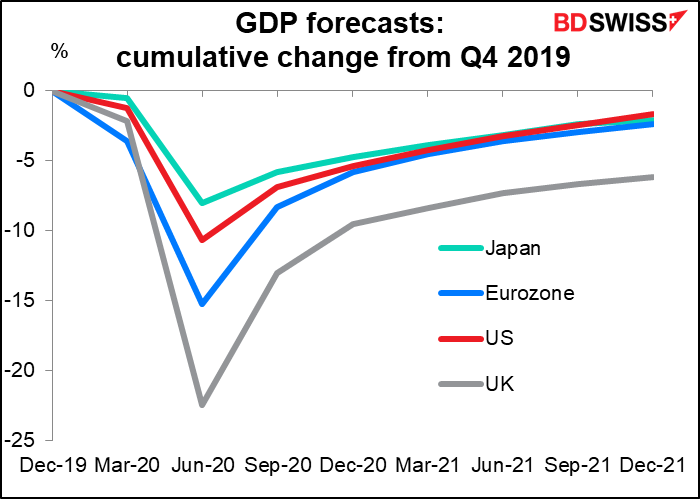
The monthly GDP figure isn’t that closely watched, according to the Bloomberg gauge, but this month we get the Q2 GDP figure, which is a biggie, as it is everywhere. The market is looking for a horrendous plunge of -20.7% qoq. That’s far worse than -12.1% qoq in the Eurozone and -9.5% qoq in the US. There’s a lot of uncertainty around these forecasts of course; but even so, even the best forecast is dreadful: the range is from -16% to -24%.

Admittedly the market is looking for a much sharper recovery in the UK than elsewhere – Q3 forecasts are +12.2% qoq in the UK vs +8.2% qoq in the Eurozone and +4.2% qoq in the US – but that won’t be enough for the UK to climb out of its pit at the same pace as other countries. This is just what the county doesn’t need as it comes to grips with Brexit.
With the all-important quarterly GDP figure coming out, I’m not sure anyone will give much of a butcher’s to the other data, but we might as well go through it quickly.
Industrial and manufacturing production are both expected to be up sharply on a mom basis, but as usual that’s just a function of the fact that they collapsed previously. They’re still expected to be 12% and 14% respectively below the average level of January and February.

For the trade data, the deficit in visible trade is expected to widen somewhat but remain narrower than the six-month moving average. The overall trade surplus is expected to fall a bit, perhaps as a result.

Both imports and exports have collapsed, but particularly imports, which were down 38% yoy in May (goods & services) vs 28% yoy for exports.
This could be pandemic-related except that it started in November, probably as people ran down the inventories that they built up ahead of the expected “sudden stop” when Brexit was supposed to occur at the end of October. Then when the pandemic hit, there was another lurch down in imports (along with exports) as imports of services fell too.


