Rates as of 05:00 GMT
Market Recap
It was another “risk-off” day yesterday as stock markets fell sharply. The S&P 500 fell 1.30%, the third time in the last five sessions that it’s lost more than 1%. Tech led the decline, with the NASDAQ down an even sharper 2.1%.
The immediate cause of the rout was the surge in oil prices.

Oil rose after OPEC+ stayed with its plan and decided to raise production by only 400k barrels a day (b/d). This decision was a surprise to me and to many other people in the market who had expected them to try to calm energy markets by increasing output more. The inevitable result was a sharp rise in oil prices as demand remains strong.
The rise in oil prices recently has been relatively modest when compared with other forms of energy such as coal and of course the incredible leap in natural gas prices recently. European natural gas prices rose 2.1% yesterday, for example.

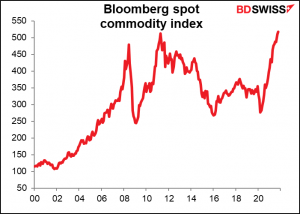
It wasn’t just energy prices that rose. Most industrial commodity prices were higher yesterday, with the exception of nickel.

The Bloomberg Commodity Spot Index hit a record high.
Rising prices for energy and other commodities raise the risk that the current round of above-target inflation might not be so “transitory” as central banks think. In that case, they might have to tighten policy before the pandemic is over and before economies have healed fully. That raises the risk of the dreaded stagflation, back from the 1970s dead.
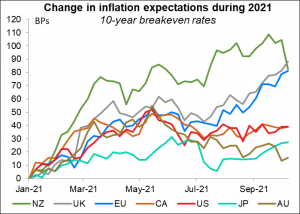
Concerns about stagflation hit government bond prices as investors raised their expectations for inflation, particularly in the EU and UK. Ten-year German breakevens rose +2 bps to an eight-year high of 1.72%, while their Italian counterparts hit 1.63%, their highest level in over a decade. UK 10-year breakevens jumped 6.8 bps. Higher inflation expectations naturally caused higher yields.
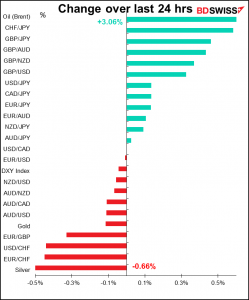
Against this background, the moves in the FX market were a little confusing.
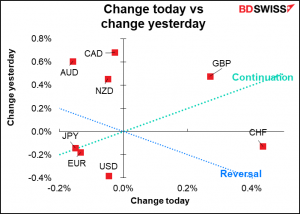
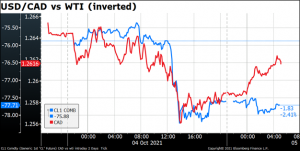
The first question is, why didn’t CAD go through the roof? (Or more accurately, why didn’t USD/CAD go through the floor?) Looking at the chart at the bottom of this comment, USD/CAD was unchanged from this time yesterday morning, which is remarkable considering how much oil was up.
It appears that USD/CAD did in fact move along with oil prices for much of the day, but then once oil peaked and started moving sideways, USD/CAD lost its momentum and reversed the move. I’m afraid I can’t find out why – I don’t see any Canadian news to justify the move.
It also seems anomalous that with commodity prices higher, AUD would be the worst-performing currency. Two things at play here: one, the “risk-off” vs “higher commodity prices” – AUD would naturally lose ground in a risk-off environment. (But then why was JPY the next worst-performing currency?)
Secondly, the Reserve Bank of Australia (RBA) kept its policy settings on hold this morning, as expected. The RBA’s dovish stance is in contrast to that of several other central banks which are becoming increasingly concerned about inflation. In the statement following the meeting, RBA Gov. Lowe hinted that the Council of Financial Regulators might impose stricter lending requirements or other restrictions to hold back lending – this reduces the need for higher interest rates to accomplish that goal and so is negative for the currency. We’ll have to wait for Friday’s release of the semi-annual Financial Stability Review to get the lowdown on this matter.
On the other hand, why did GBP rally so much when most of the news out of the UK was negative (as usual)?
Today I would expect to see a recovery in the commodity currencies. This kind of surge in commodity prices should be reflected more in the price of these currencies, in my view.
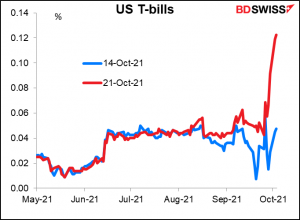
Elsewhere, US President Biden said he cannot promise the US will not breach the debt-ceiling limit and the T-bill market is certainly treating this seriously. Notice the difference in yield between the T-bill maturing on Oct. 14th and the one maturing one week later, which just happens to be after the date (Oct. 18th) that Treasury Secretary Yellen said the US might run out of money. This fear is probably adding to the market’s insecurity.
Today’s market
Note: The table above is updated before publication with the latest consensus forecasts. However, the text & charts are prepared ahead of time. Therefore there can be discrepancies between the forecasts given in the table above and in the text & charts.
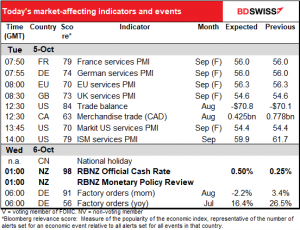
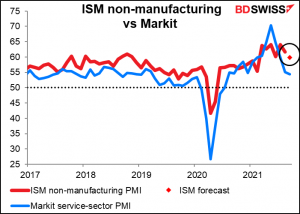
Today during the US and European day the main focus will be the service sector purchasing managers’ indices (PMIs), once again the final ones for the major economies and the first and only versions for all the other countries. These used to play second fiddle to the manufacturing PMIs, which are much more cyclical, but ever since the pandemic hit the service sector harder than manufacturing these have been the stars of the show.
The preliminary versions showed a big gap between the US and Europe on the one hand and Japan on the other. The US and UK were in the “decelerating expansion” quadrant while the EU, led by Germany, was in the “accelerating expansion” quadrant. But poor Jpan is in the “decelerating contraction” quadrant. Japan’s service-sector PMI hasn’t been in expansionary territory since the pandemic began. This suggests that the country still hasn’t fully broken away from the export-led development model that it embraced so successfully after WWII.

Along with this is the Institute of Supply Management (ISM) version of this PMI. It’s expected to fall by 1.8 points, vs the 0.7-point fall in the preliminary Markit version of this index. Even so the ISM version is expected to remain above the Markit version.
People will also be paying a lot of attention to the ISM index’s employment PMI (no forecast available).
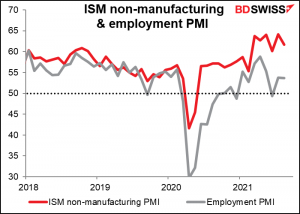
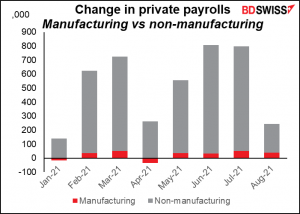
That’s because service-sector employment constitutes the bulk of the nonfarm payrolls. That’s why this index is usually a big part of economists’ models for the monthly nonfarm payrolls. In my little forecasting model consisting of the ADP report, initial jobless claims, and the service-sector employment PMI, it not only was statistically significant but was more so than jobless claims.
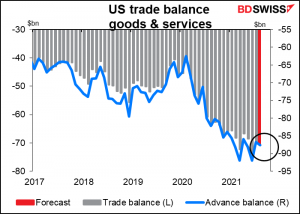
The US trade balance…why does the market pay so much more attention to this indicator than to the advance trade balance, aka merchandise trade, which comes out earlier and explains about 93% of the variation in this series? I suppose this one is the more complete series. Anyway it’s expected to be little changed from the previous month and should have no impact on the FX market.
Then overnight the Reserve Bank of New Zealand (RBNZ) meets. As usual, I wrote extensively on this question in my renowned Weekly Outlook, including an extensive discussion of the impact of NZ monetary policy on the kiwi population. But to save you the trouble of looking it up, I’ll repeat the main points here:
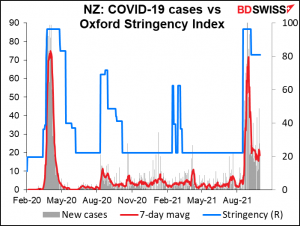
The RBNZ was planning on hiking rates at its Aug. 18th meeting, but that plan was derailed when the entire country was put on “Level 4” lockdown less than 24 hours before the meeting. Since then the government has been able to contain the outbreak and restrictions have been eased (but not lifted entirely).
So are they going to lift rates at this meeting? I think so and the market thinks so. The market is pricing in an 86% chance of a hike.

The case for hiking rates now is no different than it was back in August. Inflation is over the target zone, house prices are still rising, and the unemployment rate is back to where it was before the pandemic, which the RBNZ considers to be “at or above its maximum sustainable level.” With the virus now contained, I think they will go ahead with a modest 25 bps rate hike. I think this is probably the market consensus and so shouldn’t have that much impact on NZD, although it could boost it a little.
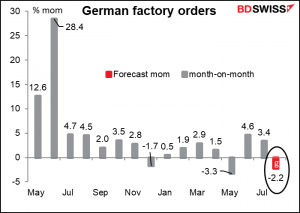
After that we wait for the German factory orders. Unlike the US version of this indicator, it’s a key indicator for the German economy as a harbinger of industrial production (although I’ve yet to figure out the relationship between the two). We can understand why bottlenecks and supply chain problems might be depressing industrial production, but a 2.2% mom decline in orders is worrisome – it may signify weakening demand. Is Europe too starting to glide into stagflation? EUR-