Rates as of 06:00 GMT
Market Recap
I’ve mentioned before the (sexist) Japanese proverb, “A woman’s heart is as changeable as the autumn sky.” Maybe we should change that to “Market sentiment is as changeable as the autumn sky.” The S&P 500 hit a record high Tuesday and Wednesday was down 1.9% (and is seen opening down a further 0.4% today). Asian markets this morning are a sea of red, with only Singapore’s FTSE Straits Times index in the green. Tokyo’s Nikkei index is down 2.9% and Hong Kong’s Hang Seng index -0.4%.
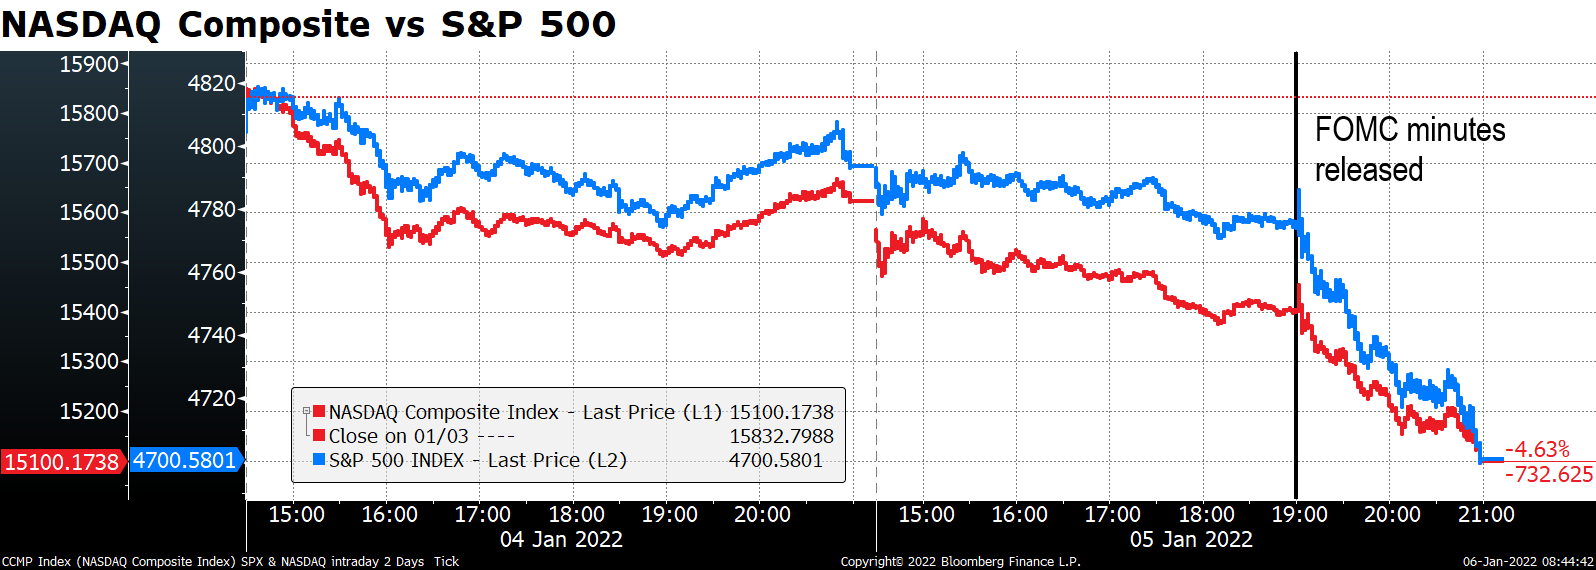
As the graph shows, US stocks were lower from the get-go yesterday, but the rout accelerated right after the release of the minutes of the December meeting of the Federal Open Market Committee (FOMC), the rate-setting body of the US central bank. Wham!
The minutes had a decidedly hawkish tone. The Committee discussed a broad range of topics, including the lessons learned from the 2013/18 policy normalization period, alternative approaches for normalizing policy, the timing and sequencing of actions to normalize policy (raising rates, reducing the balance sheet), and the appropriate size and composition of the Fed’s balance sheet in the long run. This showed that they are thinking of how to get policy back to normal, which for them means a fed funds rate around 2.5%, not 0.08% (the rate this week).
Perhaps the most ominous comment was an explanation of the big change in the Committee’s outlook reflected in the dot plot, which now shows three rate hikes this year as opposed to none in the September version: “participants generally noted that, given their individual outlooks for the economy, the labor market, and inflation, it may become warranted to increase the federal funds rate sooner or at a faster pace than participants had earlier anticipated.”
Furthermore, a part of the Committee wants to see the whole process of normalization proceed faster than before. The minutes revealed that “some participants…noted that it could be appropriate to begin to reduce the size of the Federal Reserve’s balance sheet relatively soon after beginning to raise the federal funds rate.” (“Some” usually means four or five.) Furthermore, “some participants” also noted that “depending on the size of any caps put on the pace of runoff, the balance sheet could potentially shrink faster than last time.” Expanding the balance sheet is called “quantitative easing” or QE; now we have to start talking about “quantitative tightening,” or QT.
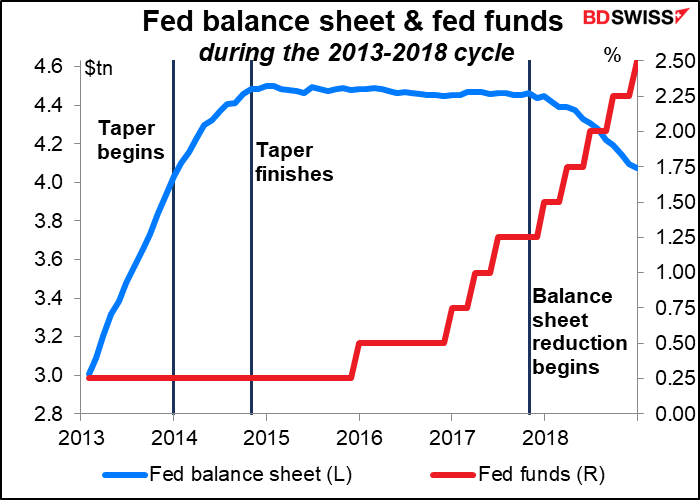
Just to remind you of what happened “last time:” the Fed started to taper in Dec. 2013 and finished in Oct. 2014 (10 months). They started hiking rates in December 2015 (14 months later) and waited until Oct. 2017 (22 months) before starting to run down their balance sheet.
The Committee still has to discuss how many times they should hike the fed funds rate before they start QT (last time it was four). They also have to decide how to treat their holdings of Treasuries and mortgage-backed securities (MBS) when they start letting them roll off. These will be points of major interest when listening to Fed speakers over the next few months.
In the discussion of the composition of the Fed’s asset holdings, “some participants favored reinvesting principal from agency MBS into Treasury securities relatively soon or letting agency MBS run off the balance sheet faster than Treasury securities.” That would have a disproportionate effect on the US housing market and would therefore dampen the economy more than letting them roll off equally.
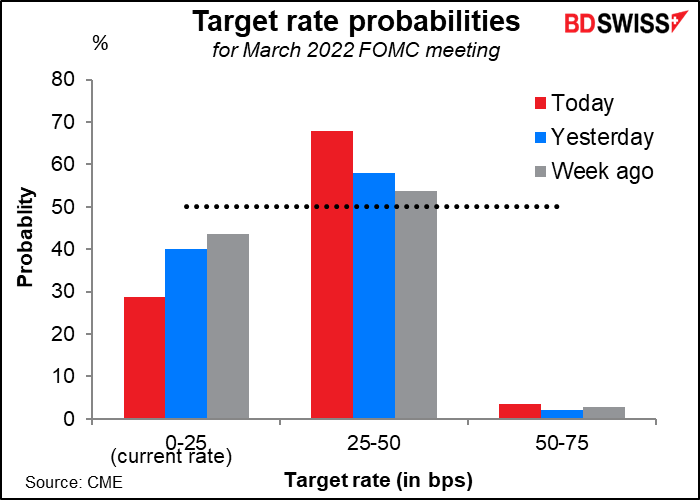
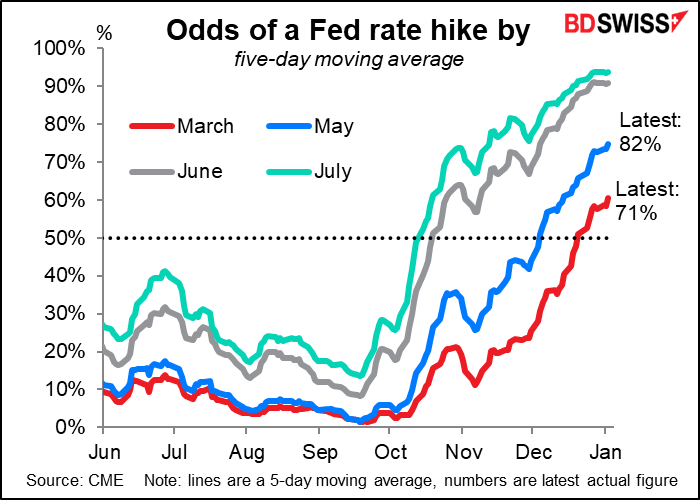
Following the release of the minutes, the probability of an early Fed rate hike rose to 71% from 60% the day before.
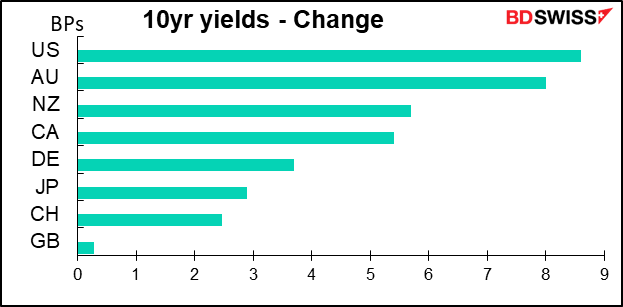
Bond yields rose around the world, particularly in the US.
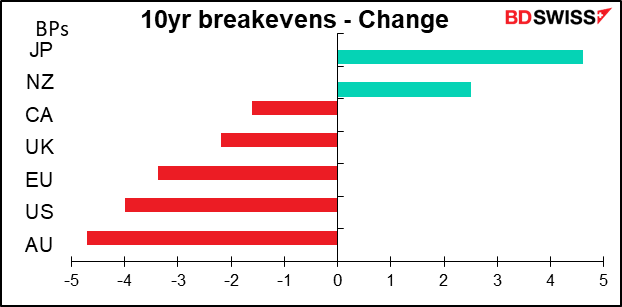
With the Fed likely to normalize policy faster than expected, inflation expectations came down in the US and elsewhere (but especially in the US).
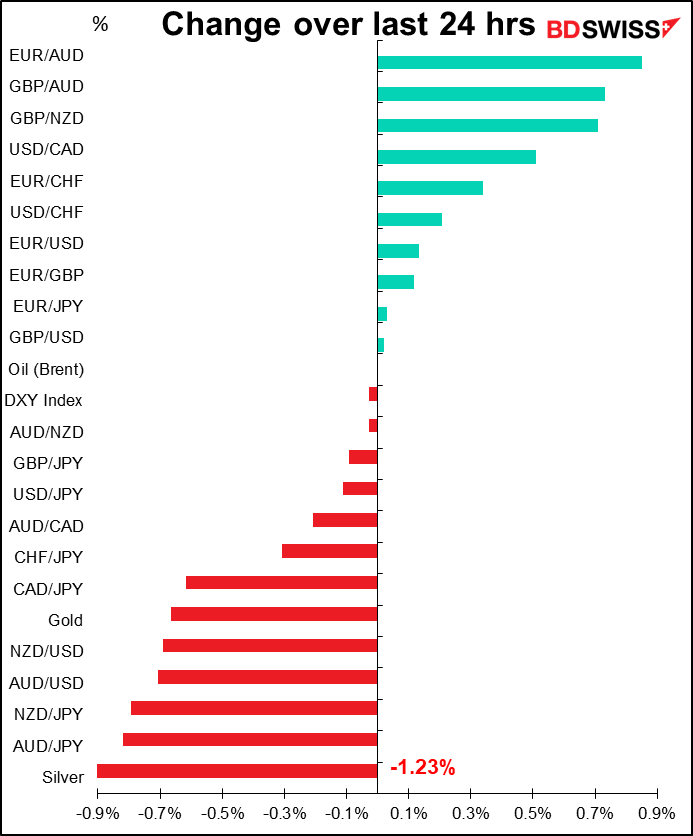
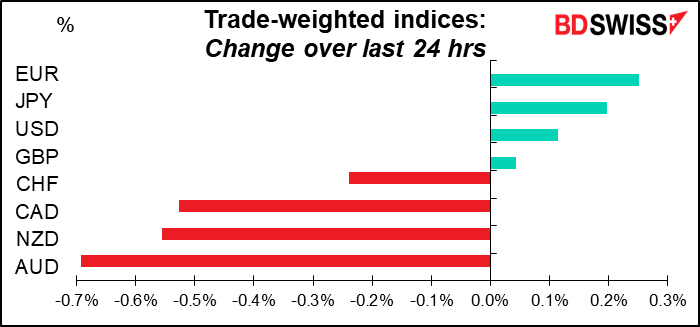
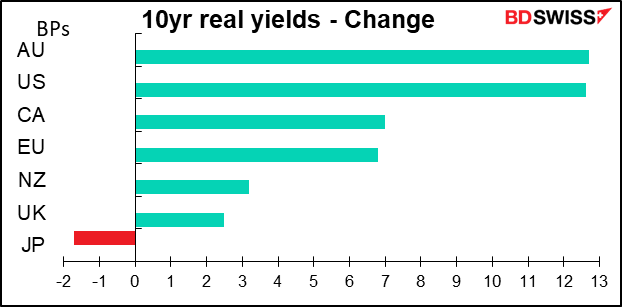
Higher nominal yields + lower inflation expectations = much higher real yields. This should support USD over the longer term, although it didn’t help that much today. Nor did it do anything at all for AUD, which was the biggest loser in the FX market despite having the biggest increase in real yields. Apparently the market was focusing on the implications of early tightening for growth, not interest rates.
Today’s market
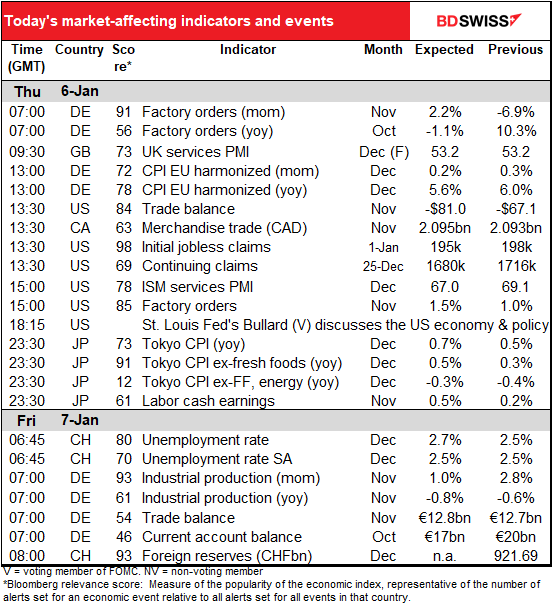
Note: The table above is updated before publication with the latest consensus forecasts. However, the text & charts are prepared ahead of time. Therefore there can be discrepancies between the forecasts given in the table above and in the text & charts.
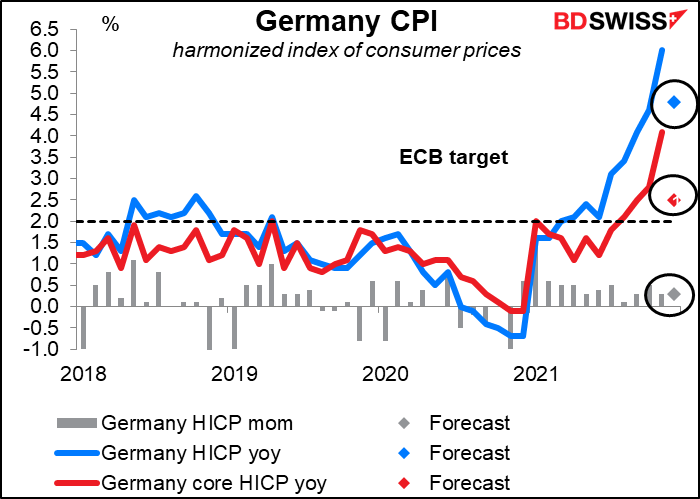
We already discussed German factory orders and the North Rhine Westphalia CPI yesterday. In any case they’re already out.
Given the NRW figures of +0.5% mom and +5.2% yoy, a simple regression would suggest that the national CPI “should” be +0.6% mom and 5.4% yoy, compared with the market forecast of +0.2% mom and +5.6% yoy. The market consensus forecast would be a big drop from the previous month, but the figures are distorted by various tax cuts and changes in seasonal sales, especially sales of package holidays, and so there’s probably more noise than signal in the data.
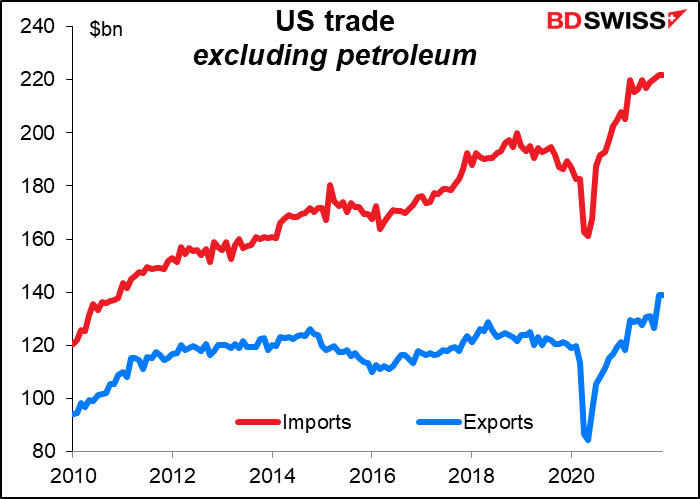
The US trade balance (goods + services) is expected to hit a record deficit of -$81bn. No surprise after the merchandise trade deficit it a record -$97.78bn during the month.
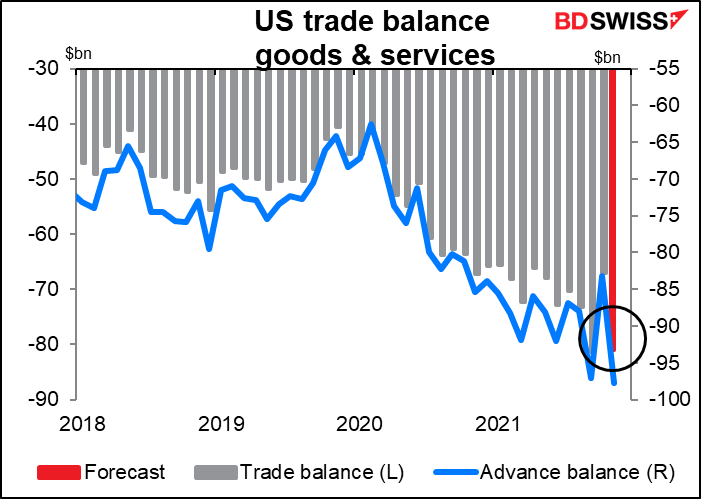
What’s happened is that as the US rebounds more rapidly than the rest of the world, US imports rise faster than US exports. This often happens during boom times in the US – US consumers go out and spend, spend, spend! mostly on imported goods.
Be that as it may, no one seems to care about the trade deficit anymore in relation to the dollar. It used to crop up often in discussions – the “twin deficits” (US government budget deficit plus US trade deficit) but that’s gone the way of the weekly M1 money supply reports from the Fed, which used to be the Big Thing every week.
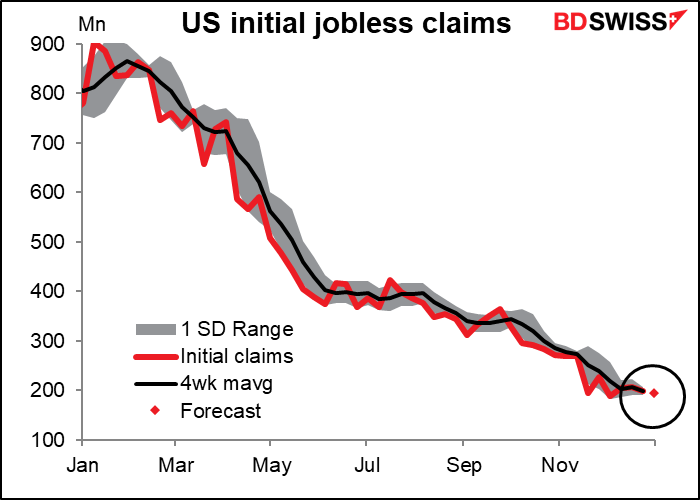
Speaking of the Big Thing every week, are we still obsessing over the weekly US jobless claims? Initial jobless claims are now not only back to normal levels but indeed at record low levels. Last week the 4-week moving average, which is the preferred way of looking at the figures, got down to 199k, the lowest since Oct. 1969 – and need I point out that the US civilian noninstitutional population in 1969 was 135mn vs 262mn today?
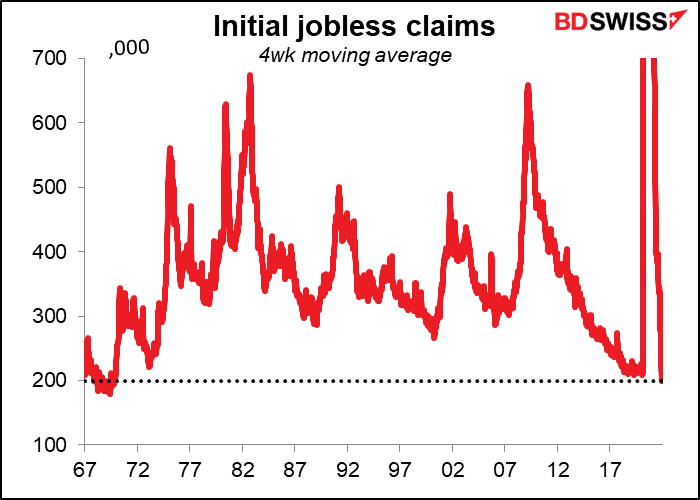
They’re expected to fall by another 3k this week.
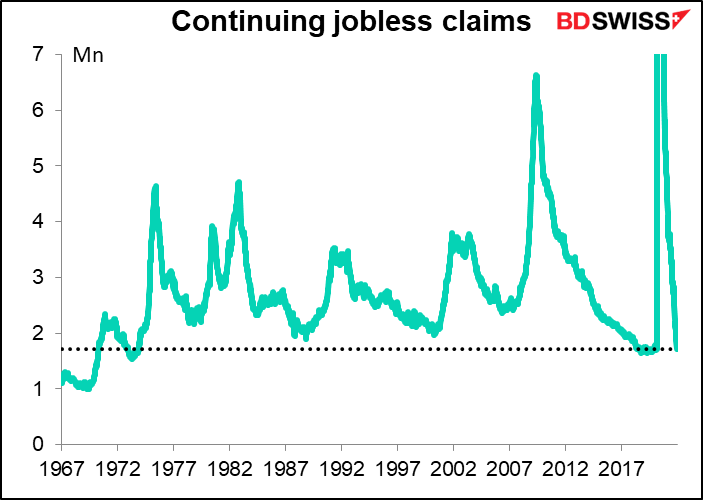
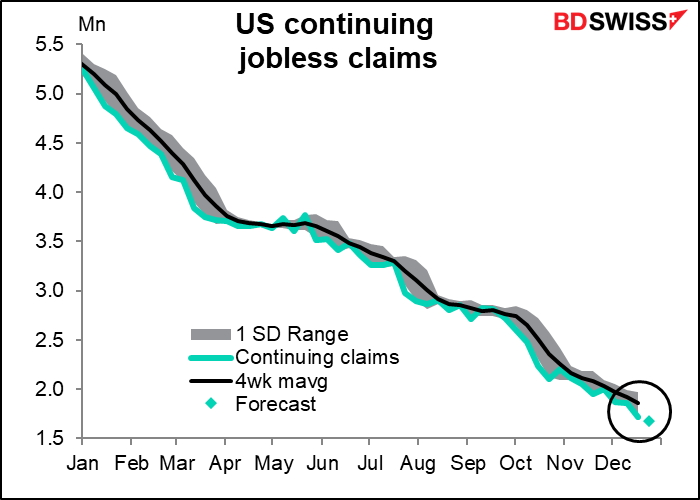
Meanwhile, continuing claims at 1.716mn were back to the level that existed before the pandemic began, which is assumed to be a period of full employment in the US. That was an unusually low level – before then, continuing claims had only reached that level in the late 1960s/early 1970s (when the population was a lot smaller).
They’re expected to decline by another 36k.
Even though they are already at extraordinarily low levels, I suppose that as long as the Fed is still mulling over whether the US has reached “maximum employment,” the employment data will be key.
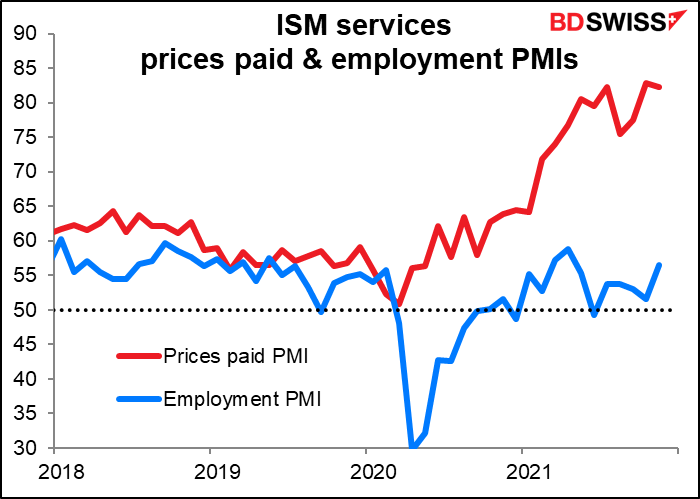
The Institute of Supply Management (ISM) version of the non-manufacturing purchasing managers’ index (PMI) is expected to decline a bit, and why not? The Markit version of this index did during the month. Besides at 69.1 it was at a record high (data back to 1997) so a small decline doesn’t mean that much.
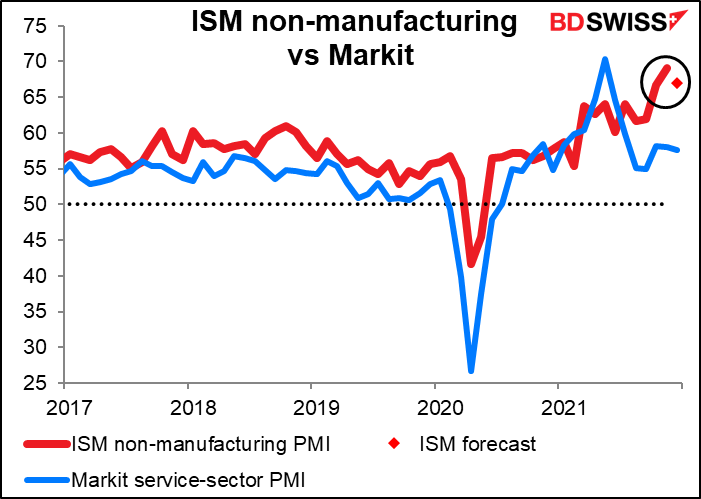
People will also watch the prices paid PMI to get a feel for inflation trends and especially the employment PMI. Most of the people in the US work in the service sector so this is an important indicator of the outlook for employment in the US.
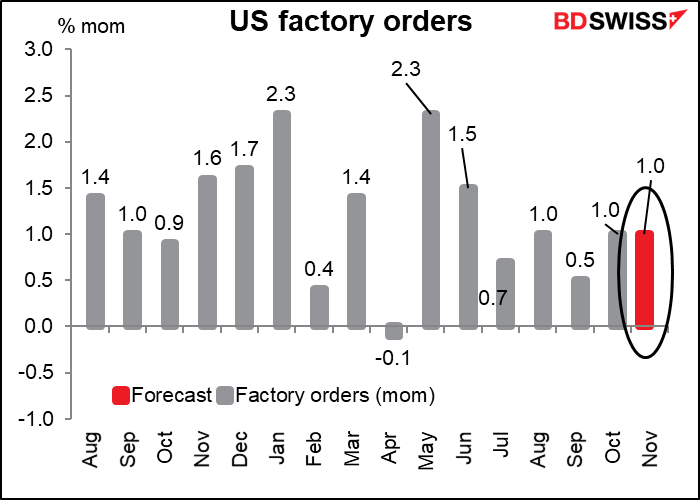
US factory orders are expected to be up a pretty solid 1% mom again. They’re largely a function of the durable goods orders so I can never get too excited about them (unlike German factory orders, which are seen as the precursor to German industrial production).
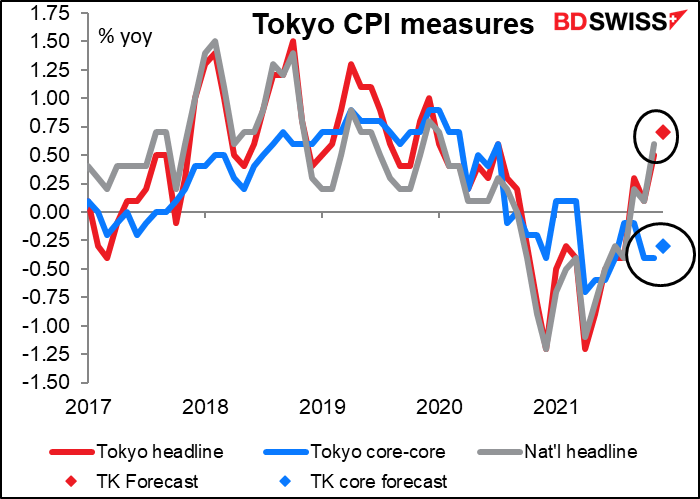
Then overnight we get something from Japan that might be interesting – Tokyo consumer price index (CPI). Japan inflation data hasn’t been particularly interesting since, oh, 1992 or so. But recently, Japan’s producer prices have been soaring a stunning (for Japan, at least) 9% under the pressure of rocketing raw material costs (+75% yoy!!!). The question is, will these higher producer prices start to feed through to higher consumer prices and break Japan out of its 30-year stretch of below-target inflation? That would be a major shift for global finance as it could cause a change in monetary policy in the world’s third-largest economy.
The headline figure is expected to rise somewhat, although remaining below 1%, much less the Bank of Japan’s 2% target. So too is the “core-core” measure, which is equivalent to core CPI in other countries. But the latter is expected to remain in deflation. Part of the reason inflation remains so low is due to the government’s policy of subsidizing hotels, which apparently will lower the headline figure by some 0.3%-0.4%. Government-enforced cuts in mobile phone charges have also pushed down the CPI. Nonetheless, everyone is waiting to see just how long Japan can remain the global outlier in inflation.
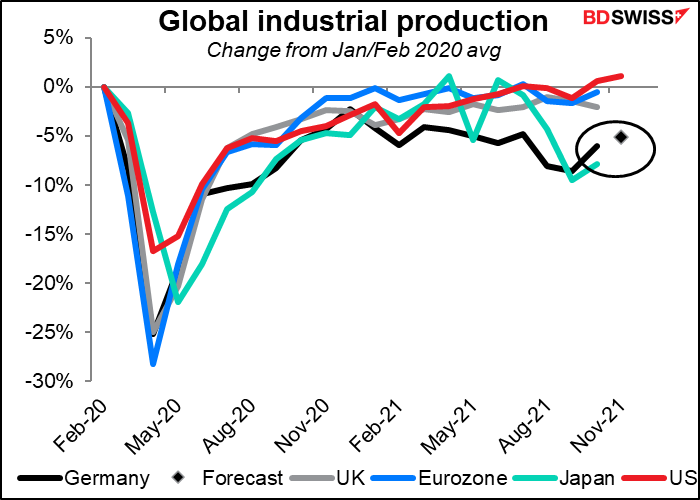
Then we wait for the sun to migrate west and for day to break over the Rhine and Germany to release its industrial production. This goes hand-in-hand with Thursday morning’s factory orders. IP is forecast to be up on a mom basis. It’s been rather sporadic recently.
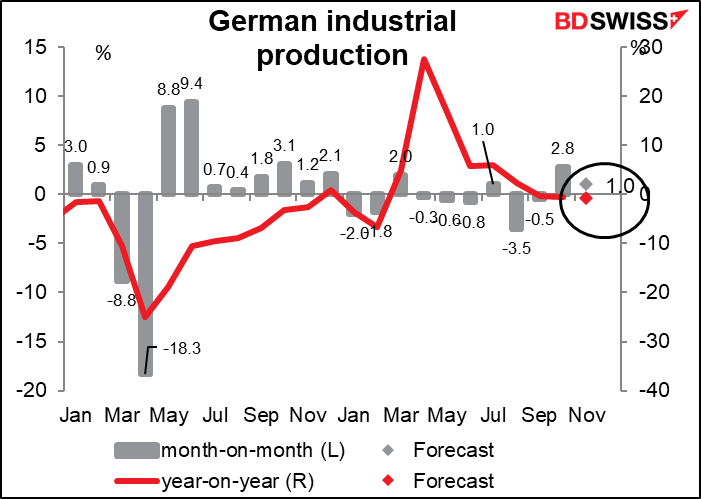
Germany has been an international laggard with regards to IP, along with Japan – two export-dependent economies.
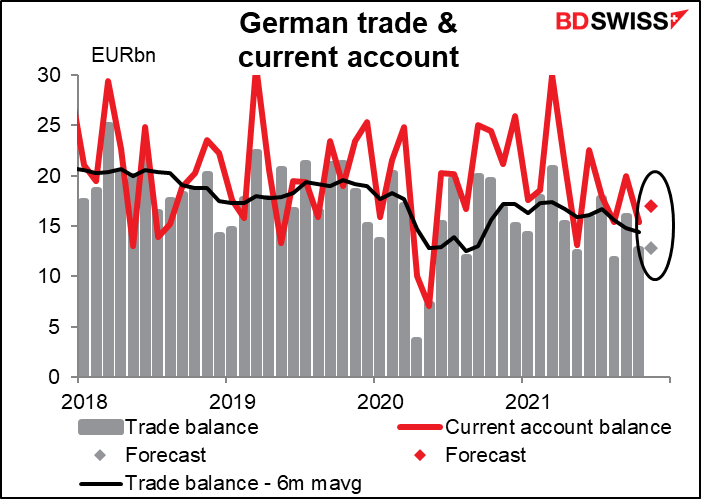
We can see the depressed level of orders in Germany’s dwindling trade surplus.
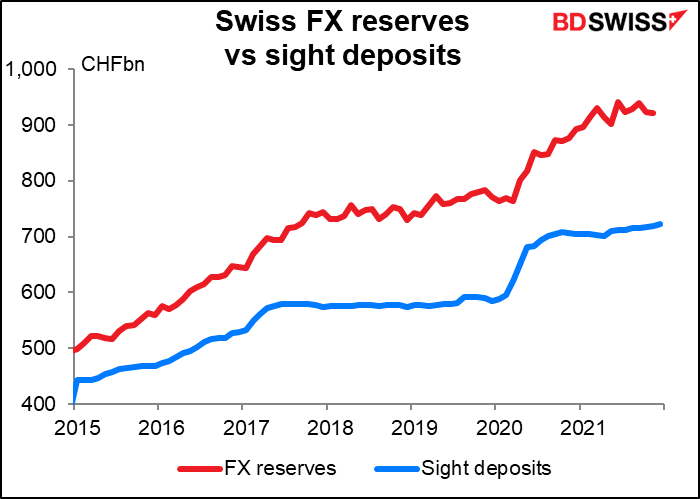
Swiss fx reserves seem to be going up faster than Swiss sight deposits. Is that a function of valuation? Hard to imagine since the Swiss nominal effective exchange rate is at least at a 30-year high (excluding the day or two around when the Swiss National Bank pulled the rug out from under the EUR/CHF floor). Maybe sight deposits aren’t as good an indicator of FX intervention as I had thought. We’ll have to watch this. (No forecasts available.)