Rates as of 06:30 GMT

Market Recap
Interesting contrast! Tuesday the Reserve Bank of New Zealand (RBNZ) hiked by 50 bps instead of the 25 bps that economists were expecting and NZD weakened anyway. Yesterday the Bank of Canada hiked 50 bps as was widely expected and CAD strengthened (USD/CAD declined).

The difference is what comes next. The RBNZ said that the move didn’t change the expected path of rates, just brought forward the moves, and also noted that a larger hike now “provides more policy flexibility,” meaning the possibility of a slower rate hike path in the future or even a cut in rates to deal with the highly uncertain geopolitical environment.
The BoC on the other hand came out unmistakeably hawkish. It not hiked rates by 50 bps but also announced it would end the reinvestment of bonds in its portfolio and would begin reducing the size of its balance sheet (“quantitative tightening, or QT) from April 25th. This was in response to a sharp increase in their forecast for inflation this year from the previous forecast in January and concern about the “increasing risk that expectations of elevated inflation could become entrenched.”

The Bank’s previous forward guidance said “As the economy continues to expand and inflation pressures remain elevated, the Governing Council expects interest rates will need to rise further.” It changed that to a considerably more aggressive “With the economy moving into excess demand and inflation persisting well above target, the Governing Council judges that interest rates will need to rise further.” How much further? BoC Gov. Macklem suggested in the press conference that rates may need to be “modestly above neutral” to bring inflation back to target. They revised their estimate of the neutral rate 25 bps higher to 2%-3%.
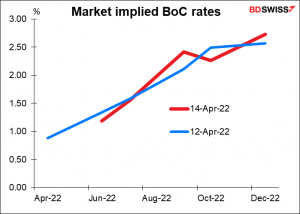
The BoC’s 50bp hike therefore sets the tone for further hikes to bring policy into restrictive territory, whereas the RBNZ’s 50 bps hike gave them the flexibility to pause or even cut rates if necessary. The market now sees Canada’s end-2022 Bank Rate at 2.73%, up from 2.57% on Tuesday. (I don’t know why there’s the dip in October; I think that’s just due to a market anomaly and is probably not a genuine forecast.)
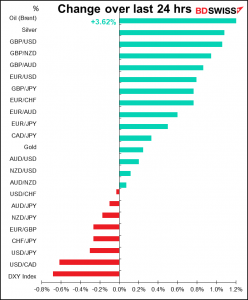
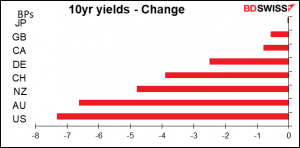
Oddly enough though that plus higher oil prices weren’t enough to propel CAD to the top of my chart today. That honor belongs to the beleaguered GBP, which gained on yesterday’s higher-than-expected inflation data (CPI +7.0% yoy vs +6.7% expected). As a result, the market slightly increased the likelihood of a 50 bps hike at the May 5th meeting. The inflation data also explains why UK gilts barely participated in yesterday’s global bond market rally, making GBP more attractive – and also why USD is at the bottom of the list today.
(I thought that maybe the fact that UK PM Booish Johnson had been fined for attending a gathering during COVID-19 lockdown and was facing another three potential fines for similar breaches sent GBP up on hopes that he’d resign, but it appears I’m wrong…so far. Parliament is currently on holiday – we’ll have to see what happens when MPs return to work next week.)
The rally in bonds poses a puzzle for me because not only were the UK inflation data higher than expected but so too were the US producer prices (PPI) (see table above). The counterintuitive rally in Treasuries appeared to be driven by the squaring of large short positions in 2-year Treasury futures contracts, as also occurred Monday and Tuesday.
Oil rose as the International Energy Agency (IEA) warned that the disruption to world oil supplies from the sanctions on Russia won’t hit the market fully until May, when 3m barrels a day (b/d) of oil will come off the market. Nonetheless it said that lower demand in China, output increases from OPEC+ producers and beyond plus a record draw on emergency oil storage by the US and others ought to prevent any sharp deficit. It expected global supply and demand to balance in Q2.
Today’s market
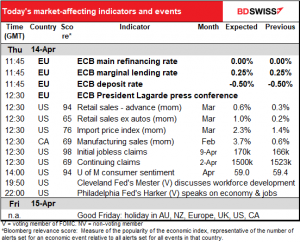
Note: The table above is updated before publication with the latest consensus forecasts. However, the text & charts are prepared ahead of time. Therefore there can be discrepancies between the forecasts given in the table above and in the text & charts.
The big event today of course is the European Central Bank (ECB) meeting – except it’s likely to be not such a big event. As usual, I went over my expectations for the meeting in great detail in my Weekly Outlook, so I’ll just sum up the main points here, which are simple: I don’t expect any news or announcements or changes or anything notable from this meeting. At best they’re likely to reaffirm their commitment to price stability in the face of inflation nearly four times their target rate and emphasize “added uncertainty, added optionalities.” They may discuss creating a new, more flexible tool to deal with bond market dislocations in the future but this isn’t going to be the meeting where they decide on it. No change in anything is likely until the next round of staff projections in June, in my view.
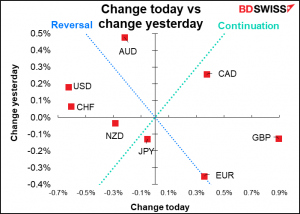
Likely market reaction: weaker EUR The last six times the ECB made no change to any of its programs, the euro weakened after the meeting four times out of six. I think that pattern could repeat this time if, as I expect, they simply reaffirm their existing plans.
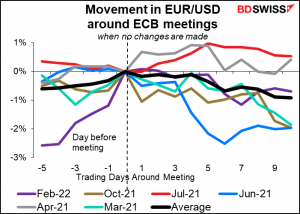
That’s probably because the market is continually revising its forecast for the EUR-USD policy rate spread more and more in favor of the US. When the ECB doesn’t say anything to change that view, EUR/USD slips further.
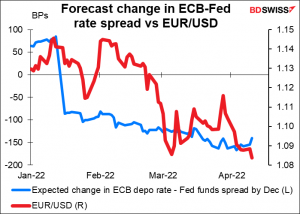
Normally there isn’t any unusual volatility on ECB days unless they make some changes in policy. February was an exception.


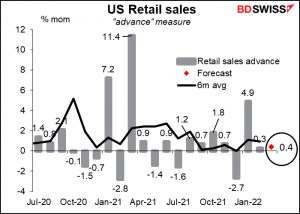
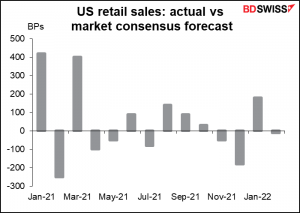
Then, back in the USA, the “advance”, or headline, retail sales figure is expected to suffer from a drop in auto sales during the month, meaning that headline sales are forecast to underperform sales ex-autos.
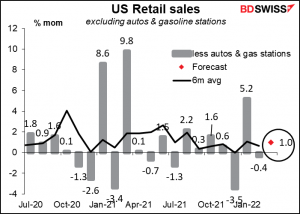
The ex-autos figure is expected to show above-trend growth as will benefit from excluding the drop in auto sales, but that will be to some degree offset by also excluding gasoline (petrol) stations, since the 20% jump in gasoline prices during the month should offset that loss somewhat.
The “control” measure, a further trimmed measure of sales that feeds into the GDP calculation, is forecast to show a very small rise.
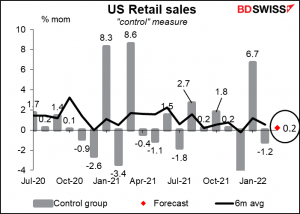
If you’re thinking of taking a position, since the start of 2021 this indicator has beat expectations 7x and missed 7x, so sorry, there’s no easy-to-identify pattern.
US import prices are expected to jump on a month-on-month basis thanks to oil prices, which will just sustain the story that inflation is running rampant.
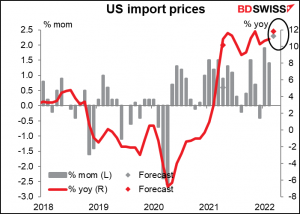
We can hope though that import prices excluding petroleum may start to come down as Monday’s China PPI showed the pace of growth of prices at the factory gate was slowing. It remains to be seen though whether that trend can continue with the lockdowns that are hampering production and delaying shipping considerably.

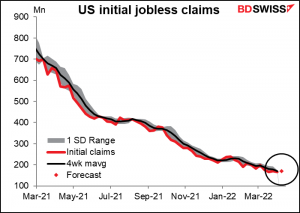
US initial jobless claims aren’t that crucial anymore. Everyone already knows that it’s an extraordinarily tight labor market. Still, it’s encouraging to see claims rattling around their record lows like this. (Last week’s 166k was only a bit above the record low of 162k set in November 1968, when the population of the US was only 60% of what it is now.)
Finally, the dreaded U of Michigan consumer sentiment indices are forecast to fall further. I say “dreaded” in this case because they’re so much below the Conference Board consumer confidence index. That’s because The Conference Board measure is more heavily weighted towards the labor market, which is doing quite well thank you, while the Michigan methodology places more emphasis on longer-term macroeconomic expectations and therefore is hit by inflation worries.
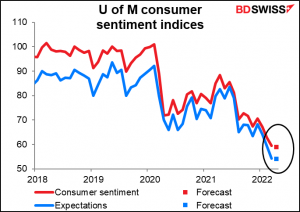
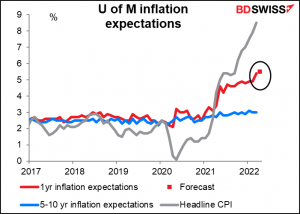
Speaking of which, the U of Fm’s year-ahead inflation forecast is expected to rise only slightly. I’m sure the Fed will be reassured to see inflation expectations peaking, although peaking at over 5% isn’t much of a victory.
