Rates as of 07:00 GMT
Market Recap
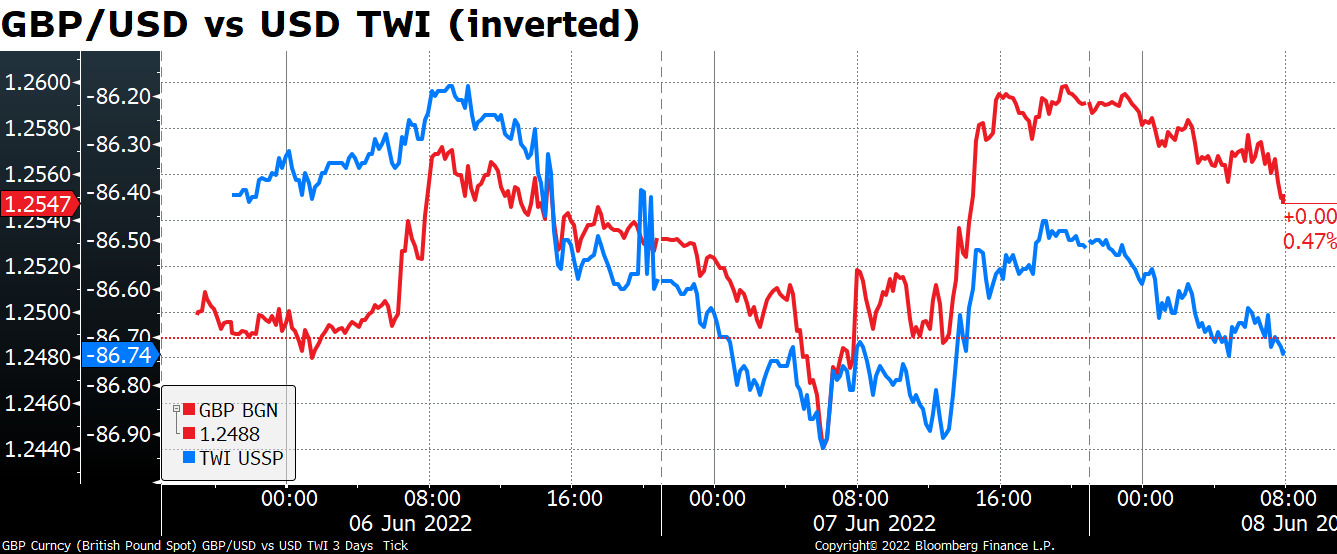
GBP had a volatile day yesterday, ranging from a low of 1.2431 at the start of business in London to 1.2599 in the New York afternoon. It’s come down a bit this morning but it’s still substantially higher than it was Tuesday morning.
The reversal in GBP wasn’t necessarily due to any news out of the UK – there wasn’t any, in fact — but rather due to a reversal in USD. As the graph shows, GBP/USD (red line) generally followed the overall trend for USD as shown by its trade-weighted index (blue line). It may have bounced further simply because it had been pushed down so far by the no-confidence vote on PM Boorish Johnson.
On the contrary, the news about GBP remains unremittingly bad. PM Johnson plans to press ahead with legislation giving him the power to override parts of the Brexit deal. The draft bill may be put forward tomorrow. Reopening this Pandora’s can of worms would be a disaster for the UK and GBP as it would probably result in either a trade war, a legal war, or both with the EU.
The only thing is, markets seem to be focusing on UK monetary policy and not particularly concerned about UK politics. PM Johnson seems safe for the moment, more because as they say in politics “you can’t beat someone with no one” – there’s no one who’s particularly popular among the Conservative Party MPs who would naturally take his place. As for the Nothern Ireland fiasco…well, maybe investors are just tired of hearing about this story, which has been going on for years and years now.
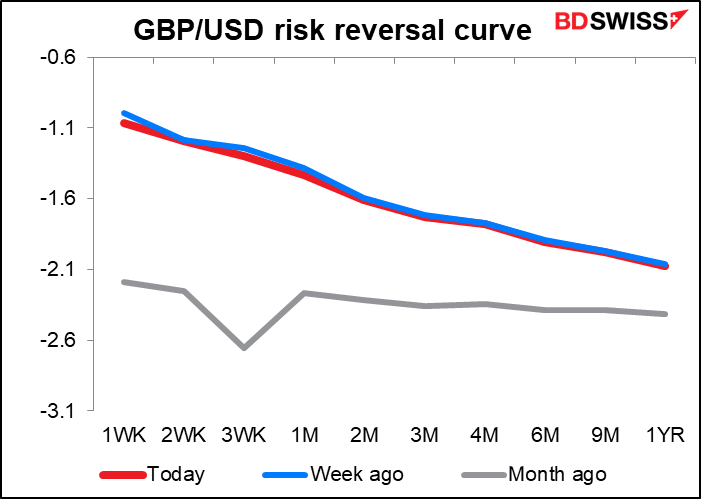
If we look at the sterling risk reversal curve, we note two things: a) the curve has barely changed from a week ago, meaning that the no-confidence vote had barely any impact at all, and b) the near-term risk reversals are higher than the longer-term ones, meaning investors are more concerned about the long-term outlook for sterling than for the near-term (i.e., they either don’t think the UK will withdraw from the Northern Ireland Protocol or they think that even if it does, it won’t have a major effect on GBP.
To me this is remarkable, but maybe it reflects investor fatigue – you can only worry about something for just so long. Brexit has been a theme now since June 2016. People have had enough, I guess.
Risk reversal: a gauge derived from option prices of whether the market thinks there’s a greater chance of a currency pair rising or falling. If the market thinks it’s more likely that the pair will rise, then the RR will be positive; if it’s more likely the pair will fall, then negative. The more positive (negative) it is, the greater likelihood that the market places on the pair rising (falling).
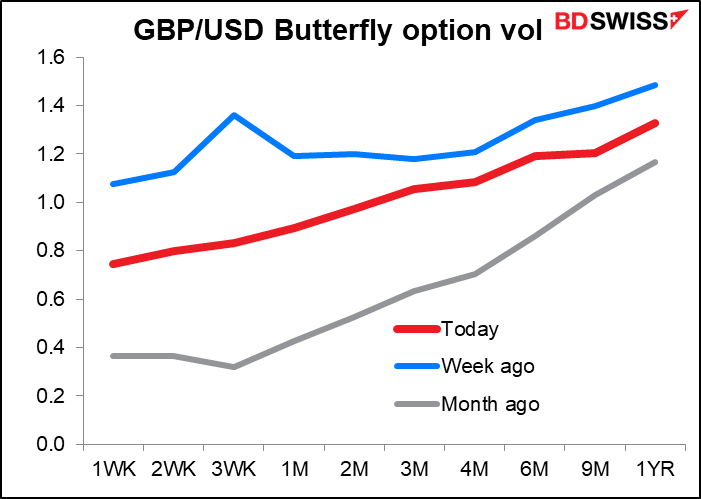
(Having said that, the GBP/USD Butterfly option vol did move down over the last week, which suggests there may have been some caution ahead of the no-confidence vote that is now out of the market. But notice that it’s upward sloping, meaning again that people are more concerned about the long-term outlook for GBP than for the short-term outlook.)
The Butterfly is a measure of the average demand for out-of-the-money options at low and high strike prices compared to those near the forward level. It can be interpreted as the market view of the likelihood of larger moves in the spot price over the next maturity.
CAD seemed to be following oil for much of the day.
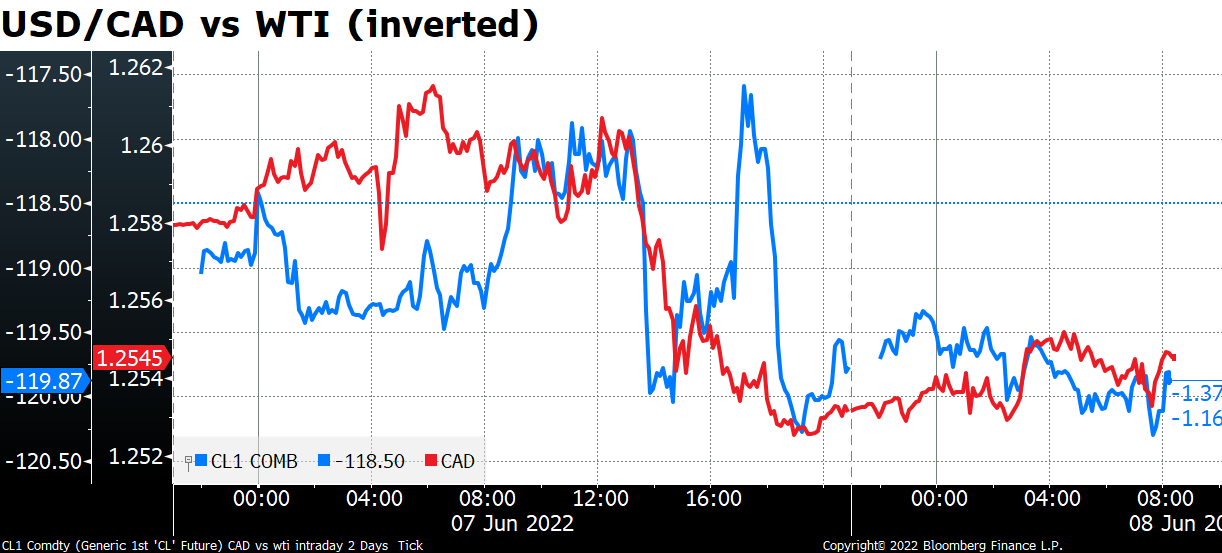
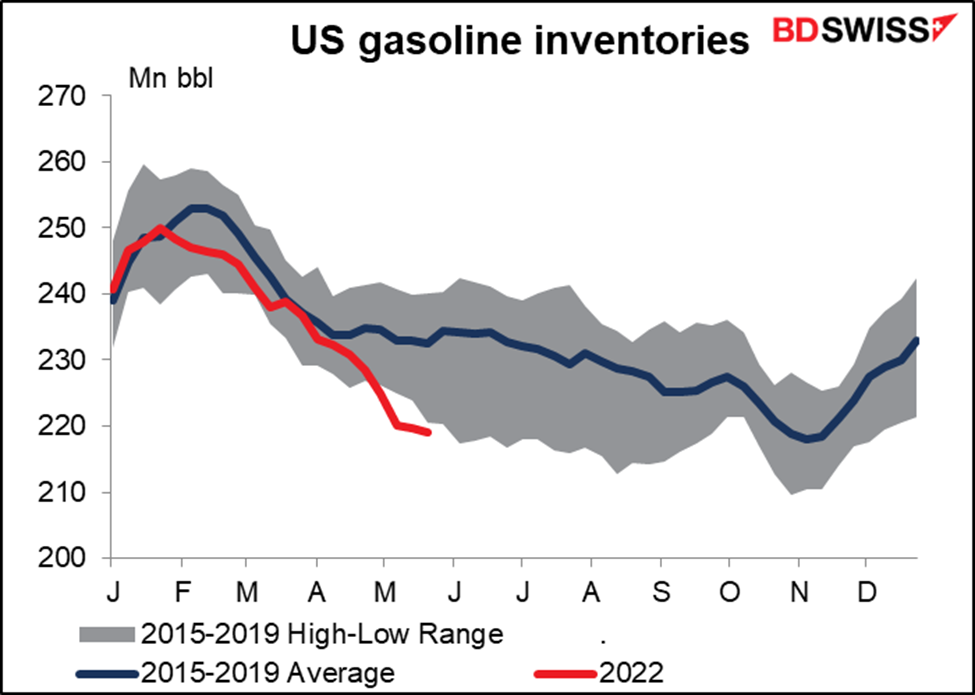
Oil gained as market participants considered the impact of China emerging from lockdown just as the US summer driving season gets underway with inventories far below normal for this time of year.
As for JPY, do I need to explain why it’s falling? It’s the same old story: monetary policy divergence. Verbal interventions from Japanese government officials appeared to have only limited impact. So long as BoJ Gov. Kuroda holds out, JPY is likely to fall further, in my view.
Today’s market
Note: The table above is updated before publication with the latest consensus forecasts. However, the text & charts are prepared ahead of time. Therefore there can be discrepancies between the forecasts given in the table above and in the text & charts.
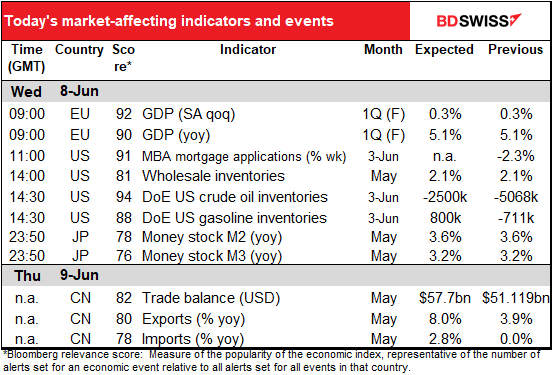
The European day starts with the final revision to Q1 Eurozone GDP. Usually it isn’t revised or if it is, it’s only by 10 bps, so it doesn’t matter (although with the recent gyrations in GDP there have been some larger differences). But I have a graph of it anyway because of course I have a graph of everything. My life revolves around graphs. I dream in graphs.
For example, this graph of the Mortgage Bankers’ Association US mortgage applications. It’s a pretty graph, don’t you think? It also expresses the data better than what’s usually reported, which is the week-to-week percentage change. This shows how this year’s mortgage applications compare to other years. You can see it started out strong but it peaked back in March and now it’s turning into a middle-of-the-road year, consistent with the downturn in home sales that we’ve seen.

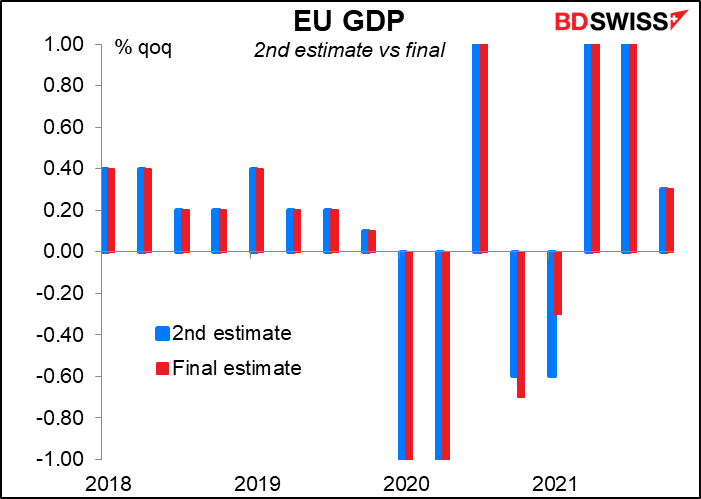
US wholesale inventories are expected to increase at the same pace as they did in the previous month.

Inventories have been growing at the fastest year-on-year pace in the 30-year history of this series. This is one sign that the economy may be headed for a slowdown – eventually wholesalers may need to reduce these inventories, in which case they’ll temporarily stop buying things, which means companies will temporarily stop producing things, and while they’re not producing they won’t be hiring, etc etc.
On the other hand, the inventory/sales ratio is nothing out of the ordinary nowadays so perhaps these high inventories are warranted by the high level of sales. Nonetheless many retailers have commented in their quarterly reports that inventories are excessive, suggesting that it’s only a matter of time before wholesalers start feeling the same way.
The good side of this is that destocking could provide an antidote to inflation if companies have to slash their prices in order to get their inventories under control.

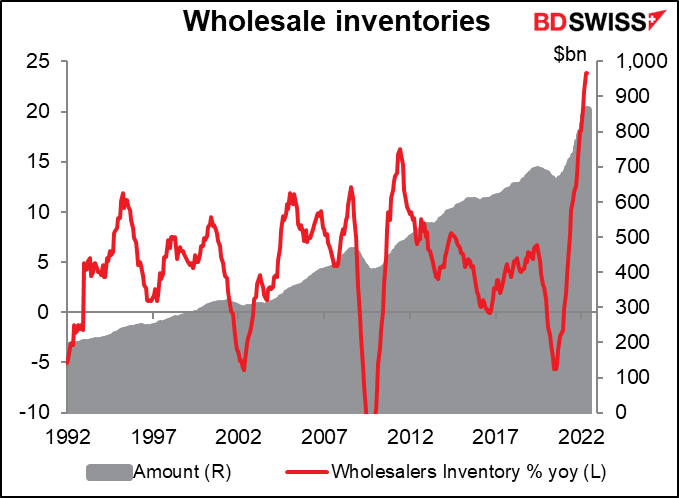
I know you don’t care about Japan money stock but it has a high Bloomberg relevance score so here’s a graph.
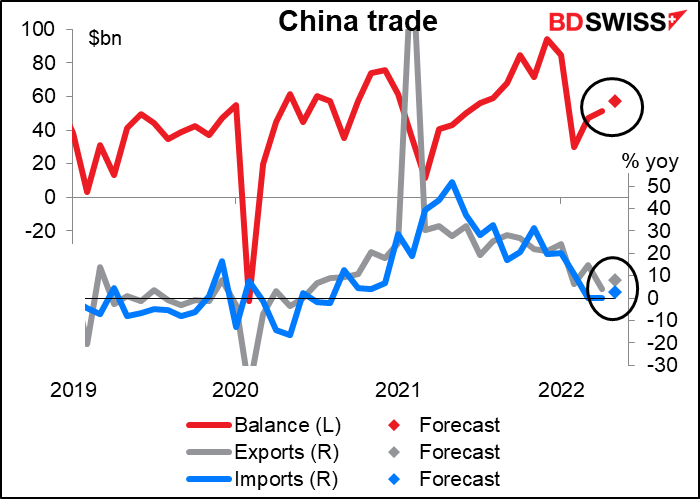
China’s trade surplus is expected to rise a bit as exports recover more than imports. Imports have been flat year-on-year for two months in a row and are forecast to rise just a bit this month, while exports are forecast to be up 8.0% yoy.