Rates as of 04:00 GMT
Market Recap
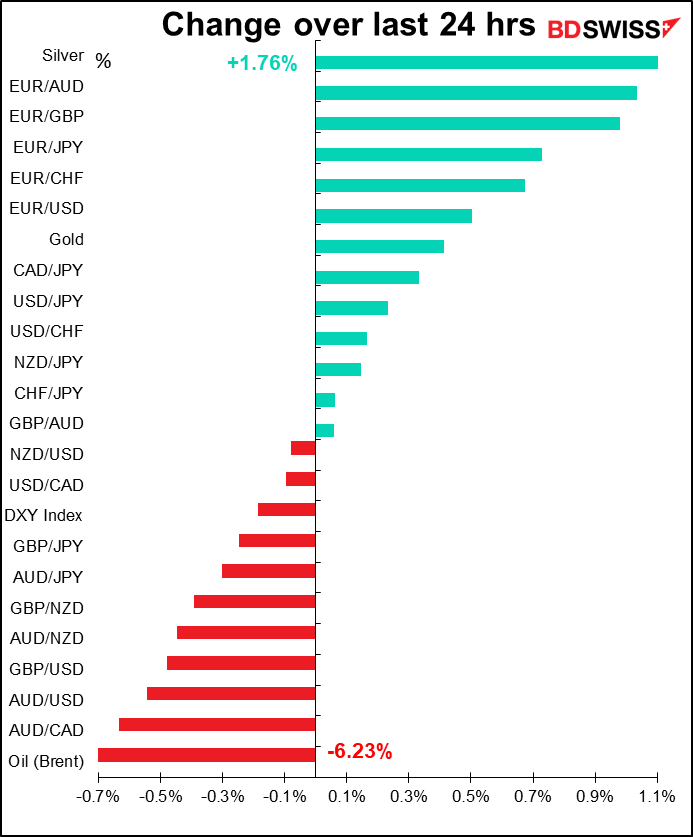
No clear message from the markets today. In the US, it was “risk on” as the S&P 500 regained the 3,000 level and closed above it (3,036.13, +1.48%). Stocks in Asia are mixed however after US Secretary of State Pompeo said that the US no longer considers Hong Kong autonomous from China. The move would be the first step in revoking the special trade status that Hong Kong has with the US and subjecting Hong Kong to the same tariffs, sanctions and export restrictions that it applies to mainland China, although it’s not clear what steps the US is going to take as a result – there are a number of other, lesser moves it could take as well.
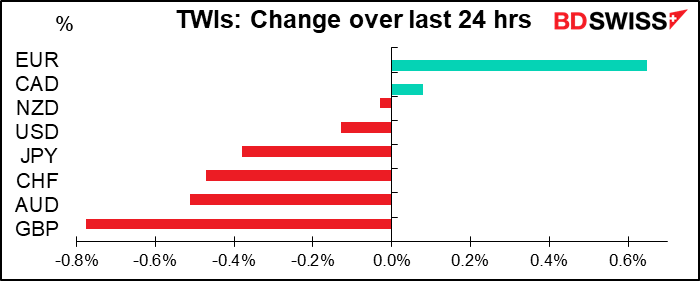
In the FX market, the message was distinctly mixed, with no clear “risk-on” or “risk-off” pattern.
If you remember, yesterday morning we were wondering whether European Commission (EC) President Ursula von der Leyen was going to support the German-French proposal to make a EUR 500bn Rescue Fund that would give grants to countries hit by the pandemic, or whether she would support the “frugal four” that wanted a smaller program that would only lend money. The answer, in true EU fashion, was “yes.” To keep both sides happy, she proposed both: an EUR 500bn program of loans coupled with EUR 250bn of grants. This “Next Generation EU” fund would be paid for at first by borrowing from the bond markets — the first real “Eurobonds,” as these would not be the obligation of any one EU country but rather the debt of the EU as a whole. The money would be repaid by various new taxes, none of which people are particularly eager to pay.
The proposal is just that – a proposal. It requires the unanimous approval of all 27 EU countries, not least because it would require structural changes in the EU budget that need to be ratified by the national parliaments. So far the reaction has been less than unanimous. Nonetheless, the market was encouraged at this positive sign that at the end there would be some EU recovery fund and EUR rallied.
GBP was the worst-performing currency as Brexit problems came to the fore yet again. UK chief Brexit negotiator David Frost said the country isn’t prepared to extend the Brexit transition period beyond the current deadline of 31 December, even as his EU counterpart, Michel Barnier, said Brussels was “open” to a two-year delay. Frost also said that “Policy enshrined in the EU’s mandate isn’t one that can be agreed by us,” i.e. the UK can’t agree to what the EU is asking. The UK hopes that EU countries will change their instructions Barnier, while the EU looks for PM Johnson to either cave in (as he did with Northern Ireland) or ask for an extension. Neither looks particularly likely and a no-deal Brexit remains the most likely option. I remain bearish on GBP medium term, as always.
Oil plunged after the American Petroleum Institute (API) weekly inventory figures showed a huge unexpected build of 8.731mn barrels. The market was expecting a decline of around 1.9mn barrels. Yet CAD was the best-performing of the commodity currencies – perhaps because it’s furthest away from China and the increasing tensions there.
Today’s market
A busier day today.
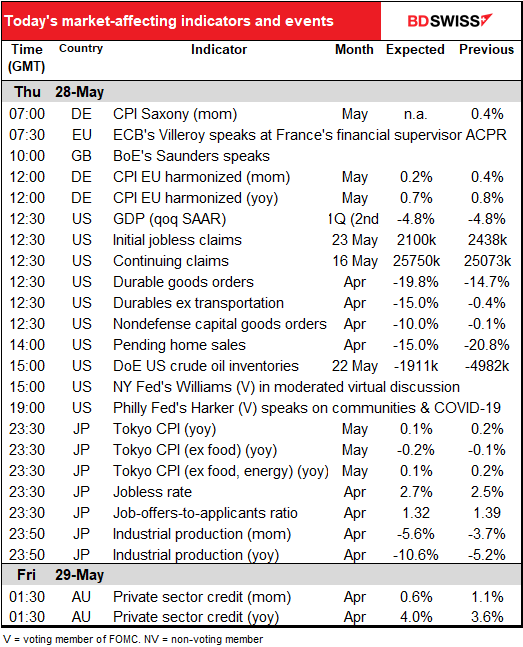
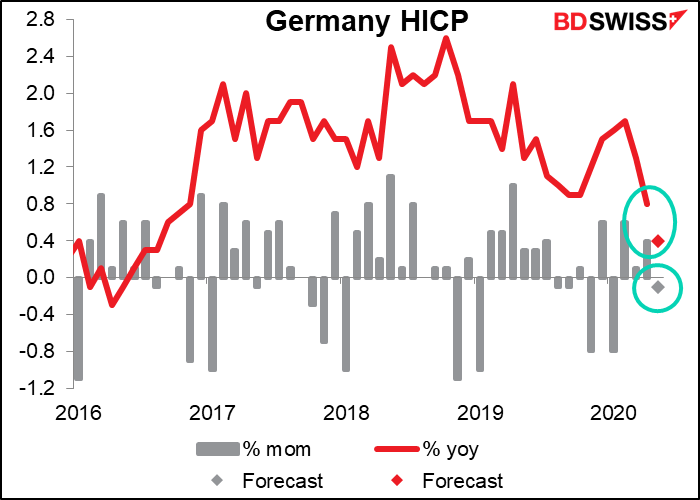
First up today is the German consumer price index (CPI). The ultimate goal is the harmonized index of consumer prices (HICP), which is the national CPI measured the same way for Germany as it is for all the other EU countries. That won’t come out until later in the day. Before then, we get a steady drip-drip of the CPIs for various lander, or states, the first of which is Saxony. There’s no forecast for Saxony, but it’s closely watched anyway, as the national CPI tends to go the same way as it does.
The yoy rate of inflation in Germany is forecast to collapse to only +0.4% yoy, the lowest rate since August 2016 (+0.3% yoy).
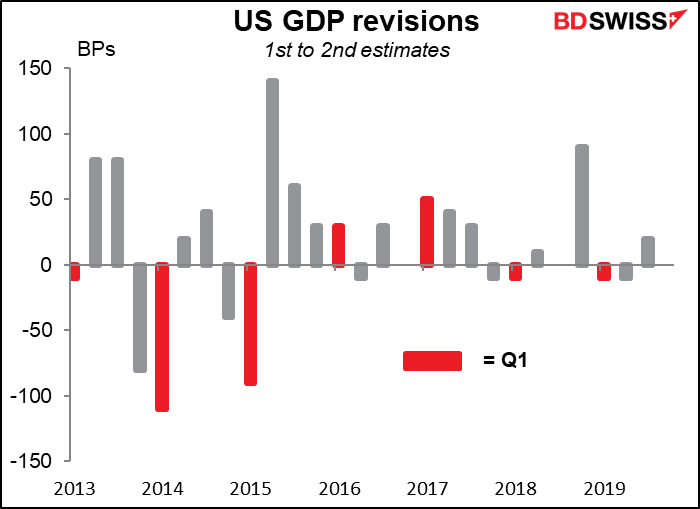
The consensus forecast for the second estimate of US Q1 GDP is that it will be unchanged from the initial estimate. There are a few people going for anywhere from -4.5% to -5.0% or even worse, but the bulk are clustered around the initial estimate. I guess that’s as good as anything when in fact you haven’t a clue, which is understandably the case nowadays. Better just to admit it than to pretend to great scientific accuracy about something you have no idea about. In any case, the last two years have seen very small (-10 bps) first revisions in Q1 so it’s not out of the question that we could see something similar this year.
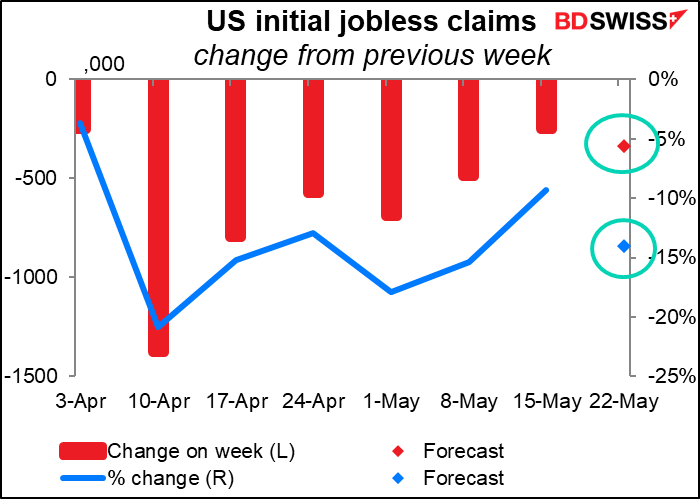
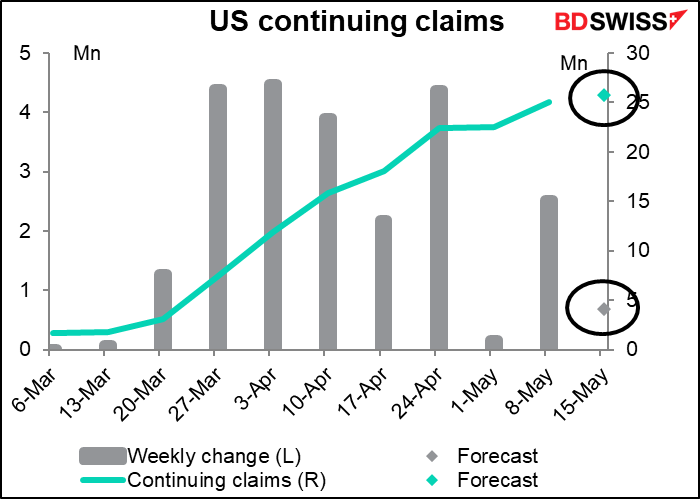
US initial jobless claims, the new pole star of the indicator firmament, are expected to be down only a little bit from the previous week.

This is the trend we’ve been seeing since 3 April and it’s exactly what we don’t want to see. What we want to see is the number of claims falling at an accelerating pace, not a declining pace. That’s a bit what the market is forecasting this week – that claims will be down 338k or 14% from the previous week, vs last week’s decline of 249k or 9%. However it’s hardly a significant change, especially after 39mn people have lost their jobs already.
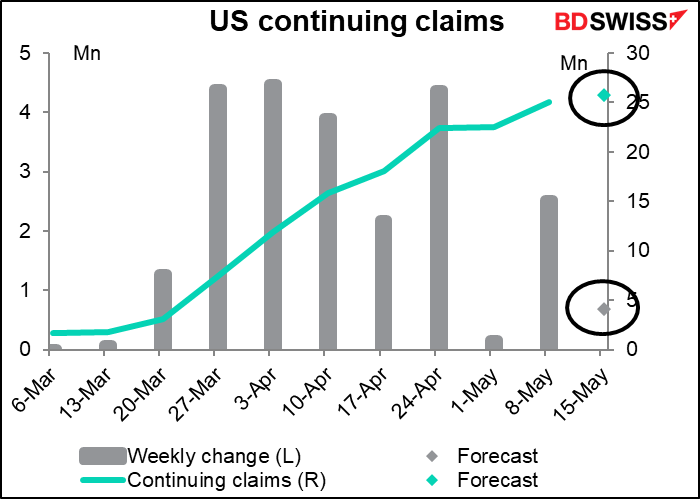
On the other hand, continuing claims are expected to come in at only 677k higher than in the previous week, even though some 2.4mn people filed jobless claims that week. That suggests nearly 1.8mn people managed to move off the unemployment rolls, which is good news. We eagerly await a decline in contininuing claims, too.
US durable goods orders are yet another indicator that there’s no point in making a graph for. The forecast decline of -19.8% mom would of course be a record (previous record: -18.8% mom, occurring in August 2014 and coming the month after the record increase of +23.0% mom in July – this was due to a surge in airplane orders that July that wasn’t repeated in August). In the Global Financial Crisis the worst mom decline was -10.7% in January 2009, but of course that came after a string of declines – the fall then was just strung out over several months instead of being concentrated in one or two months, as it is this year.
Excluding transportation orders, the forecast 15% mom decline would again be a record – the previous record was -10.3% mom in January 2009, followed by -8.9% in Feb 1992.
Not much further to say about this. All the March and April data has been record bad. The question is how the recovery goes, and for that we’ll have to wait for the May data.
US pending home sales is expected to be not as bad in April as it was in March, one of the few US indicators I’ve seen that shows this pattern. For most, it seems that April was indeed the cruelest month. But in this case, the forecast for April is a 15.0% mom decline, vs the -20.8% mom decline in March. Maybe it just shows that once you get down to a certain level, you can’t get much lower.
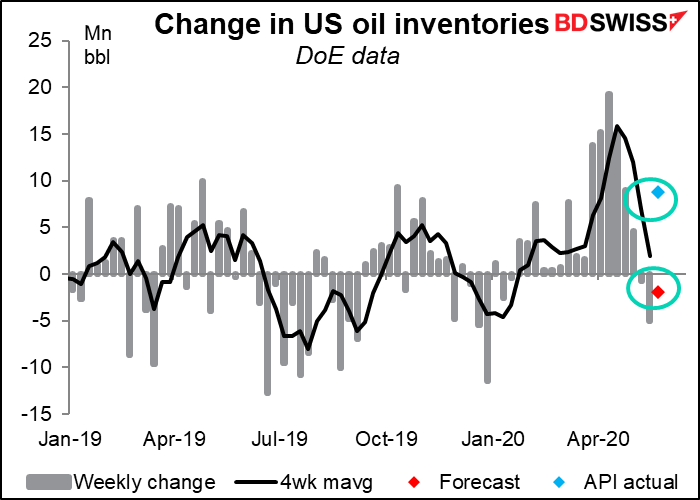
US oil inventories – are they going to show yet another decline? Yesterdays’ data from the American Petroleum Institute (API) showed a huge unexpected build of 8.731mn barrels.
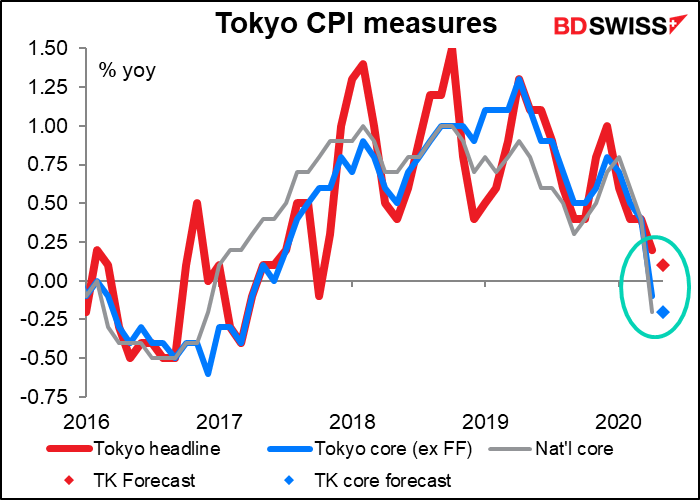
Overnight we get the Tokyo consumer price index (CPI) for May. The national core CPI (that’s excluding fresh foods) fell into deflation in April; the forecast is that free higher education, reduced auto liability insurance premiums, and falling prices on overseas package tours and accommodation fees amid the spread of Covid-19 – probably you couldn’t give them away at that point (Japan had only 2,900 tourist arrivals in April!) The Japan-style core CPI is likely to remain in deflation for some time. The so-called “core-core,” which excludes energy as well, is likely to fall into deflation soon too, IMHO. (That’s the measure that most countries consider to be core inflation.)
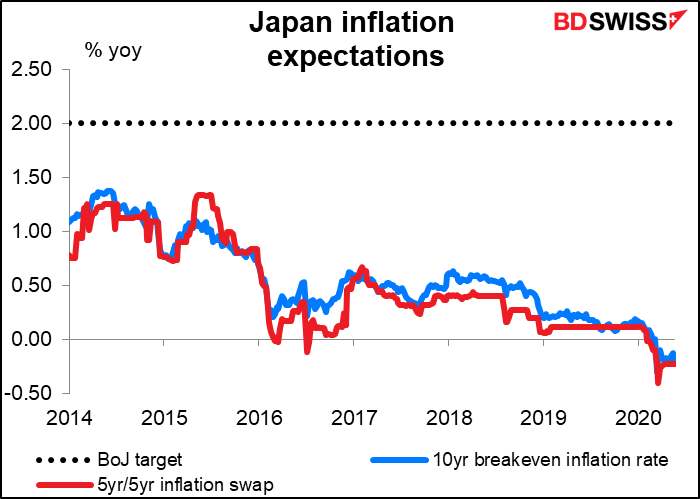
The market seems to think this is a long-term state of affairs for Japan. Both the 5yr/5yr inflation swap – a measure of what people think inflation will be like over the five years starting five years from now – and the 10-year breakeven inflation rate are both negative. After 25 years or so of zero to negative rates, it’s deflation as far as the eye can see in Japan. Makes you wonder if negative rates can in fact get a country out of deflation? Obviously not. But that doesn’t mean higher rates would be better.
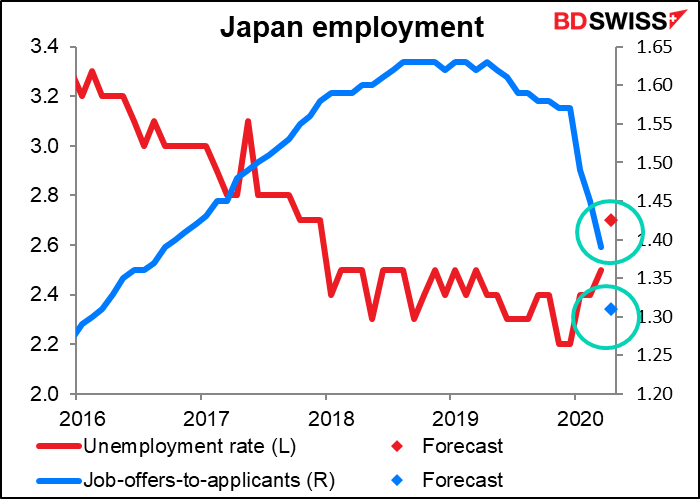
In addition to the Tokyo CPI figures, Japan has its usual end-of-month data dump, including employment data and industrial production.
The unemployment rate is only rising slowly, but the job-offers-to-applicants ratio is falling much more rapidly than it rose. That’s a truer picture of the employment situation.
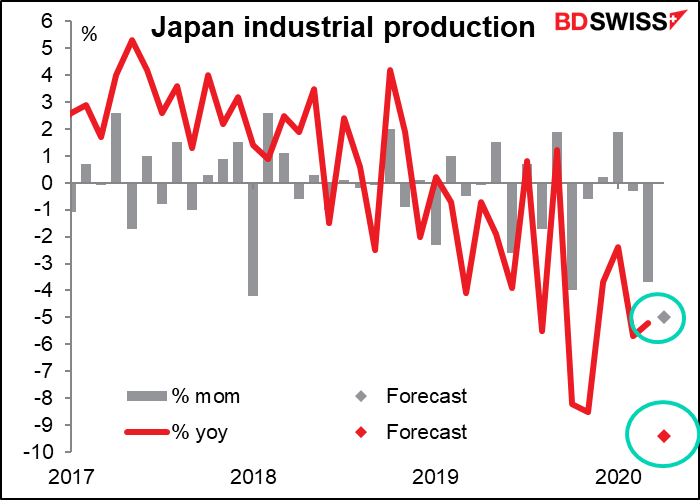
Meanwhile, after the steep 3.7% mom fall in March, Japan industrial production is expected to fall an even steeper 5.0% mom in April. The March forecast survey by the Ministry of Economy, Trade and Industry (METI) based on core manufacturers’ production plans predicted +1.4% mom, but no one expects this now. The decline no doubt goes along with the 22% yoy fall in exports during the month.
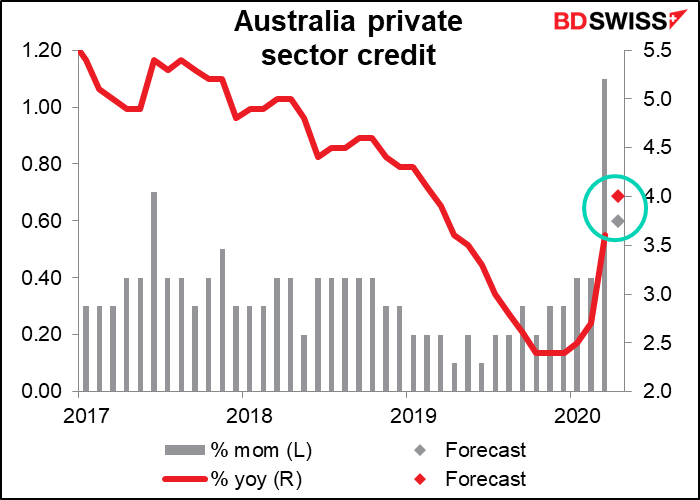
Yet another Australian indicator out overnight: private sector credit. This is one of the few indicators that’s risen because of the virus: firms drew down their credit lines to boost liquidity as it became apparent that their cash flow would dry up. It happened big time in March and probably continued in April, because government payments to firms under the JobKeeper plan didn’t start until May. Also, lending conditions eased and housing loans may have increased as well. In any event, the improvement here is only notable in that it implies companies may have had the money they need to survive. Higher credit doesn’t tell us anything about investment plans, as it normally would.
