Rates as of 04:00 GMT

Market Recap
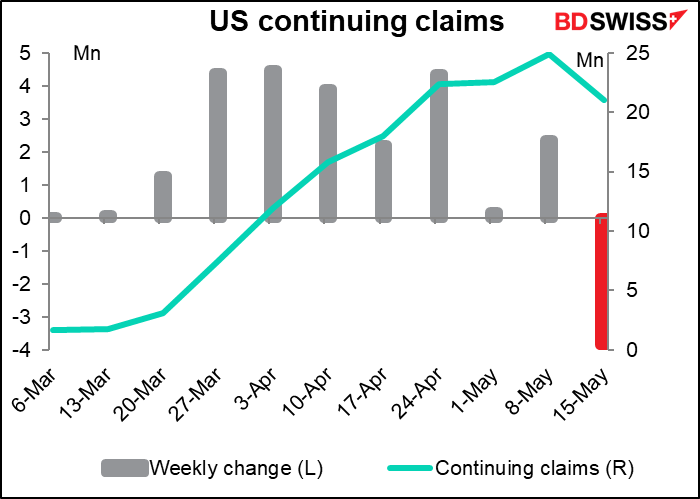
USD down! In today’s topsy-turvy world, this was apparently because of optimism about the global recovery, which boosts the prospects for other currencies. The big news was a big drop in continuing claims for unemployment insurance. What this shows is that even though some 2mn people are losing their jobs every week, a significant number are also coming off the unemployment rolls. This was the figure for the week when the unemployment survey is taken, so it implies a lower-than-expected May unemployment number next month – probably below the 20% or so that people were expecting.
US stocks were higher for most of the day but fell towards the close on news that Trump would make a speech today about China. There are rumors that he may announce sanctions against the country. Between his executive order against Twitter and other social media and now his China-bashing, it’s clear that he’s desperate to deflect attention away from the 100k+ people who’ve died from COVID-19 and his appalling mismanagement of the virus. Polls show that more and more undecided people (how can there be any left in America?) are moving away from Trump. Especially, older people, who are more at risk from the virus and tend to vote more than younger people, don’t appreciate the Trump regime’s willingness to sacrifice their lives in order to get the economy going again.
GBP was slightly higher after UK PM Johnson said he intends to join talks in Brussels for the first time in four months and EU Brexit negotiator Barnier reiterated the bloc’s willingness to extend the transition deadline, which Britain has rejected several times already.
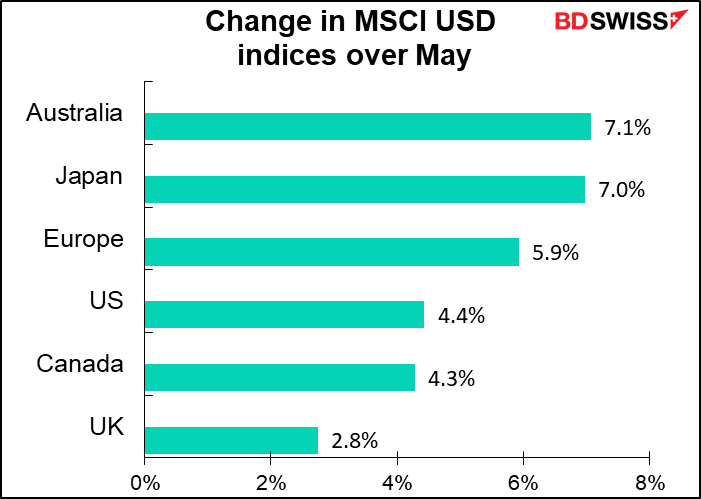
As the month draws to a close today, equity funds have to rebalance their positions. Stock markets were generally stronger during the month, but there were some differences – Australia and Japan were relatively strong, while the UK was relatively weak (in USD terms, that is). As a result, there could be some upward pressure on GBP vs AUD and JPY at around 14:00-15:00 GMT as portfolio managers rebalance and rehedge their positions.
Today’s market
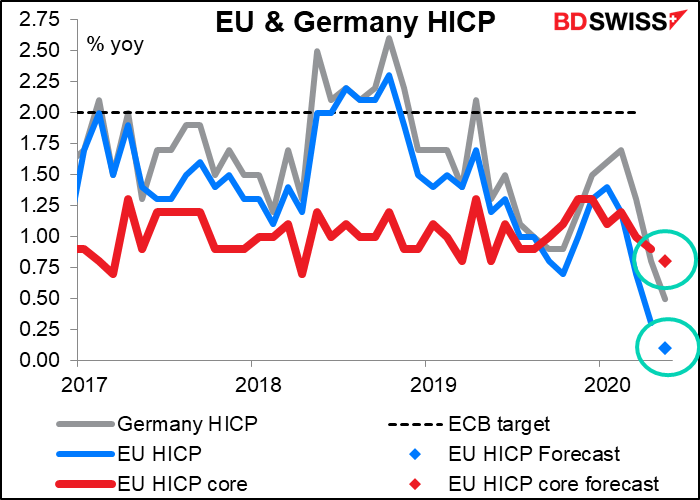
We start the day with the EU consumer price index (CPI). It’s expected to show virtually no increase in prices from the previous year at the headline level. Core CPI – excluding energy, which is what the European Central Bank (ECB) looks at – is expected to slow somewhat to less than half the ECB’s target of “close to but below 2%”.
Yesterday’s German CPI came in a touch higher than expected but still incredibly low, +0.5% yoy vs +0.4% yoy expected, down from +0.8% yoy in the previous month.
The US advance trade figure – merchandise trade only, excluding trade in services – is forecast to be right in line with the trend. It’s nice to see one indicator that I don’t have to remake my graph for! Note that the trade deficit was narrowing but has since started to blow out again. My guess is that the US isn’t exporting much in the way of oil nowadays, which could cause a wider deficit (see tonight’s Baker Hughes rig count).
The fact that the US trade balance has held up so well is perhaps a testament to the fact that it’s fairly well balanced. The US tends to import the same kinds of goods that it exports. So when US exports of manufactured goods fall – as they probably are now – imports of manufactured goods no doubt fall as well, leaving the trade balance little changed.

There’s no point in putting up a graph of Canada’s GDP according to the forecast above (which is the one you should be looking at). It would be just another one of those graphs that goes along looking kind of like a straight line and then plunges downward.Looking at the quarterly profile on Bloomberg, of course people are forecasting a disaster for Q1, but then it’s expected to bounce back strongly in Q2. (Note that this graph is qoq SAAR, which is the way the US announces its GDP.)

The US personal consumption expenditure (PCE) deflator, the Fed’s preferred inflation gauge, is expected to show the second consecutive mom decline. The forecast fall of -0.7% would be the second-steepest on record, after -1.1% in November 2008 (data back to 1959). Meanwhile the core PCE deflator, which is what the Fed looks most closely at, is forecast to slow to just +1.1% yoy, about half the Fed’s target.

The PCE deflators are part of the US personal income & spending data. These are expected to be off the charts, as usual nowadays, with spending falling a lot more than income.

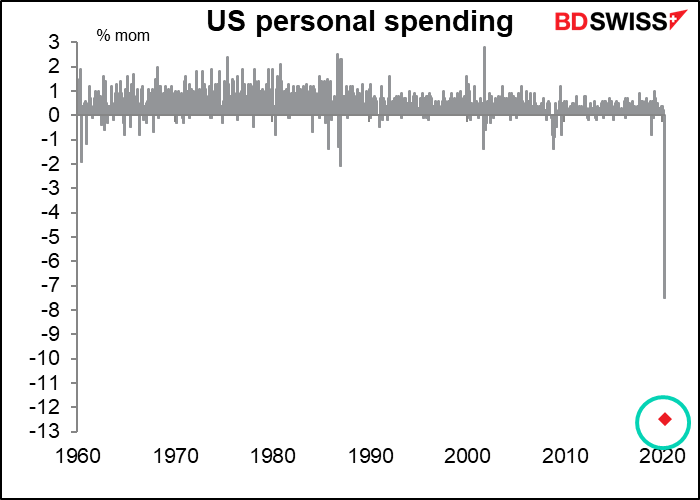
What with the government replacing lost incomes – in many cases, people are making more on unemployment than they were working at their low-paid jobs – and people being forced to stay home and unable to shop, the US savings rate has soared to the second-highest ever in the US (data back to 1959). (I have no idea why it spiked to 17.3% in May 1975 – my guess is a tax rebate or something like that, but I really don’t remember.) I’m sure this won’t last though as people will go out and spend, spend, spend as soon as they can.

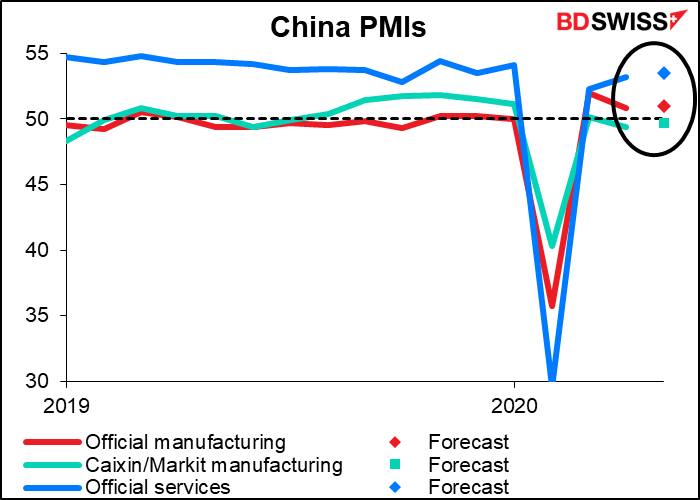
Over the weekend, we get the main purchasing managers’ indices (PMIs) from China: the manufacturing and non-manufacturing ones from the official China Federation of Logistics and Purchasing in cooperation with the National Bureau of Statistics, plus the manufacturing PMI from Caixin/Markit. What surprises me about these is a) how quickly they are all back around 50, i.e. in expansionary territory, and even more, b) what small changes the market is expecting for this month. It’s as if everything is back to normal. Can this be possible? I’m not sure.