Rates as of 05:00 GMT
Market Recap
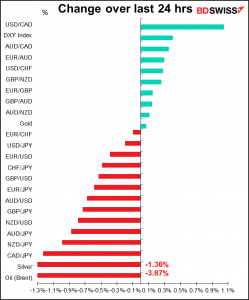
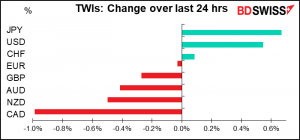
A big reversal day for the commodity currencies & GBP. Alas a terrible day for CAD, which I thought was going to be on a tear!
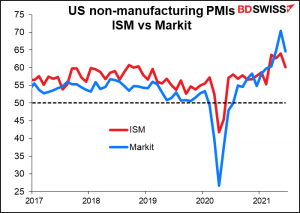
The problem was a big “risk-off” day. The main reason seems to have been a series of misses in the economic data. First German factory orders missed massively (-3.7% mom vs +0.9% expected), as did the ZEW expectations index (63.3 vs 75.2 expected, 79.8 previously). Then in the US there was a surprisingly large fall in the Institute of Supply Management (ISM) service-sector purchasing managers’ index, to 60.1 from 64.0 (63.5 expected), together with a small downward revision to the Markit version of that index. All of this called into question the strength of the recovery.
I must admit I’m kind of puzzled by the big reaction. Although the fall in the ISM index was the biggest drop since the pandemic last year, it’s still well above its historical levels – the highest since Nov. 2018. So the reaction seems exaggerated to me.
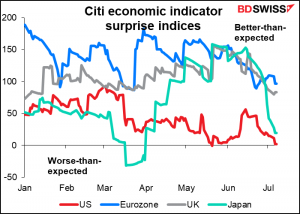
I think the problem is just that expectations were low before and so indicators were beating expectations. But recently people have gotten more optimistic and so expectations have been rising, meaning it’s harder for indicators to beat expectations.
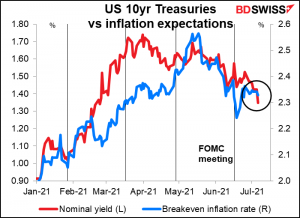
All this weighed on sentiment. Not so much in equities, although both European equities and the S&P 500 close lower. The main movers were in the bond and commodity markets. US 10-year Treasury yields fell 7.6 bps to 1.35%, a four-month low. Inflation expectations fell but only slightly, meaning that real yields fell sharply. There was a similar rally in Europe, with yields on 10yr German bunds -5.8bps, French OATs -5.9bps, and Italian BTPs -6.1bps. The result was flatter yield curves all around.
Commodities were down almost across the board. Partly it was thoughts that the recovery might not be as robust as expected. Secondly, there was something of a vicious circle going – as risk appetite waned, the dollar strengthened, which also weighed on commodities.
Agricultural commodities fell too but for a different reason: the weatherman said rain was expected across the US farm belt. Corn futures were limit down in Chicago as a result.. Gold was the only widely traded major commodity to buck the trend.
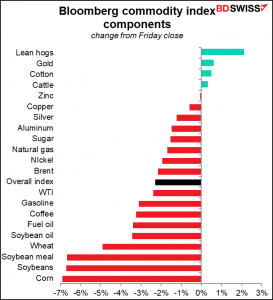
The sharp fall in oil baffles me. There was no progress from OPEC+ to cause the price to fall. On the contrary, Saudi Arabia raised its official selling price for Arab light, suggesting that the kingdom won’t boost supply next month. There is talk in the market of some kind of agreement, with speculation centering around a 400k barrel a day (b/d) increase each month for the rest of the year, but nothing concrete yet.
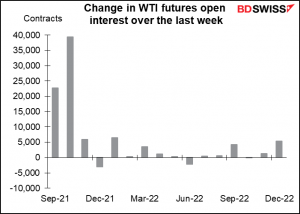
Yesterday I speculated that perhaps US oil producers could step in to make up for the lost OPEC+ production. They might be one of the reasons why the price fell, but not because of increased production. Bloomberg had a story saying that shale companies were not ramping up production to take advantage of the higher prices – rather, they were selling forward on the futures market to lock in the current high prices out of concern that OPEC+ discipline may disintegrate and the current high prices evaporate. I must admit I don’t see it – the open interest (the number of unmatched contracts open) in the further-out contracts hasn’t increased that dramatically.
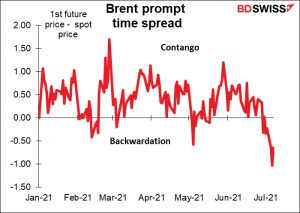
However, it’s clear that there is pressure in the oil market. The prompt time spread – the difference between buying oil for immediate delivery (spot) vs buying the first futures contract (September) has been widening in favor of spot, meaning that oil traders are willing to pay a premium to make sure that they have oil immediately.
If oil does recover its poise, as appears to be happening, then CAD should recover some its losses and outperform today.
Today’s market
Note: The table above is updated before publication with the latest consensus forecasts. However, the text & charts are prepared ahead of time. Therefore there can be discrepancies between the forecasts given in the table above and in the text & charts.
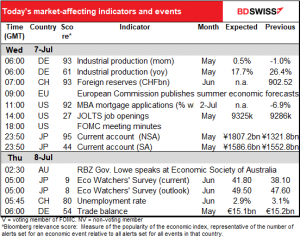
All the European indicators are out already. German industrial production added to the disappointing data at -0.3% mom vs +0.5% mom expected.
We could get some announcement from the European Central Bank’s “conclave” that we discussed yesterday if they reach an agreement, but I doubt if it would come so quickly.
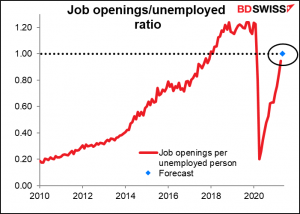
So we wait for the US day to begin and the US Job Offers and Labor Turnover Survey (JOLTS) report. The JOLTS report was popular when Janet Yellen was head of the Fed because she was a labor economist who put some stock in such things. After she left it slipped into the second tier of indicators, if that, but it’s now starting to get more traction as attention focuses once again on the labor market. Job openings hit a record in April and are expected to rise further in May. That would indicate a still-healthy job market, which would be positive for the dollar.
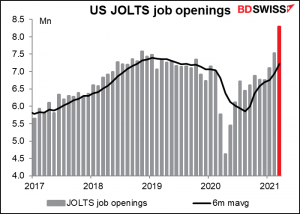
The figure as forecast would be significant. It would mean there’s one job opening for every unemployed person in the country. Some Fed officials have noted this point and used it to buttress their case that we are nearing “full employment” and so can start reducing the extraordinary aid to the economy. (To be strictly accurate, they used the inverse — unemployed people per job opening — but since I spent most of my career in Japan I prefer to think of it like the job-offers-to-applicants ratio.) (I have a little more detail on this topic in my Weekly Outlook, if by some miracle you’re interested.)
Then come the minutes from the June meeting of the rate-setting Federal Open Market Committee (FOMC). Investors will be trying to get some insight into the discussions about policy normalization, especially the dreaded “tapering” of the Fed’s $120bn/month bond purchases.
The first issue is, when to start tapering? From comments made after the meeting, we can see that there are (at least) two sides to the discussion. Dallas Fed President Kaplan, St. Louis Fed President Bullard, and Philadelphia Fed President Harker have said something along the lines of “sooner rather than later.” But New York Fed President Williams, SF Fed President Daly, and Cleveland Fed President Mester have said that they want to see more data – Mester was talking about waiting until September, when she expects to have a clearer picture of what’s going on with the labor market.
There’s a similar debate about how to taper once they decide to do it. The Fed currently buys $80bn in Treasuries and $40bn in mortgage-backed securities (MBS) every month. Some Committee members want to reduce the MBS purchases first, reasoning that the red-hot US housing market doesn’t need any support, while others are focused on overall financial conditions and see the two as pretty much equal.
Another point people will be looking for is some explanation as to why the “dot plot” was revised so sharply – they went from assuming no rate hikes through 2023 to two. In his press conference, Fed Chair Powell indicated that it was because of greater confidence in the upgraded economic outlook. It may also have been due to some risk management – Committee members now see the risks to inflation as definitely being on the upside.
Finally, market participants will look to see if they discussed the order of things, namely, do they have to end the asset purchases entirely before they can start raising rates? The minutes of the November 2020 FOMC meeting said that “most participants” wanted the market to know that asset purchases would end “sometime before” they started hiking rates, as happened after the Global Financial Crisis. Did they reaffirm that view?
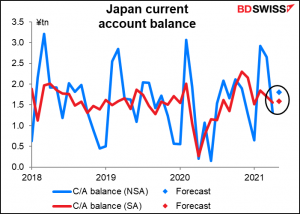
Then that’s it until Japan opens up, at which point we get the Japan current account. It’s expected to be effectively unchanged on a seasonally adjusted basis, which is the figure I think matters. Given that the market doesn’t pay much attention to this figure, a virtually unchanged figure is likely to pass totally unnoticed by traders.
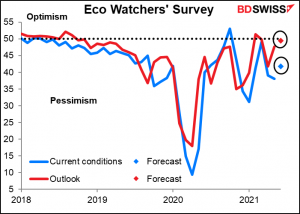
Speaking of indicators that the market doesn’t pay much attention to, here’s the #1 on that list: the Japan Eco Watcher’s Survey, with its Bloomberg relevance score of around 9. I like it because it seems to me to be more up-to-date than the tertiary sector index and more accurate than the service-sector purchasing managers’ index, both of which cover basically the same territory. Both the current conditions and the outlook indicators are expected to rise, with the outlook forecast to hit 49.5 – almost at the 50 line that separates optimism from the relentless miasma of pessimism that the survey has been struggling to extricate itself from. If that occurs, it could signal a recovery in the economy that would be positive for the yen.