Rates as of 05:00 GMT
Market Recap
This week is a good example of how the holiday periods can either be quiet or extremely volatile. This year we’re getting the latter. The wild movement in TRY – the largest one-day moves in a currency ever seen – are just part of it as market sentiment waxes and wanes depending on the latest news about the Omicron variant. Yesterday was a day of waxing (growing) as three studies showed that Omicron may be less harmful than the previous strains of the virus. (Nonetheless if it infects enough people, it could still hospitalize more people: 1% of 1,000 people is twice 5% of 100 people.)
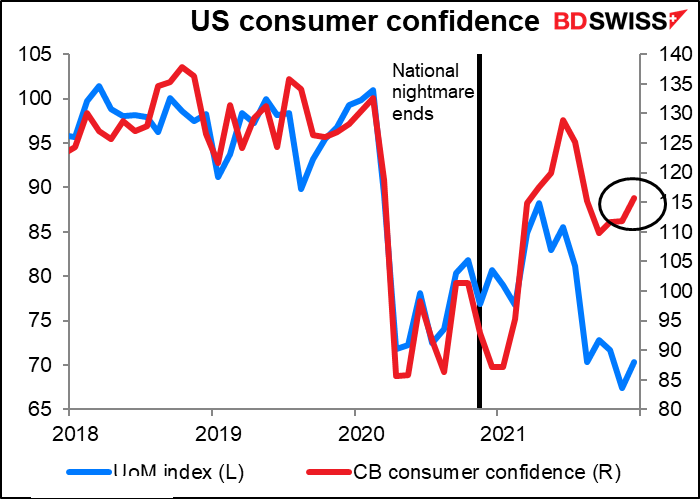
The Conference Board’s measure of US consumer confidence rose to 115.80 from 111.90. It had been expected to fall to 111.0. This confirmed the upturn in sentiment seen in the U of Michigan survey.
Stock markets (almost) everywhere were higher (except Brazil), with the Euro Stoxx 50 and S&P 500 both up 1.0% and NASDAQ +1.2%. This morning the rally continues as the Nikkei gained 0.8%, Hang Seng +0.4% and CSI 300 -07%. The S&P 500 is expected to open slightly higher still (+0.1%).
AUD is as usual the flag-bearer for bullish sentiment about the world economy. Oil and other commodities gained, sending CAD higher as well – I’m kind of surprised that CAD underperformed AUD, given the further rise in oil prices yesterday. But looking at weekly data, USD/CAD has a beta vs oil of some -0.041% and AUD has a beta of 0.045%. So even though USD/CAD’s correlation with oil is much higher than AUD/USD’s (-0.31 vs +0.20), AUD tends to move a bit more with oil than CAD does – just not as reliably, as far as I can interpret the data (I was a History major, not a math major, unfortunately.)
GBP gained from the get-go. I’m a bit confused here as to why, though. Bloomberg said it’s because the UK Office of National Statistics estimated that the UK economy has recovered from the pandemic faster than previously thought – the ONS revised the back data and found that GDP is now 1.5% below the end-2019 level, not 2.1% as previously thought.
Congratulations and all that, but from where I sit, the Q3 figures were pretty bad. The qoq figure was revised down even though the yoy figure was revised up. (There were 26 economists forecasting the qoq figure but only 19 forecasting the yoy figure, so they are different pools of estimates. Furthermore, as I mentioned, the year-earlier figures were revised, although from my way of thinking, if the year-earlier figure was revised up, then the yoy rate of increase should be less, no?)
Looking at the composition, private consumption was revised up but government spending and investment were both revised down into falls rather than rises – a negative development. And exports were also revised down.
I think this may just have been an excuse to close out positions ahead of the holiday weekend and year-end and relax. Next year everyone can come back to work and return to their favorite hobby of shorting GBP.
No comment tomorrow. Merry Christmas to those celebrating the holiday!
Today’s market
Note: The table above is updated before publication with the latest consensus forecasts. However, the text & charts are prepared ahead of time. Therefore there can be discrepancies between the forecasts given in the table above and in the text & charts.
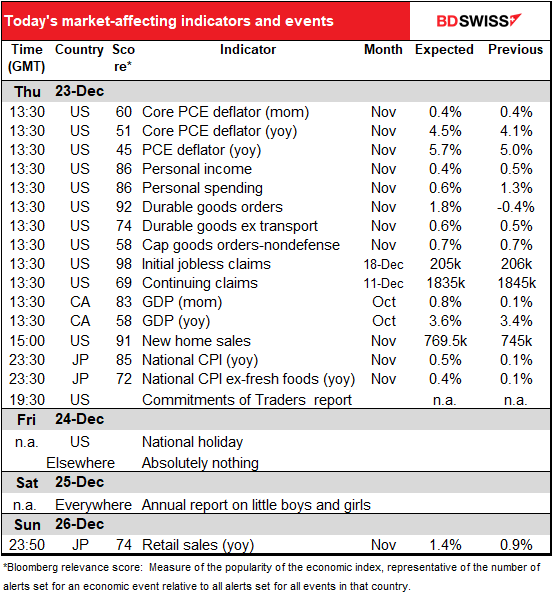
OK, finally! Some big indicators out today. Nothing during the European day, but when the North American day starts up there will be a veritable storm of indicators. (I won’t say what kind of a storm.)
The most important ones IMHO are the US personal consumption expenditure (PCE) deflators. These are the Fed’s preferred inflation gauges, although the market tends to look more at the consumer price index.
The November consumer price index and producer price index showed that inflationary pressures have broadened out as rents and health care services prices are now rising rapidly on top of continued price pressures in supply-sensitive sectors such as autos. As a result, the headline PCE deflator is forecast to leap to 5.7% yoy, the fastest rate of growth since July 1982. The core figure is forecast to rise significantly as well to the highest rate since November 1983.
With the Fed already having announced an increase in its taper, I’m not sure that a figure like this can move the needle any, but it is likely to reassure people that the Fed will have to start tightening soon – that it may move to “lift-off” shortly if not immediately after it ends its bond purchases. That’s likely to be positive for the dollar.
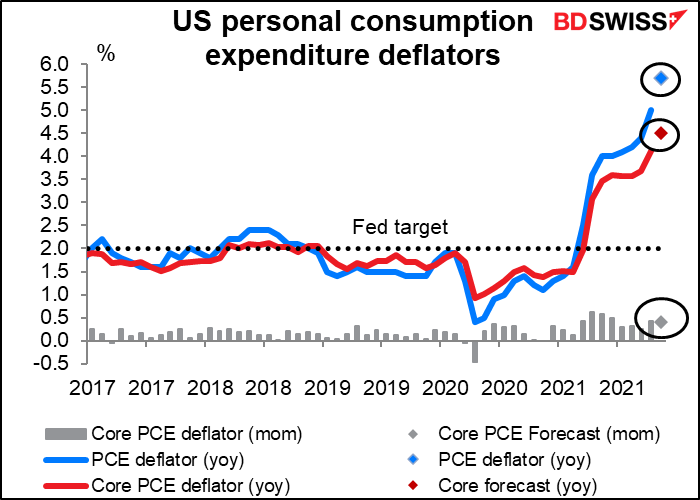
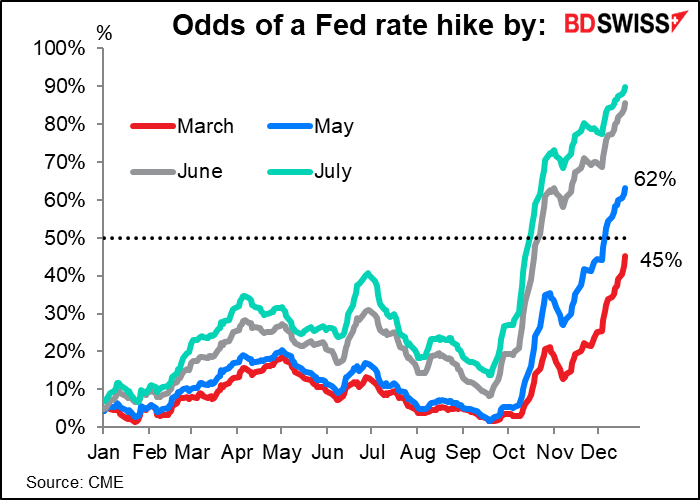
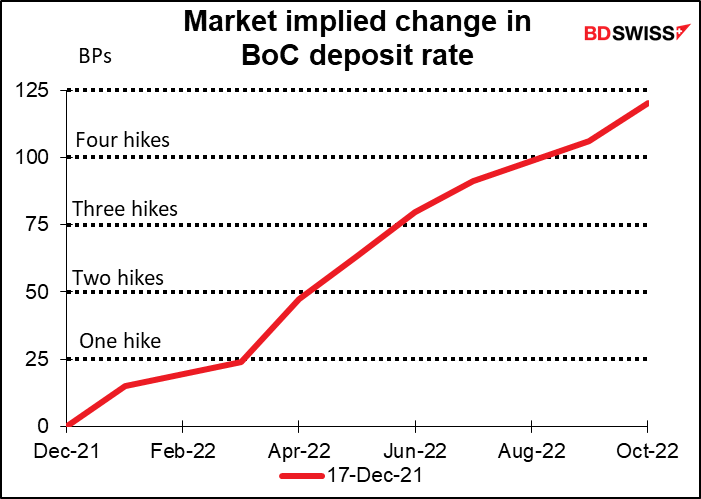
The market now puts a 62% probability on a hike in May and a 45% probability on a hike as early as March!
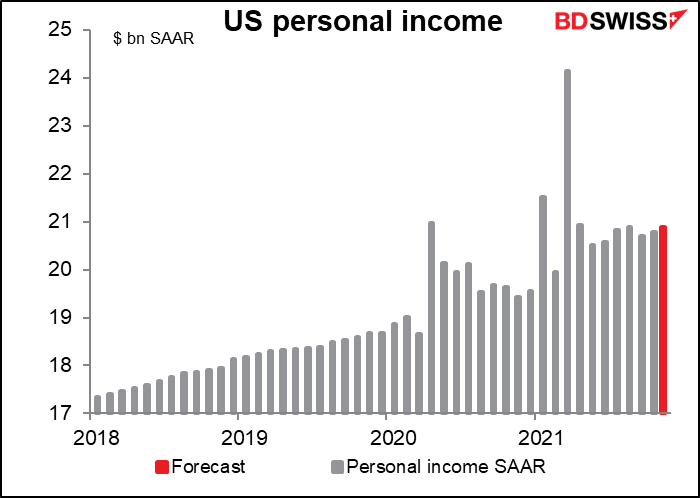
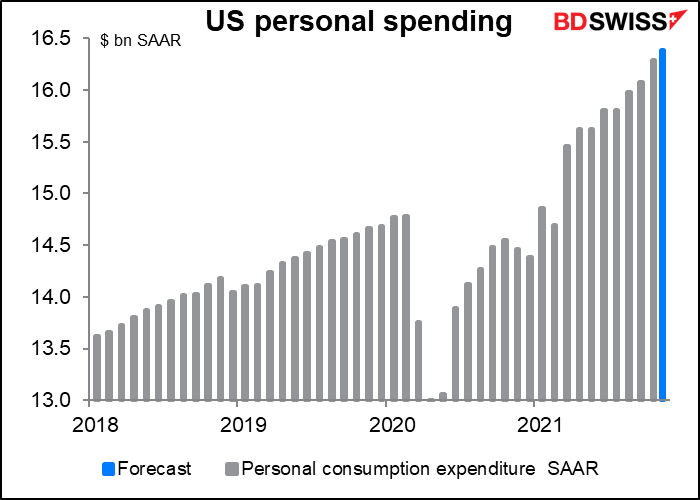
Personal income and spending are forecast to rise 0.5% mom and 0.6% mom respectively (which is why it looks like there’s only one dot on the graph).
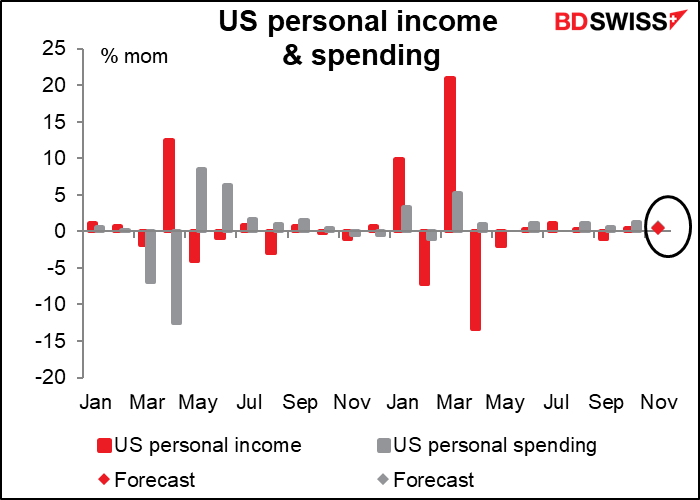
That would put incomes 10.3% above their pre-pandemic level and spending 10.9% higher – quite enough to continue fuelling the US economy. This may reflect the continued rise in pay rates and the upgrading in jobs as people leave lower-waged work for higher-waged.
US durable goods orders are expected to be boosted by orders for 109 planes at Boeing.
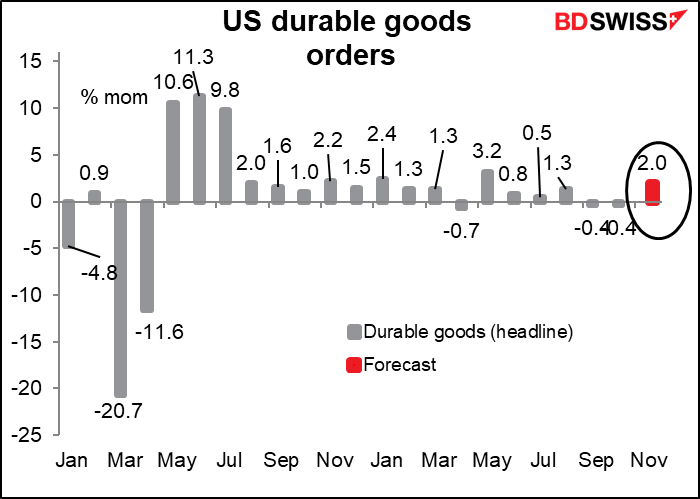
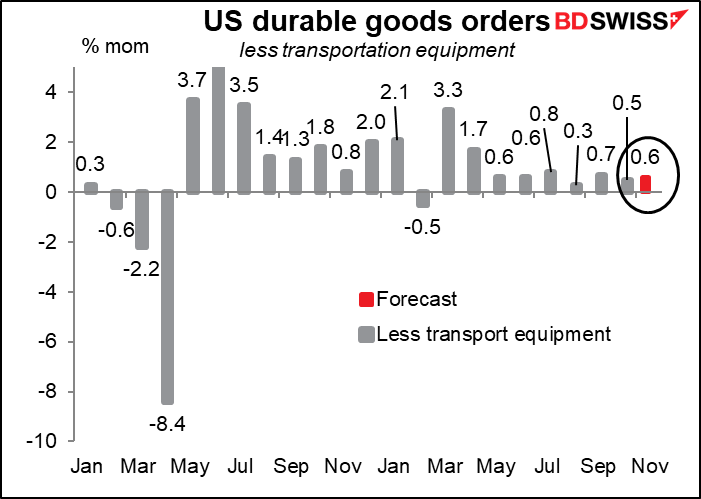
Excluding transportation equipment, orders are still expected to be pretty healthy. Rising prices are signaling a supply/demand imbalance to companies, which are responding by investing in more equipment to produce more goods. That should eventually help to tame inflation; right now, the additional demand is a further boost to the US economy.
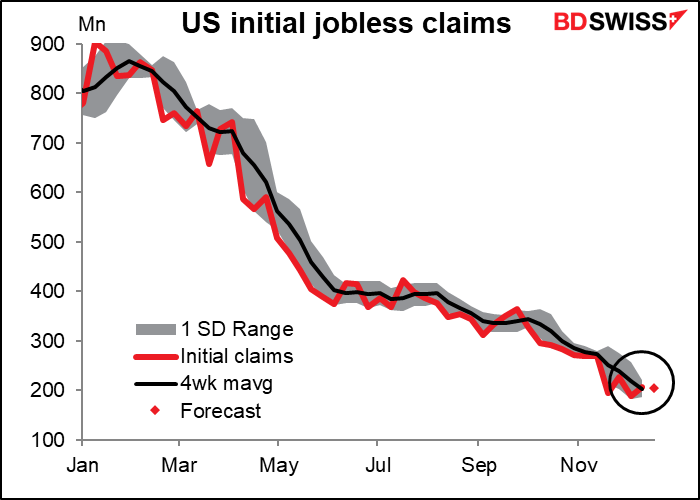
The weekly US initial jobless claims are forecast to be approximately unchanged. This follows some large-scale volatility recently: -76k, +33k, -39k, and +18k. Perhaps economists figure that no one gets fired in the week or two before Christmas. Hahaha that’s a joke. No one working at an investment bank has any such illusions.
In any case, with initial claims around the 200k level, they’re back to normal (2019 average was 218k, 2018 average was 220k) so perhaps we can’t expect them to decline much further. The standard deviation in 2019 was 7 and in 2018, 9, meaning the usual change was ±7k in 2019 and ±9k in 2018. That’s probably what we’ll revert to fairly soon.
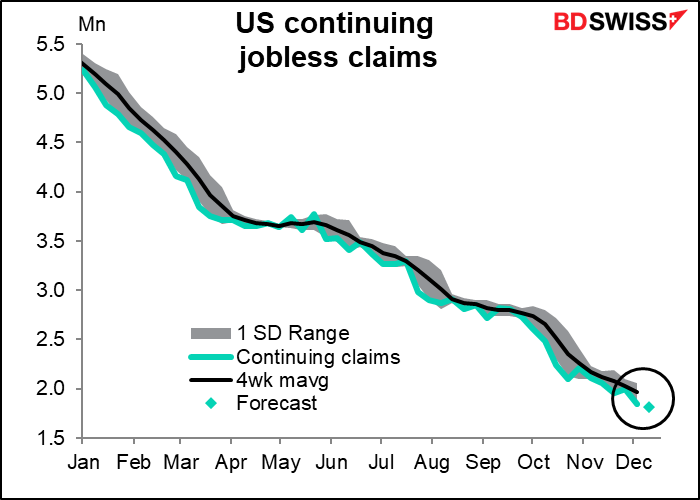
Continuing claims on the other hand are expected to continue their inexorable decline.
Canada’s monthly GDP is yet another Canadian indicator whose market impact will be dulled by the existence of an early official “flash” estimate, in this case +0.8% mom. Guess what the market consensus forecast is. Curiously enough though not all forecasters are going for 0.8% — only eight of 14. There are four estimates below and eight above. Brave people! Looking at the preliminary figure, it appears that supply chain disruptions in the auto sector eased, at least temporarily, and auto sales rebounded following a sharp decline in September (though they’re still far below the like year-earlier month). Retail and wholesale sales each increased by roughly 1% mom, according to the preliminary estimates. Plus oil sands extraction in Alberta was up too.
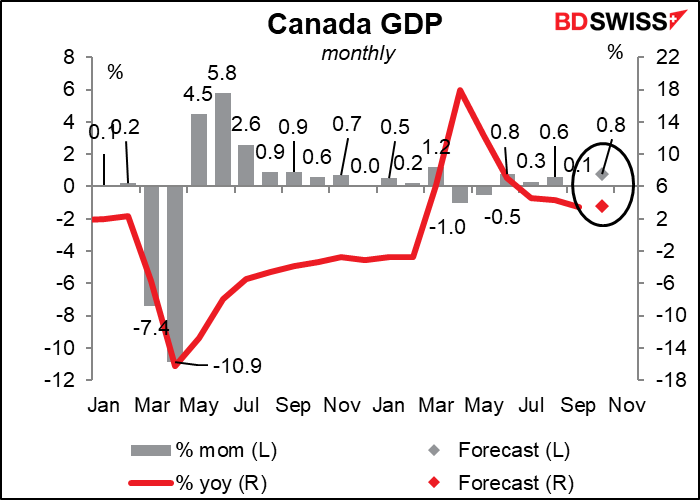
The Bank of Canada has stopped its quantitative easing program and said that it would probably start raising rates “sometime in the middle quarters of 2022.” Strong growth like this would tend to confirm the market’s estimate of a rate hike in March. That would probably be positive for CAD.
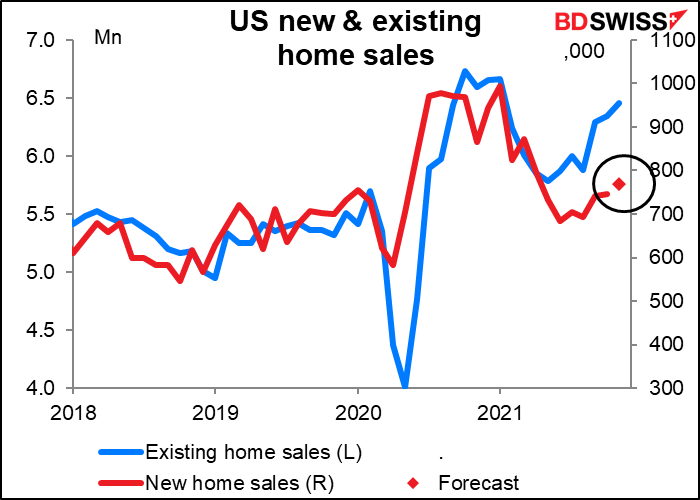
US new home sales are expected to be up 3.4% mom. This compares with the 1.9% rise in existing home sales during the month (the forecast was for a 3.0% rise).
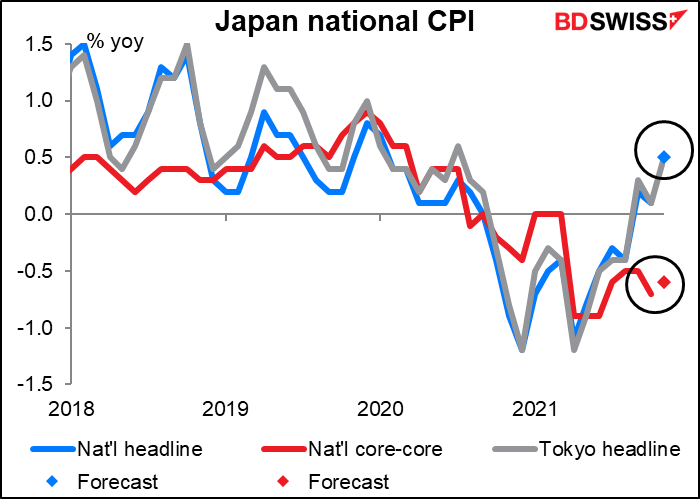
Finally, overnight we get the Japan national consumer price index (CPI). Usually this is dull as dishwater (or in the Japanese context perhaps we should say “all the pizazz of cold pizza,” a line that US political analyst John Neuffer applied to politician Keizo Obuchi back in 1998 when Mr. Obuchi was in the running for PM. The line stuck – after becoming PM, Obuchi pointed out that “pizza can be heated up” and at least once came out of his house and handed out cold pizza to the waiting journalists.)
The headline figure is expected to rise to +0.5% yoy, the same as the Tokyo headline measure. But the Bank of Japan’s “core-core” measure, which in other countries would be referred to just as “core CPI” (it excludes fresh food & energy, whereas the Japan-style “core” measure only excludes fresh food) is expected to remain well in deflation at -0.6% yoy
The question is, how long can Japan remain an outlier as inflation rates rise around the world? Japan’s producer price index has been soaring recently as raw material prices are up an astronomical 75% yoy.
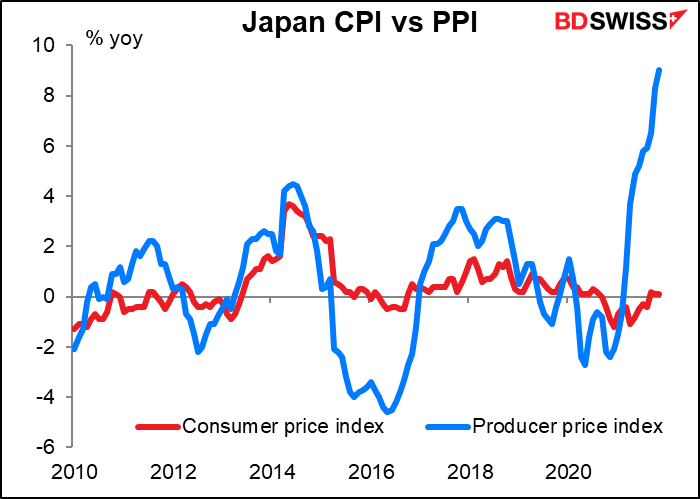
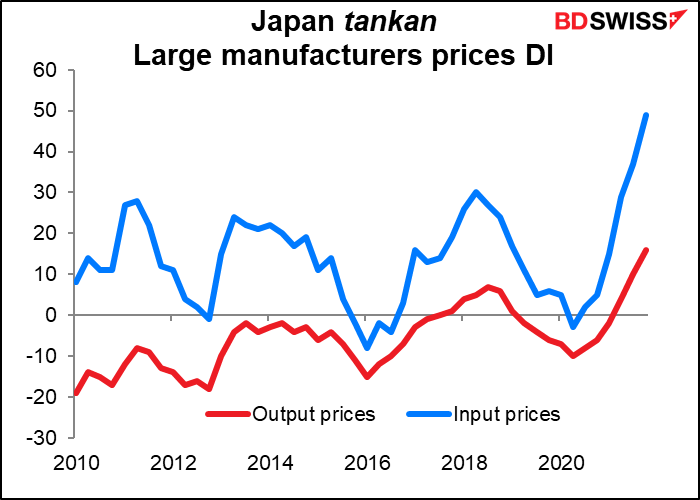
For many years now Japanese companies haven’t been able to pass those higher prices through, but that’s beginning to change. The Bank of Japan tankan diffusion index for output prices among large manufacturers (% of companies raising their prices minus the % cutting prices) has remained negative (i.e., more companies cutting prices than raising them) even while the DI for input prices was positive (i.e., more companies were seeing price hikes than seeing price cuts in their input prices). However, as the DI for input prices rises abruptly (at least half of all large manufacturing companies are now seeing their input prices rise), the share of companies willing or able to raise their output prices is gradually rising, too.
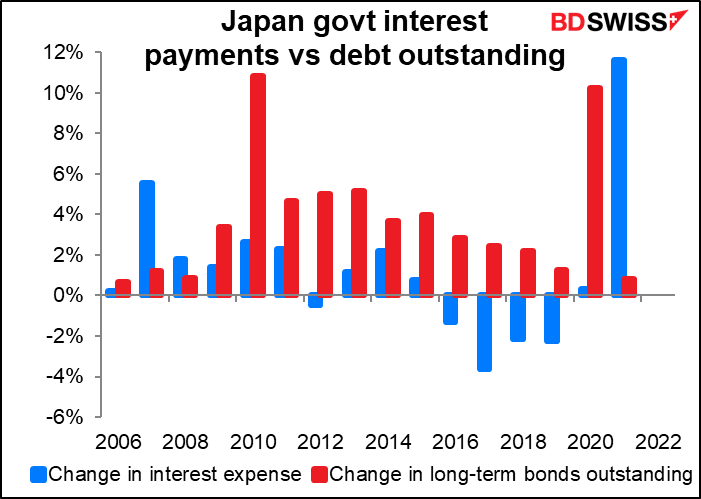
This topic bears watching because Japan’s low inflation and low interest rates have been a feature of the global financial world for two decades now. If Japan’s inflation rate were to return even to average global levels and bring interest rates back up, it would be a major change. Investors who put on carry trades funded in JPY might move them to another low-interest-rate currency, such as EUR or CHF, causing those currencies to depreciate.
Meanwhile, the Japanese government’s finances might collapse. For many years the government has managed to get away with financing its deficit with debt because interest rates were so low if not negative. Generally speaking, government interest expense has not risen along with the increase in outstanding debt and several years it actually fell even while the government’s debt mountain rose ever higher. That windfall could come to a screeching halt if interest costs ever rose.