Rates as of 04:00 GMT
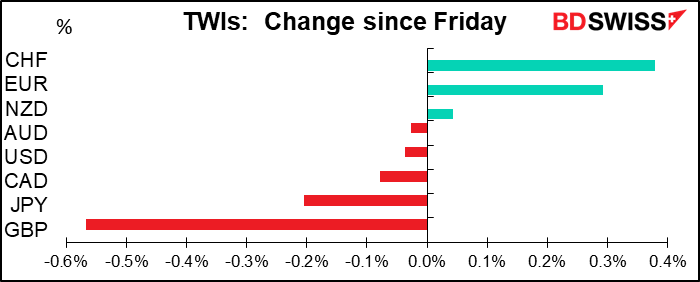
Market Recap
The EU Summit scheduled for Friday and Saturday is still going on! Talks continued on Saturday and Sunday and went through much of last night. The original proposal was for EUR 500bn of grants and EUR 250bn of loans for a total of EUR 750bn. The “Frugal Four” were insisting on no more than EUR 350bn of grants, while Germany and France, backed by the majority, were demanding at least EUR 400bn. The latest proposal is EUR 390bn of grants and EUR 360bn of loans.
The talks will resume at 16:00 Brussels time today (14:00 GMT). EUR has gained on the likelihood that they do come up with some solution at this meeting. I had expected them to fail, or at best to come to only a partial agreement, but the fact that they’ve kept at it for this long shows that they really are determined to succeed. A successful agreement would probably boost EUR further.
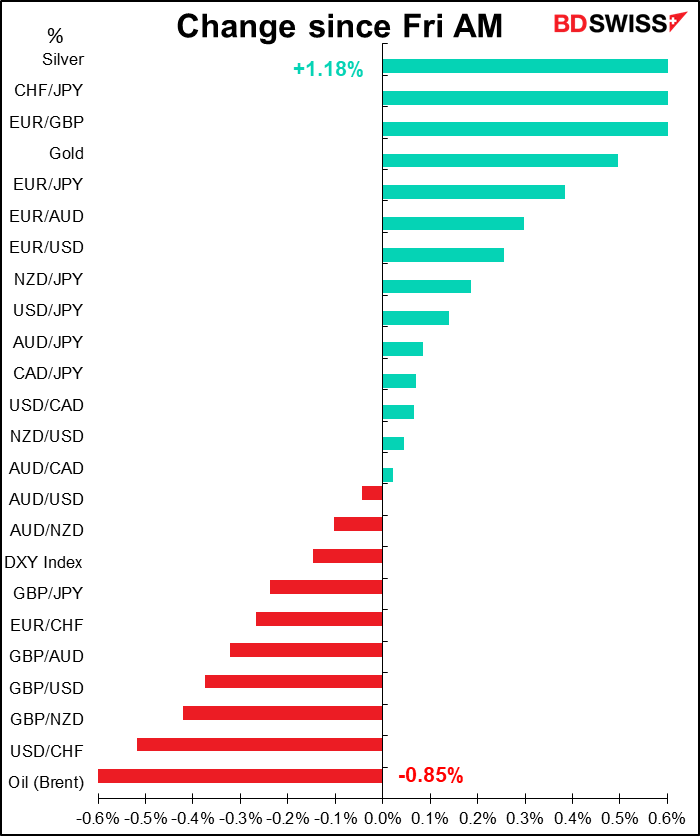
It’s not a particularly risk-off day – Wall Street was up modestly on Friday and Asian markets are mixed today — yet CHF was the best performing currency. This is probably because of speculation that the US Treasury may target the country’s intervention in the next Treasury report on currency manipulation (see below). That could be a serious blow to Switzerland and force them to cut back on intervention, in which case CHF would almost certainly appreciate further.
GBP on the other hand was the worst-performing currency as it fell not only against USD but on most of the crosses as well. I’m not sure why. It could be follow-through from Friday’s comments by Bank of England Gov. Bailey, who said he isn’t convinced of the strength of the UK recovery. The UK rates market has 21 bps of easing priced in by the end of the year, one of the few countries where the market is speculating on further easing of any magnitude. It could also be concern about today’s formal Brexit negotiations. Recent meetings have failed to yield meaningful progress as both sides note “serious divergences” in their views, as EU chief Brexit negotiator Barnier diplomatically put it. I remain bearish GBP.
Positioning indicators
Given that there isn’t much to write about today, I thought it would be a good opportunity to introduce two new positioning indicators, which I’ll run every week along with the Commitments of Traders report.
The first is risk reversals.
What are risk reversals (RR)? Simple explanation: The risk reversal (RR) is a gauge derived from the FX options market of whether the market thinks there’s a greater chance of a currency pair rising or falling. If the market thinks it’s more likely that the pair will rise, then the RR will be positive; if falling, then negative. The more positive (negative) it is, the greater the chance that the market places on the pair rising (falling).
If you’re interested in exactly what a risk reversal is, please see the complex explanation at the bottom of this report.
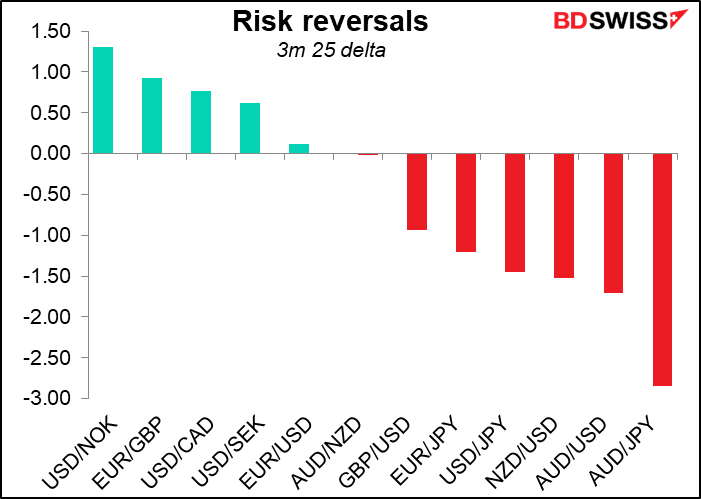
The first graph shows the ranking of the risk reversals for major pairs. (If there are any other pairs you’d like to see, please let me know.) What this shows is that the market is most bullish on USD/NOK and most bearish on AUD/JPY. It’s also quite bearish on AUD/USD and NZD/USD. In short, the options market has a distinctly “risk-off” tone.
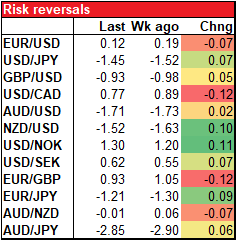
Over the last week, the biggest changes were an increase in confidence in CAD as the bullish USD/CAD RR fell. Confidence in EUR slipped as both the bullish EUR/USD and bullish EUR/GBP RRs both declined. That may also reflect a bit more confidence in GBP as the bearish GBP/USD RR became less bearish. The market also became less bearish on NZD/USD but more bullish USD/NOK.
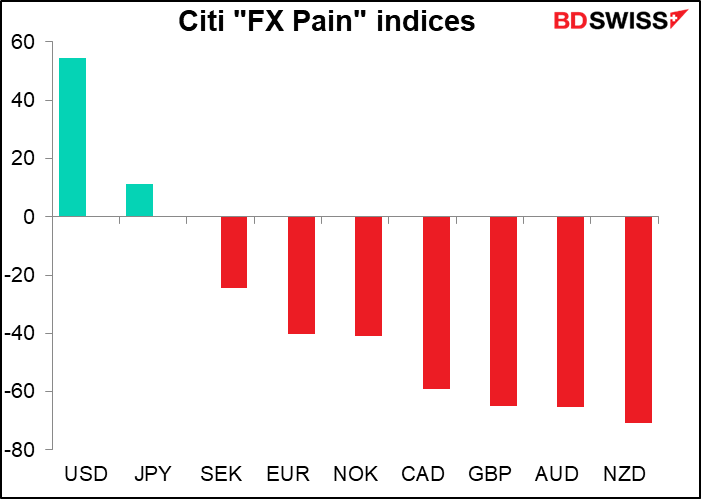
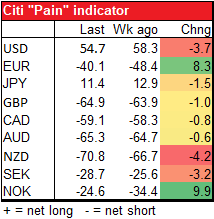
I’m also introducing the Citi “FX Pain” positioning indicators. These are complementary to the CoT report in that they round out the information of the CoT report on speculators by giving information on FX fund managers
According to the official description, “The Citi FX Positioning Alert Indicators infer positioning of active currency traders from relationships between exchange rates and currency managers’ returns. A positive reading suggests that currency traders have been net long the currency and a negative reading suggests that currency traders have been net short the currency.”
Contrary to the CoT report, these indicators suggest that fund managers are long USD and short the commodity currencies and GBP.
Commitments of Traders (CoT) report
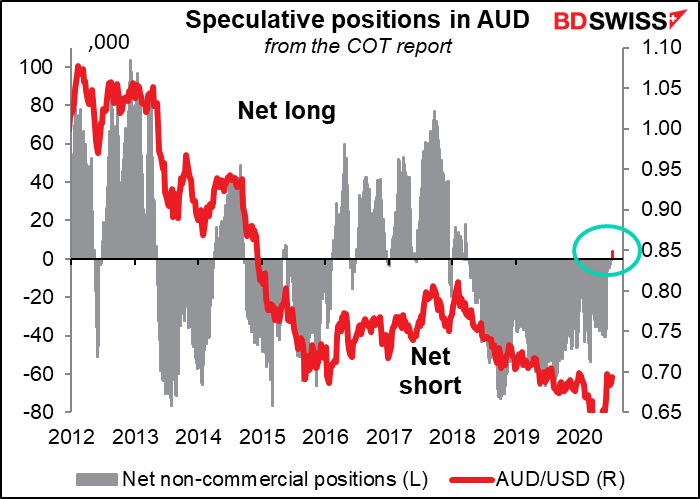
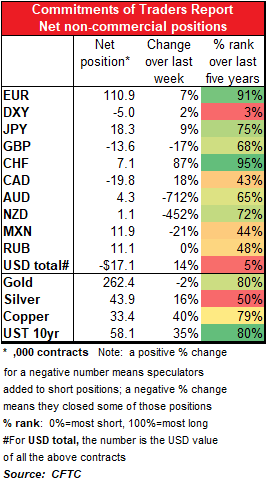
The same trend as usual this week – speculators are getting longer EUR, getting shorter USD. Most of the increase in the short dollar positioning was due to the increased EUR longs, followed by a rise in CHF longs. AUD positioning flipped from negative to positive.. The market has been short AUD since March 2018, so this is a big deal. The contrast with the options market is striking. Of course, different market participants can have different views. Or even specs could be going long the futures but buying puts to hedge their positions.
The market also flipped from short NZD to long NZD, but NZD positioning has been occasionally long.
US virus update
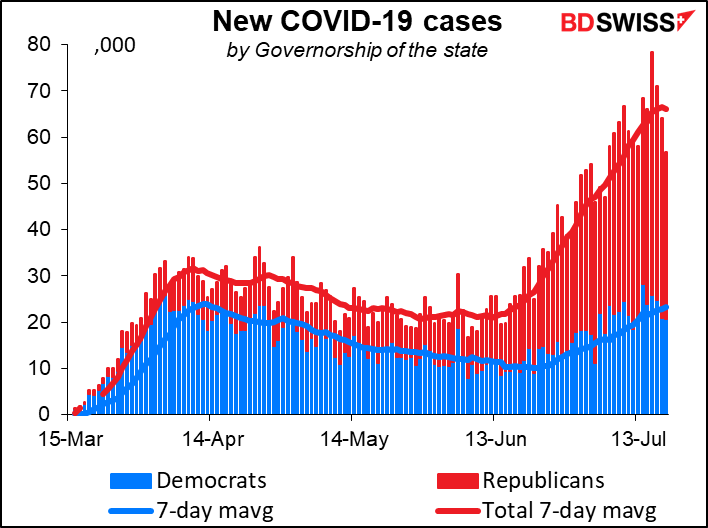
The virus is still rising in the US (44 out of 52 states and territories), but the rate of growth of new cases seems to be peaking. On the other hand, the rate of growth of deaths isn’t. On Saturday, new cases were up 36% over the last two weeks while deaths were up 63%.
The virus remains a Republican-majority problem as around 65% of the new cases are in Republican-led states.
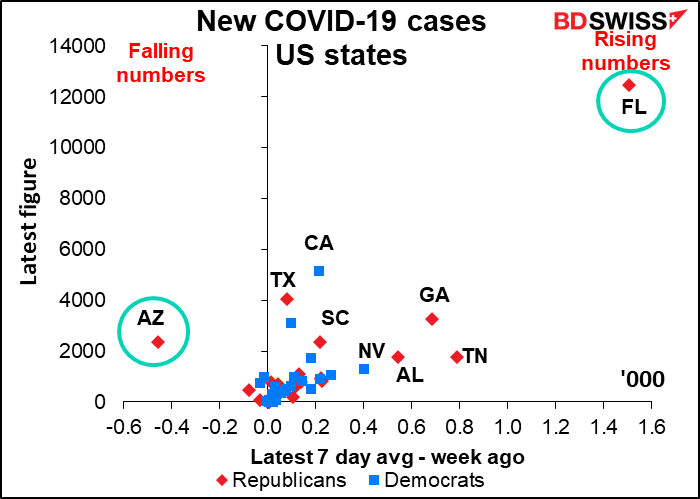
Florida is in the worst shape of any state. On the other hand, Arizona, one of the hardest-hit states, has been improving recently.
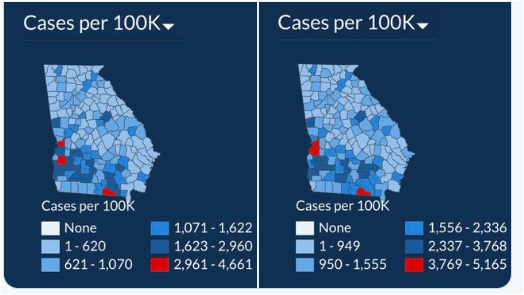
Some people outside of the US may wonder just why the virus is exploding so much in the US. Take a look at this. In just 15 days the total number of cases in Georgia is up 49%, but you wouldn’t know it from looking at the state’s data visualization map of cases. The first map is for 2 July. The second is for 18 July. Can you spot how they’re hiding the nearly 50% increase in cases? This is the approach that the US authorities are taking: if we ignore it, it’ll go away. Also note: the governor of Georgia sued the mayor of Atlanta, the state’s largest city, to prevent the mayor from imposing a city-wide mask requirement, saying it should be a “personal choice.” I suppose AIDS patients should have the “personal choice” of whether they want to bleed on people, too.
And now the Trump regime wants to eliminate additional funding for testing and contact tracing from a new bill. Their view is, if we don’t hear about it, it doesn’t exist. That’s why it’s so frightening that they recently required states to report their numbers to a central database in Washington under control of the Administration rather than the Centers for Disease Control and Prevention (CDC). Everyone assumes it’s so that they can control what information gets released.
Today’s market
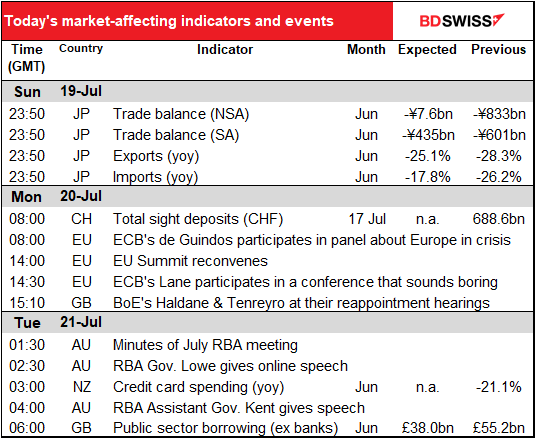
There are exceptionally few indicators out today and tomorrow. In fact, today and tomorrow are about the quietest two consecutive days I can think of outside of Christmas and Boxing Day.
Today during European time the only indicator of note is the weekly Swiss sight deposits. The Swiss National Bank (SNB) is still in there swinging even as EUR/CHF rallies.
One of the reasons CHF has been appreciating recently is that the market is beginning to focus on the possibility that the US Treasury names the SNB as a “currency manipulator” in its biannual report on “Macroeconomic and Foreign Exchange Policies of Major Trading Partners of the United States,” which is due out shortly. Switzerland was added to the “Monitoring List” in the January report, because it met two of the three criteria: “Significant bilateral trade surplus with the United States” (defined as “at least $20bn over a 12-month period”) and “a material current account surplus” (defined as at least 2% of GDP). The question is whether the US will find that
Switzerland also met the third criterion, “persistent, one-sided intervention,” which it defines as “when net purchases of foreign currency
are conducted repeatedly, in at least 6 out of 12 months, and these net purchases total
at least 2 percent of an economy’s GDP over a 12-month period.” It certainly meets the “persistent” criterion, and on my calculation the intervention over the last year has been 17% of GDP, so yes, I believe it would meet the third criterion as well.
Switzerland did $63.7bn in trade with the US last year, accounting for 10.6% of its total trade, so any sanctions that the US might apply would be significant for the Swiss economy. (Exports to the US were 13.8% of Switzerland’s total exports.)
But with their policy rate at -0.75%, the lowest in human history, there’s little else that the SNB can do. SNB President Jordan defended the policy as essential.in a lecture at the IMF last week. “One cannot lower interest rates indefinitely,” he said. “Our experience shows that foreign-exchange market interventions and the negative interest rate are essential for a small open economy with a safe-haven currency in a global low interest rate environment.”
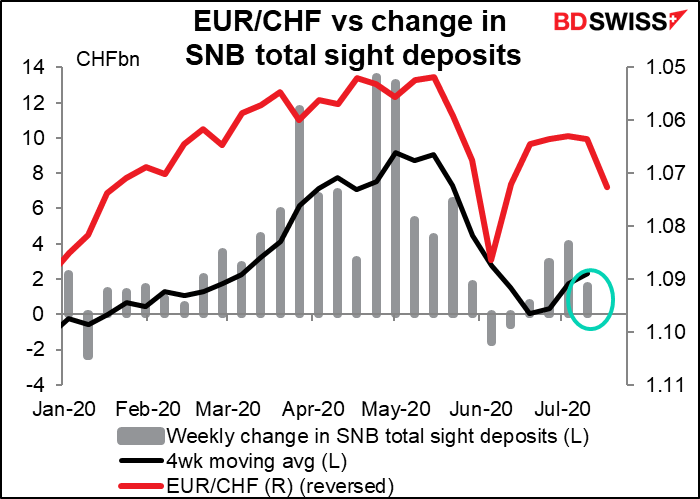
The risk for Switzerland (and the FX market) is of course if the US forces Switzerland to stop intervening or even to reduce its intervention, then CHF would no doubt appreciate much further.
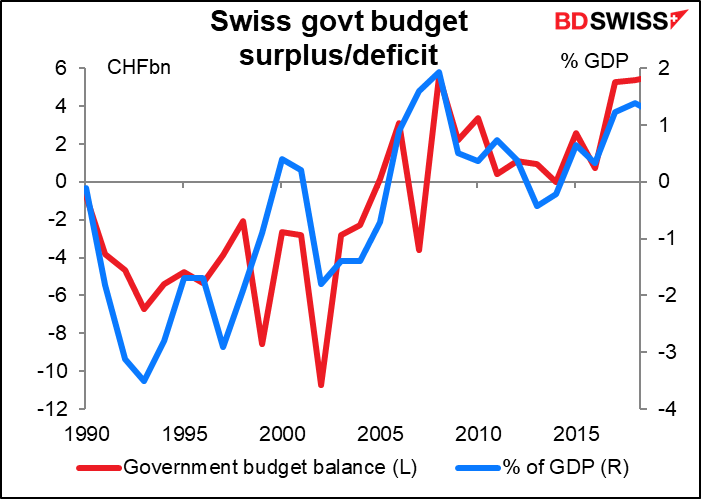
The US government is urging Switzerland to make more use of fiscal policy – i.e. to borrow more – to adjust the savings/investment imbalance that’s at the heart of the current account surplus. The Swiss government has on the contrary run a budget surplus since 2008 (except for a tiny deficit of CHF 1mn in 2014). The surplus hit a record high of CHF 5.6bn or 1.2% of GDP last year.
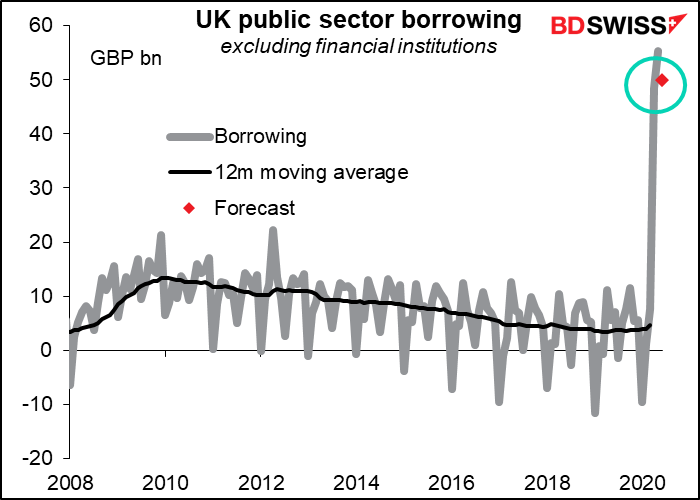
Then early tomorrow morning, Britain announces its public sector net borrowing. It’s exploding, but that’s nothing new – the US also had a record budget deficit in June. It’s supposed to be a bit smaller in June than it was in May, but at these levels who really cares? The forecast of GBP 50bn compares with total borrowing in the 12 months preceding the virus of GBP 56.6bn. So even this “smaller” figure is about equivalent to a year’s borrowing before the crisis hit.
Risk reversals — Complex explanation: In the foreign exchange market, a risk reversal (RR) is the difference in implied volatility between out-of-the-money call and put options with similar specifications. This measure tells us whether the market is willing to pay more for calls or puts. That information is useful in judging whether the market thinks it’s more likely that the pair will rise (in which case the call will cost more) or fall (in which case, the put would be more highly valued).
The RR is calculated by subtracting the implied volatility of the put from the call, which means that if the RR is positive, the implied volatility of the call is higher and the market thinks a rise is more likely. If it’s negative, then the pair is thought likely to decline.
Option: A financial contract that gives the buyer the right to buy (call option) or to sell (put option) a security at a specific price (known as the strike price) by a certain time. It’s different from a futures contract in that the owner of the option is not obligated to buy or sell the security by that time but may do so if they want to (if it’s profitable). In other words, they have the option to buy it if they want to. If they do, they will exercise the option and buy or sell the security at the previously agreed-upon price.
Implied volatility: One of the main reasons why the price of an option rises or falls is because the underlying security becomes more or less volatile (i.e., moves up and down more, and more irregularly). If it’s more volatile, that means there’s a better chance that it will reach the price at which the option can be exercised. In that case, the option will be more expensive. By looking at the price of options, we can determine what level of volatility the market is implying for that security.
Out-of-the-money: Means that the price of the option has not yet reached the price at which it can be profitably exercised, known as the strike price.


