Rates as of 05:00 GMT
Market Recap
Boy, if I thought it was hard to find something to write about yesterday, today is even worse!
The movement of CAD is easy to explain as usual with my favorite CAD graph.
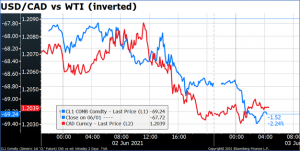
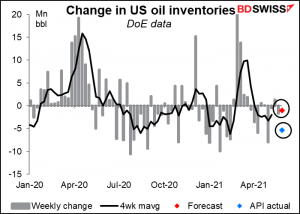
So why was oil up? The American Petroleum Institute (API) Wednesday reported that Us crude oil inventories fell by 5.36mn barrels in the latest week, vs market expectations of a 1mn bbl decline (forecast is for today’s US Dept of Energy figure). The market ignored a rise in gasoline and distillate inventories.
The higher prices so far don’t seem to have sparked any increase in production in the US, which continued at its recent pace of 11mn b/d in the week ended May 21st . That’s likely to be the limiting factor for oil prices. Once production gets ramped up in the US again, the price is likely to be capped. Also keep an eye on the negotiations over the Iran sanctions – after some initial enthusiasm, they don’t seem to be going anywhere fast. A breakthrough there could quickly add 1mn b/d to the global oil supply.
As for why NZD was down, I couldn’t find any reasonable explanation. One source attributed it to bad news out of Australia*, but why should NZD fall vs AUD on bad news from Australia?
(*Slightly lower-than-expected trade surplus – not statistically significant in my view.)
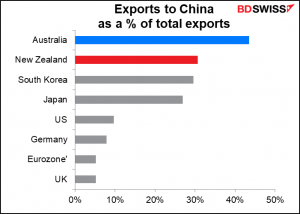
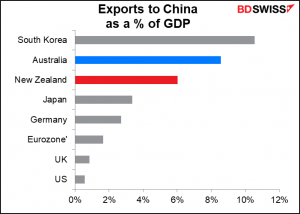
Others attributed it to bad news out of China. The Caixin China service-sector purchasing managers’ index (PMI) was lower than expected at 55.1 vs 56.2 expected (56.3 previous). Others attributed it to the fall in CNY.
But again, that should hit AUD more than NZD, since Australia depends more on China than New Zealand does. So that doesn’t make much sense as an explanation, either.
Anyway it seems that falling is just what NZD does nowadays – it’s been down for four days in a row.
I mentioned yesterday that GBP might be pressured due to concerns about the virus there. Just to note, half of the adult population in Britain are fully vaccinated and three-quarters have at least received a first shot. UK PM Johnson said that he could “see nothing in the data at the moment that means we cannot go ahead” with the planned “final” easing of restrictions on June 21st. Having said that, recent data suggest that cases are doubling every two weeks, roughly as fast or faster than when the government’s scientific advisers recommended a lockdown in September. The increase seems to be fuelled by the aggressive Indian variant. So the UK’s version of the Tokyo Olympics is whether they can lift all the restrictions as planned on June 21st.

Today’s market

The table above is updated before publication with the latest consensus forecasts. However, the text & charts are prepared ahead of time. Therefore, there can be discrepancies between the forecasts given in the table above and in the text & charts.
More final service-sector and composite purchasing managers’ indices (PMIs) from those countries that have preliminary ones, and the one-and-onlys from those that don’t. Usually the revisions are minor and not market-moving.
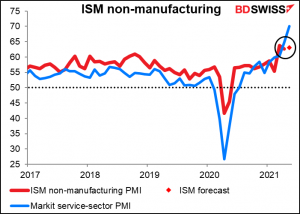
Following those as usual is the Institute of Supply Management (ISM) US service-sector PMI. While the Markit and ISM manufacturing PMIs are pretty close now (62.1 vs 61.2, respectively), the two service-sector PMIs are wide apart: Markit is at 70.1 while the ISM is at 62.7.
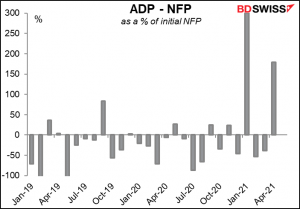
So then we wait for the ADP employment report. Automated Data Processing Inc. (ADP) is an outsourcing company that handles about one-fifth of the private payrolls in the US, so its client base is a pretty sizeable sample of the US labor market as a whole. It’s therefore watched closely to get an idea of what Friday’s US nonfarm payrolls (NFP) figure might be. At the moment, the forecasts for the two are nearly the same: +650k for today’s ADP, +655k for the NFP.

One point to note: the ADP adjusts its figures to match the final estimate of NFP, not the initial estimate that we get this Friday. So, while it’s one of the best guides to the NFP that we have, it’s not perfect by any means – in fact, neither is the NFP figure itself, since it’s always revised. And recently there have been some bigger-than-usual misses as the ADP was much larger than the NFP. Probably the discrepancy comes down to seasonal adjustment.
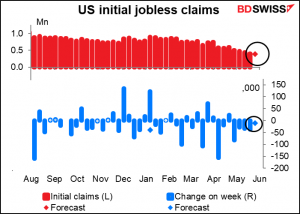
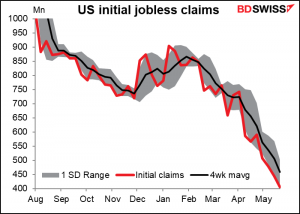
Initial jobless claims are forecast to continue what seems to be their inexorable decline. The consensus forecast is for only a small decline of -11k, vs the average for the last four weeks of -46k.