Rates as of 05:00 GMT

Market Recap
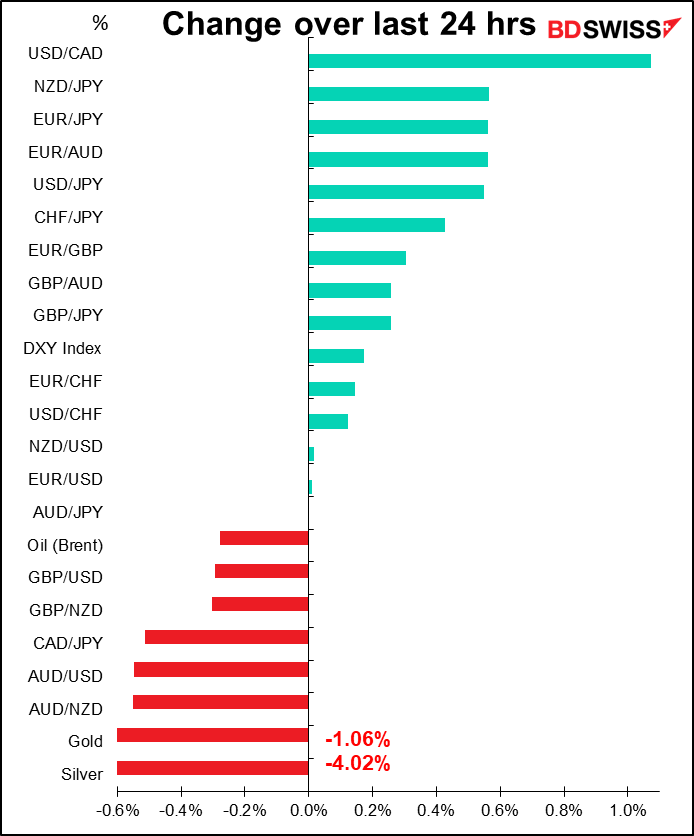
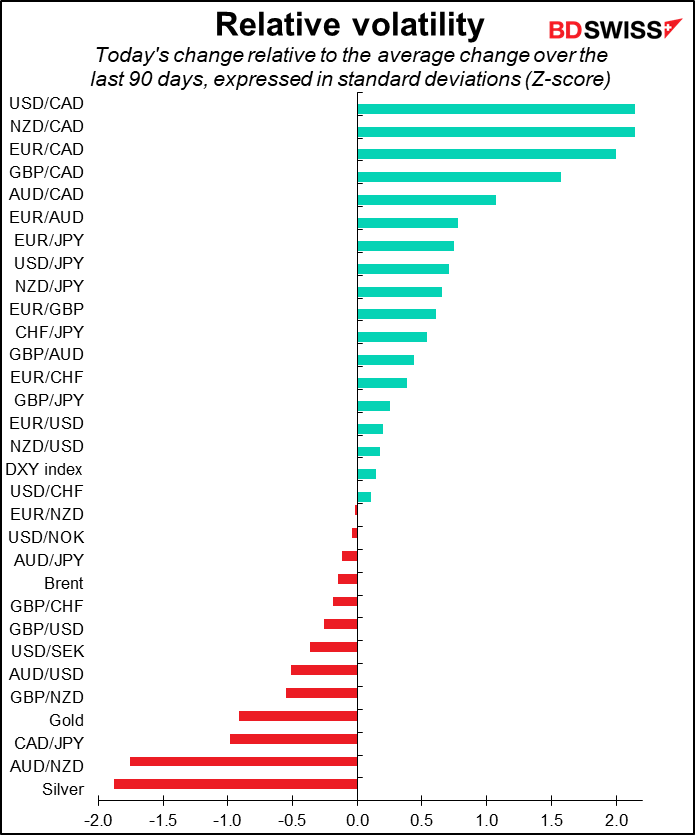
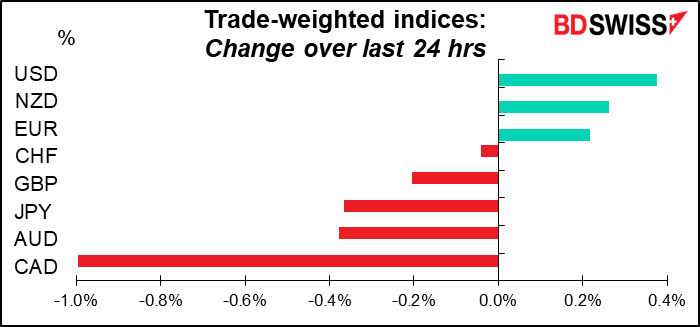
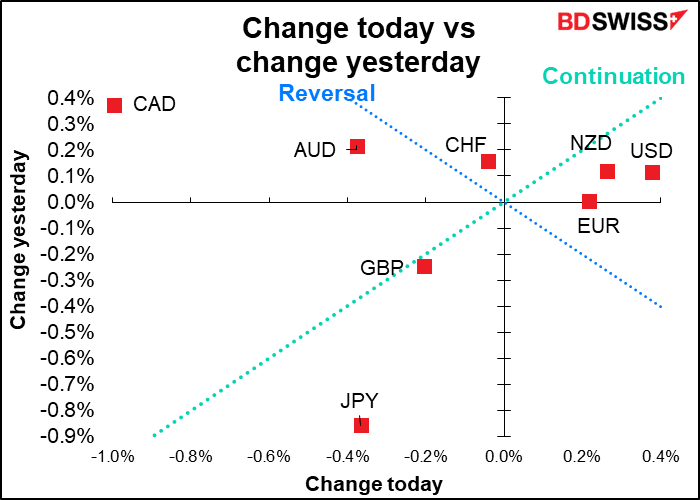
What do you have to do to get any respect around here? The Bank of Canada shocked markets Wednesday with a 100 bps hike, which (almost) no one had forseen. Next day, CAD is the weakest currency of the lot, with two standard deviation moves in several of the crosses.
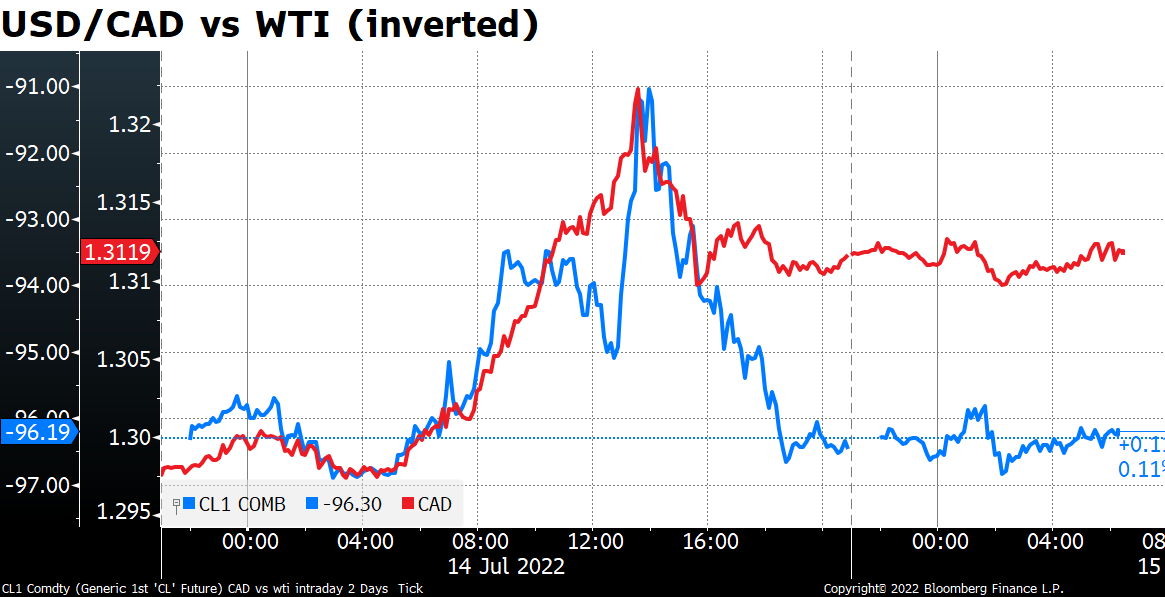
CAD initially came off with oil prices (USD/CAD moved higher), but then failed to recover as oil recovered.
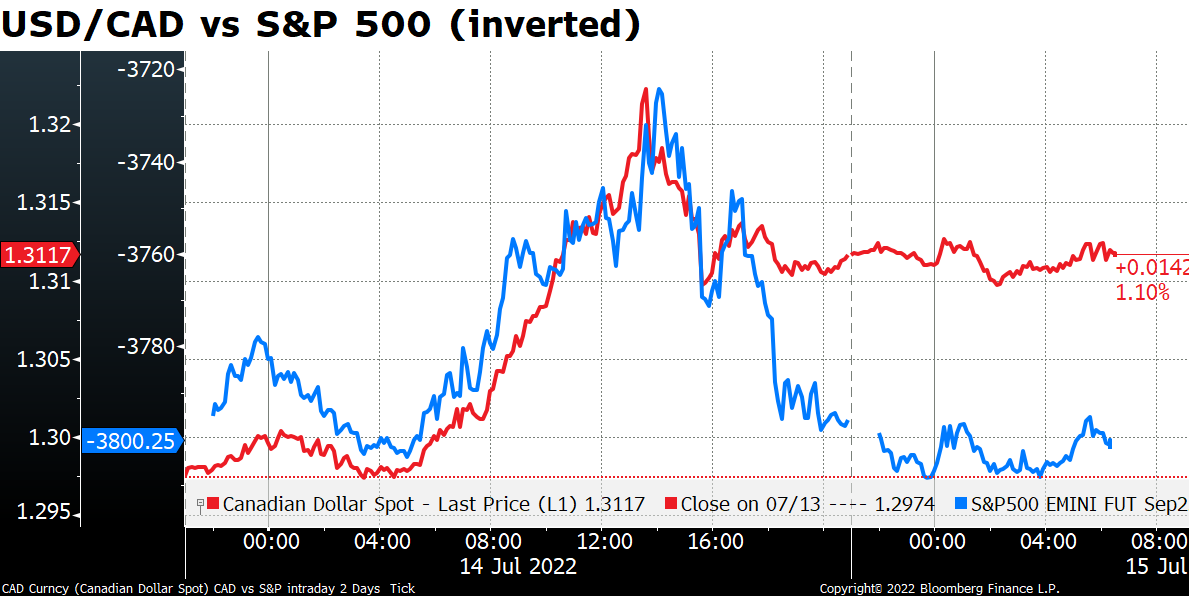
Similarly with CAD and risk sentiment, as proxied by the S&P 500. The S&P 500 was down 2.1% on the day at one point but recovered as thoughts of a 100 bps hike at the next FOMC meeting receeded (see below).
I must admit I’m mystified by the move, as were others, I suspect. I wasn’t able to find any good explanation. Bank of Canada Gov. Macklem seemed surprised, too. In an interview with The Financial Post, he said, “In terms of this decision, the fact that we haven’t seen as much appreciation of the Canadian dollar means we’ve got to do more through interest rates. That is something we’re taking into account.”
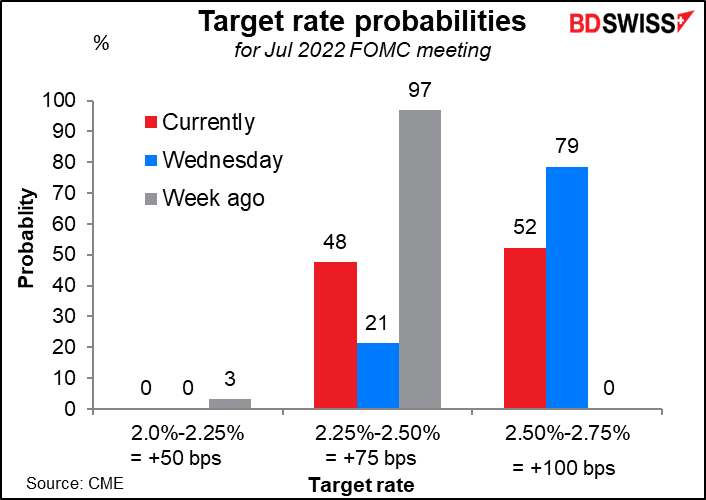
On the flip side, the strength of USD was somewhat surprising too as the market reconsidered the odds of a 100 bps hike at this month’s Fed meeting. Whereas that was seen as the most likely response to the shocking June US consumer price index (CPI), the market dialled back its expectations yesterday after two voting members of the Committee, Fed Gov. Waller and St. Louis Fed President Bullard, both advocated a 75 bps hike.
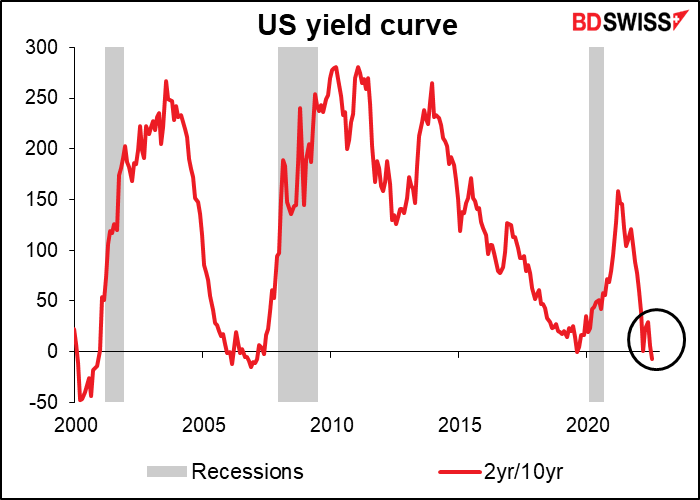
The US yield curve moved further into inversion, signalling market fears of a recession after the headline figure for the US producer price index (PPI) can in much higher than the consensus forecast (see table abover).
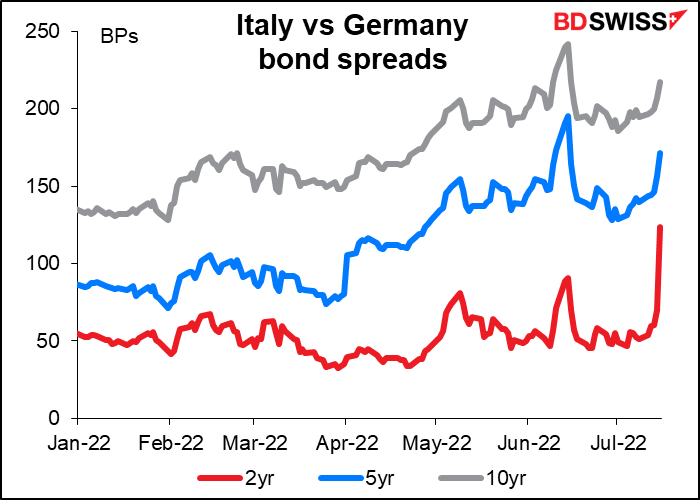
EUR/USD broke parity, falling for a moment to 0.9952, as uncertainty in Italian politics mounted with Italian PM Draghi offering his resignation after his coalition partners, the Five Star Movement, failed to back him in a confidence vote in the Senate. President Mattarella rejected the resignation. It’s unclear what will happen next. Draghi is scheduled to address Parliament next Wednesday. Early elections remain a possibility if they can’t reach an agreement.
This widening in Italian bond spreads shows why the European Central Bank needs some tool to prevent fragmentation in the Eurozone. However it’s not clear whether any new tool that they introduce would be applicable in a case like this, where the fragmentation is caused by political instability.
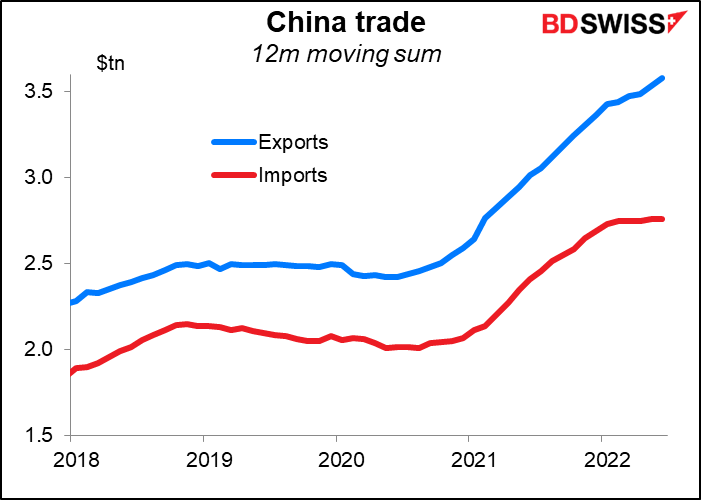
The other point to note is the much weaker-than-expected Chinese GDP figure (see table above). That’s another sign of impending global recession as demand from China dries up. It corroborates the message from Wednesday’s China trade data, which is that exports continue to rise but imports are stagnating. Rising unemployment, declining household income and unending COVID lockdowns have squeezed domestic consumption, keeping inflation low relative to other countries and the trade surplus at a record high. That could be a signal of deflation further down the line as China tries to export its way out of a slump. (The better-than-expected retail sales figures, which are now rising on a year-on-year basis, do hold out a glimmer of hope, however.)
I don’t usually discuss the Chinese economy because my clients aren’t that active in CNY, but there are warning signs on the horizon there. Notably, there’s a buyers’ strike in the Chinese housing market. According to Bloomberg, an increasing number of homebuyers across the country are refusing to pay mortgages on stalled projects. “Reports of rapidly escalating refusals to pay mortgages in recent days have sparked losses in Chinese bank shares and developer bonds, reflecting concerns that the nation’s property crisis may spread to the financial system and trigger social unrest.”
Housing is one of China’s major saving vehicles. With bank deposit rates held low in order to fund industry, savers have looked for other investment vehicles to earn a decent return. Much of the nation’s wealth is therefore tied up in housing. If that market crumbles – as seems to be happening – the “reverse wealth effect” will dampen Chinese consumption further. That’s bad for the global economy but might have a bright side in that it would help to lower inflationary pressures.
Silver had a bad day, plunging some 4%. Precious metals and Bitcoin have proved to be no hedge against inflation this year.
More signs of US inflation
Today’s market
Note: The table above is updated before publication with the latest consensus forecasts. However, the text & charts are prepared ahead of time. Therefore there can be discrepancies between the forecasts given in the table above and in the text & charts.
Nothing much on during the European morning.
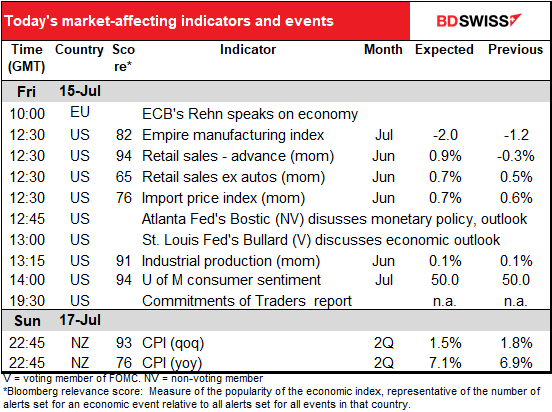
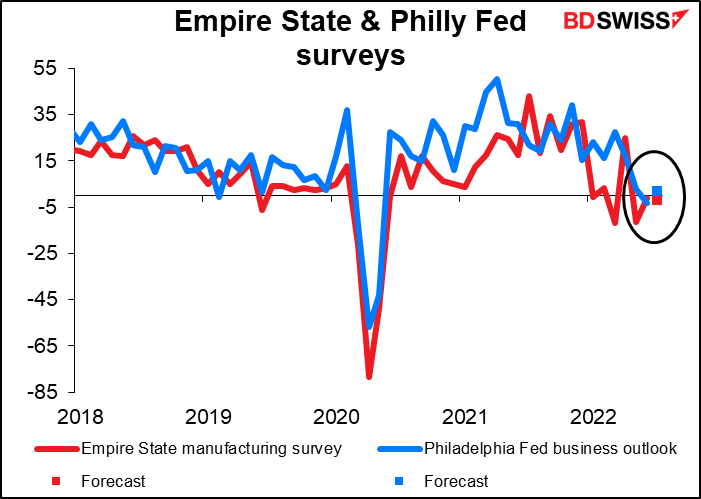
When the US starts up though we get several important indicators. The Empire State manufacturing index is expected to fall further into negative territory. This is in contrast to next week’s Philly Fed index, which is forecast to shift from negative territory back into positive territory. In any event they’re both expected to be around zero, indicating little expansion or contraction. This concurs with the dominant narrative of a slowing US economy, as shown by the general weakness in the purchasing managers’ indices (PMIs), and so it might have a greater-than-usual impact.
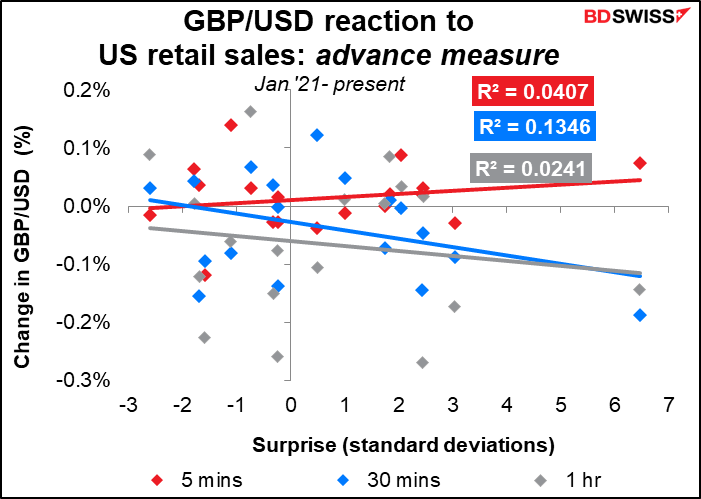
In any event, the impact will probably be swamped by any signal from the US retail sales, one of the more important US indicators. Some 70% of the US economy depends on private consumption, of which retail sales comprise some 40%. That means retail sales account for approximately 28% of the US economy.
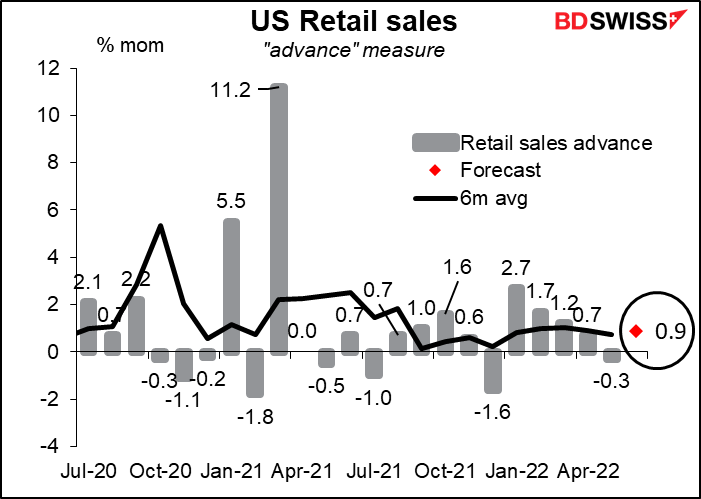
There are four different versions of this indicator, each one more narrowly focused. The headline or “advance” figure, which includes the most categories, is the most closely watched. The 3.9% mom rise in auto sales might provide a boost to this figure, which is expected to come in above the six-month moving average. USD+
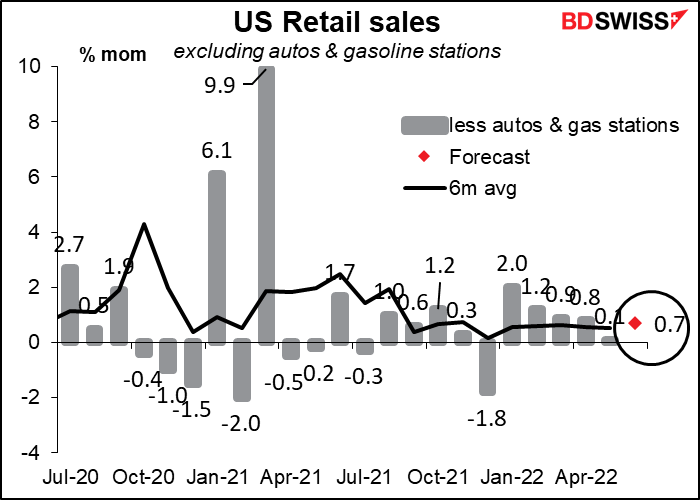
The narrower measure, excluding autos and gasoline station sales, is also expected to be above its 6-month moving average too. These figures should show that consumer spending is holding up quite well despite the plunge in consumer confidence. This is another reason why the Fed can keep tightening without worrying about crashing the US economy. USD+
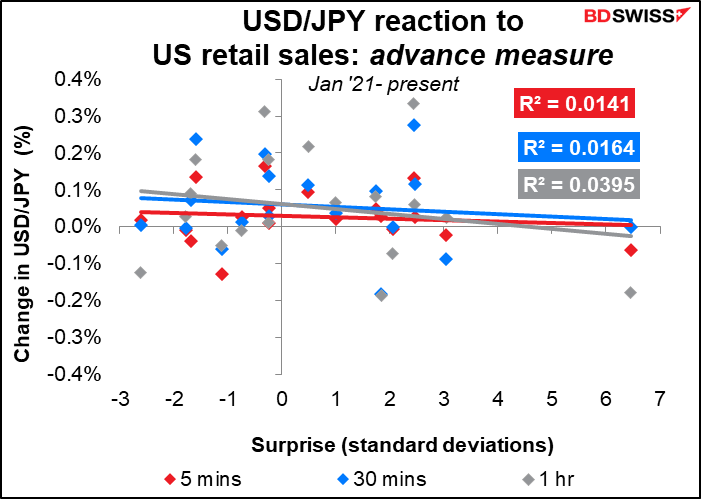
Although this is one of the most important US economic indicators, the response of the FX market is rather sloppy. Currencies don’t move that much in line with the beat or miss of the indicator. The performance of GDP is particularly unstable; if I were to trade this indicator, I wouldn’t use GBP/USD.

US import prices are not usually a big issue for the markets, but with all the focus on inflation, they’re likely to get more attention than usual. The expected rise in the month-on-month rate is kind of worrisome, given the incredible rise in the US consumer price index.

However, that’s mostly petroleum. If we look at import prices excluding petroleum, we see only a very small (+0.1% mom) rise is expected. And so far this month imported petroleum prices (Brent, that is) are down 12.5% from the end of June. So we can expect – or at least hope for — a fairly modest increase in the headline figure for July.

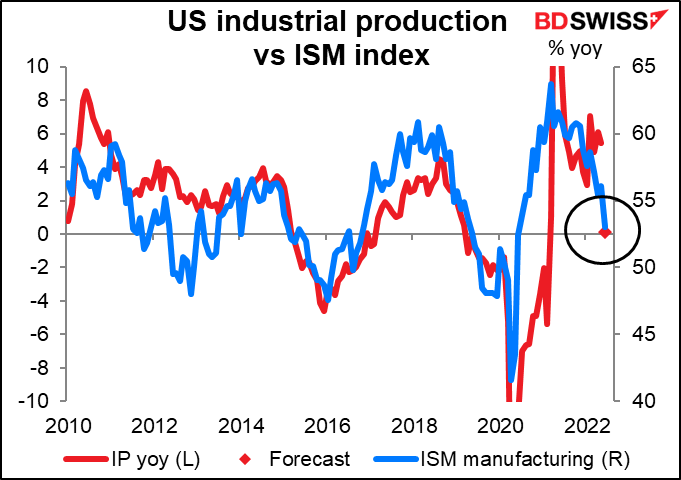
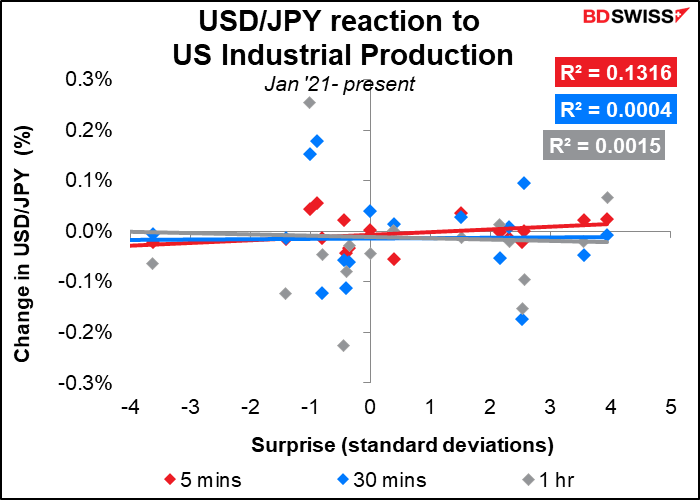
US industrial production is forecast to be up a mere 0.1% mom, well below the six-month moving average of +0.52%. This will play into the prevailing narrative that the US economy is slowing, perhaps headed for a recession.

A print in line with the market consensus would pretty much confirm the story that we got from the Institute of Supply Management’s manufacturing purchasing managers’ index (PMI), which is that US manufacturing is still expanding but at a slower pace.
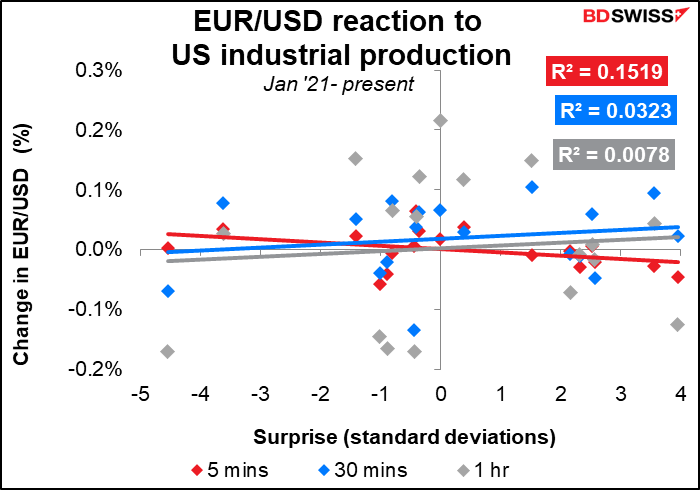
The FX market’s reaction to this indicator is not particularly strong, probably because it doesn’t have that direct an impact on monetary policy.
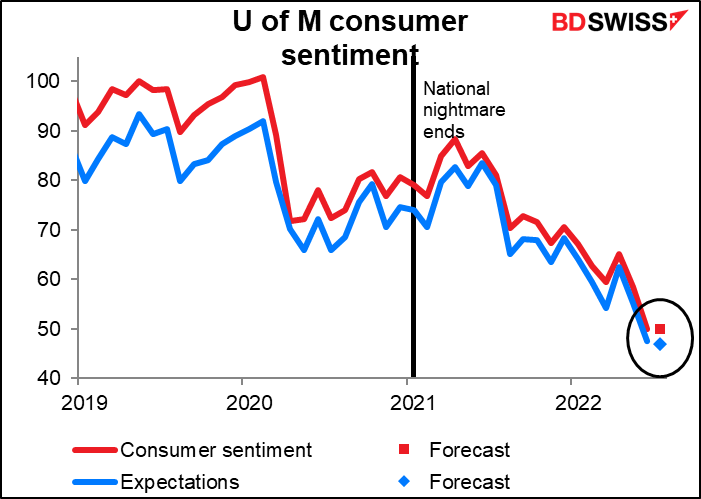
Finally, we have one of my least-favorite indicators, the University of Michigan’s consumer sentiment index. There are a variety of reasons why I don’t like this indicator. The main two are that a) it’s touted as a leading index of consumption but I can’t find any relationship between it and US retail sales or personal spending, and b) the initial result is calculated from a pitifully small sample of some 250-300 people, while the final result involves not many more – just 500. This compares with 2,500 for the Conference Board’s initial figure and 3,500 for their final revision. So I doubt if it’s a representative sample of opinion.
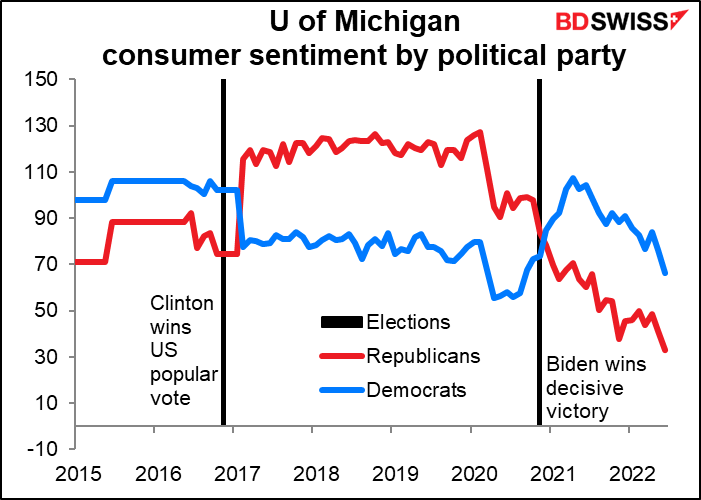
The third reason is that it’s swayed by political leaning. People who watch Fox News are bombarded 24/7 with propaganda about how terrible everything is, how wretched the President is, how the US is on a highway to hell, etc etc. So sentiment among Republicans, which was artificially high during the years when the US was indeed going to hell in a handbasket under the former guy’s direction, is now artificially depressed.
Having said that, the headline index is expected to be unchanged this month, probably because gasoline prices are down about 8% from their peak last month. (Note that Fox News, which was constantly blaming President Biden for the high gasoline prices, is not complaining that gasoline prices are coming down “too fast” and thereby causing financial hardship for small independent gasoline stations! I couldn’t make that up.) The expectations index is forecast to be down slightly.
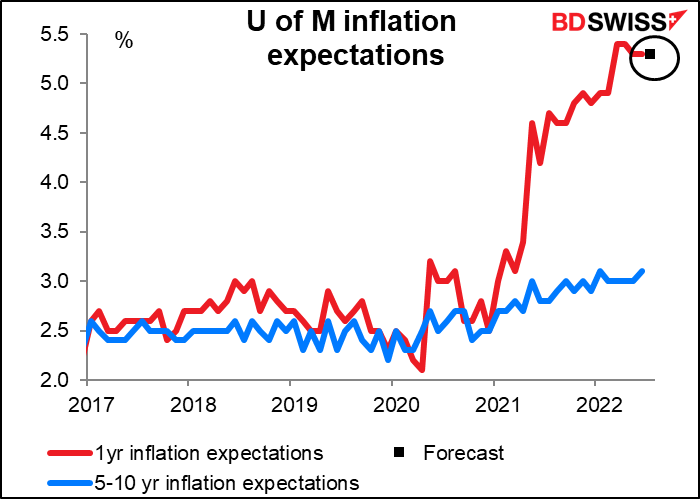
There’s also the 1-year inflation expectations question. That’s forecast to be unchanged at 5.3%. This is important – the minutes of the June meeting of the rate-setting Federal Open Market Committee (FOMC) showed that the rise in the 5-10 year inflation expectations was mentioned as one of the reasons why they decided to hike by 75 bps instead of the 50 bps that had been widely discussed ahead of time. There’s no forecast for that figure. One year inflation expectations are expected to be unchanged at 5.3%, which is ridiculously high.
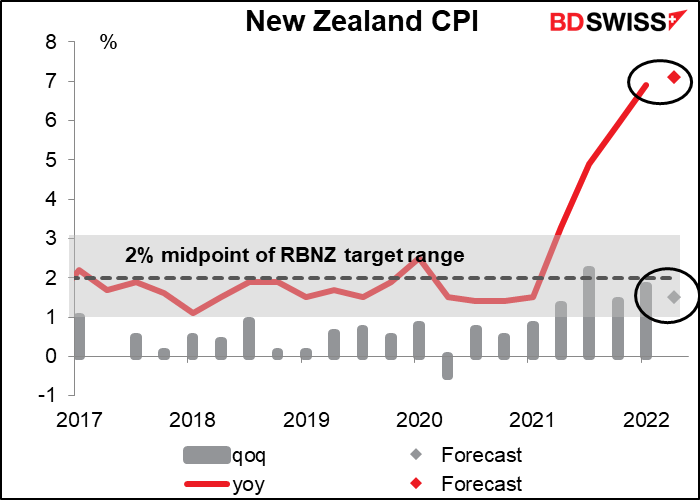
Then early Monday morning, New Zealand releases its CPI. It’s expected to move ever higher. The quarter-on-quarter changes are now of the magnitude that the year-on-year changes used to be (e.g. this time the market expects prices to be up 1.5% qoq, whereas in 2018-2019 the average year-on-year increase was 1.63%). The Reserve Bank of New Zealand will have to take action to rein in prices. But we knew that already so it probably won’t have that big an impact.