Rates as of 04:00 GMT
Market Recap
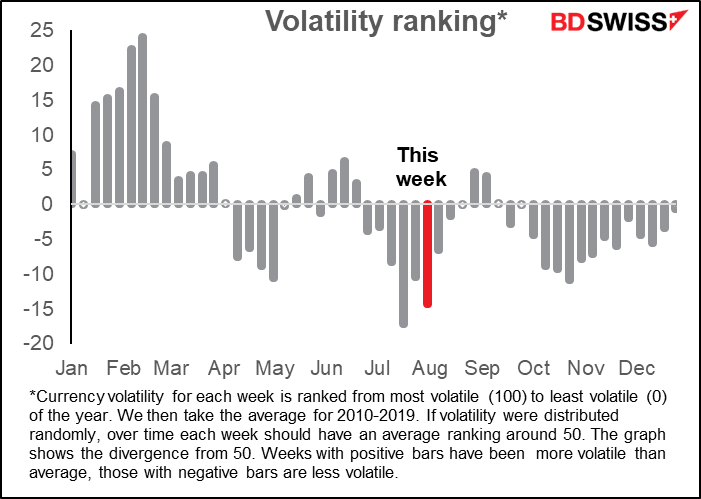
Really calm day. One of the least volatile days I’ve seen recently.
I shouldn’t be surprised though. This week is historically one of the least-volatile weeks of the year. In fact, before I updated the graph this morning with last year’s data, it was the least volatile week of the year, but last year it was surprisingly volatile this week, which pushed it into second place (thus proving once again that “past performance is no guarantee of future performance.”) Historically this would be because people start going on summer vacation this time of year. I wonder though how many people will go on vacation this year.
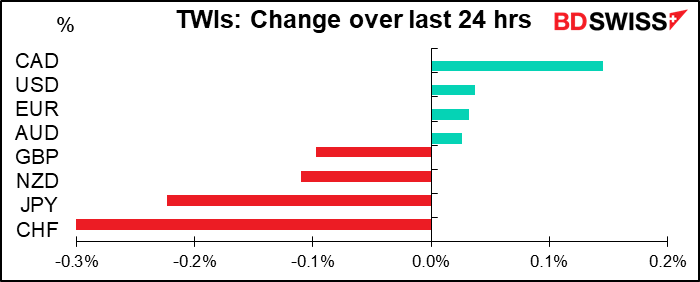
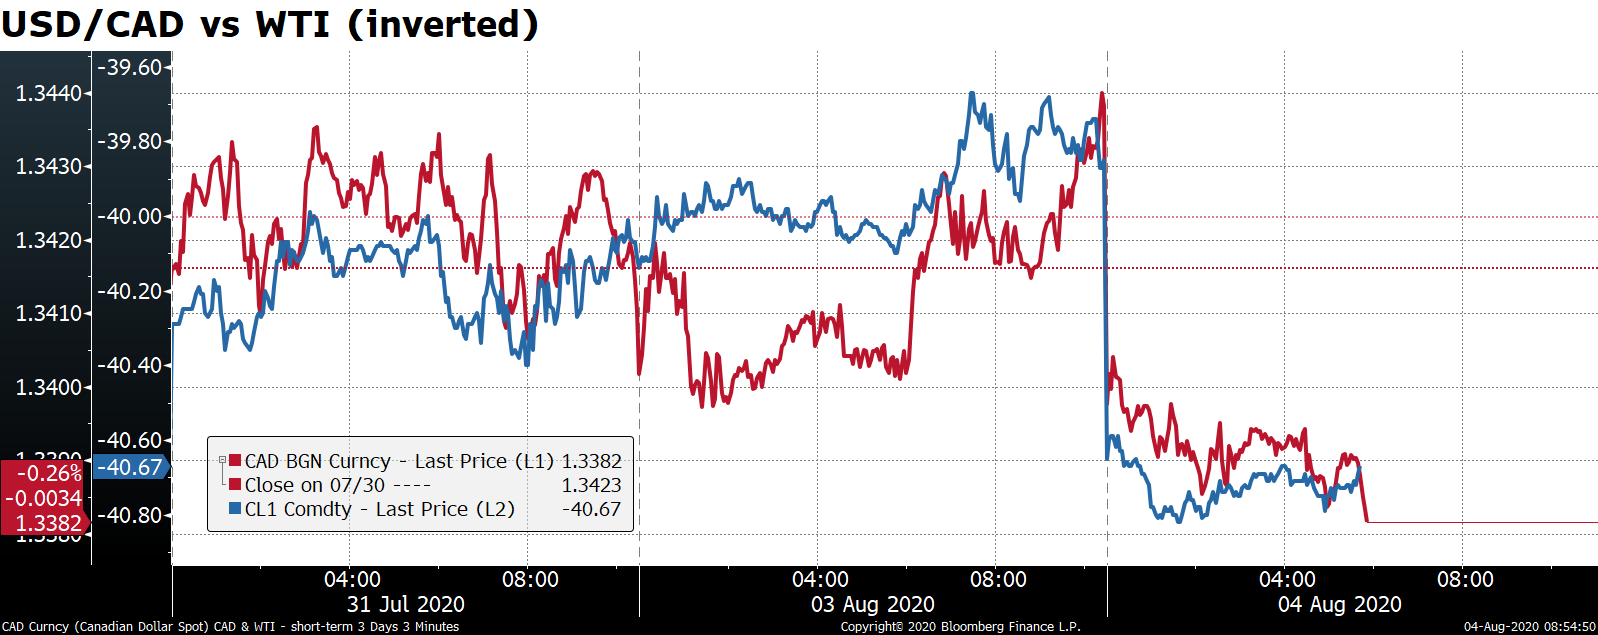
CAD was the biggest gainer on the day as it followed oil higher, especially this morning in Asia. The key here was the signs of a recovery in manufacturing: the Institute of Supply Management (ISM) manufacturing purchasing managers’ index (PMI) came out higher than expected yesterday, while the Markit version of that index was revised up for the Eurozone (but down for the US). In China, the world’s largest oil importer, the manufacturing PMI hit the highest since January 2011. CAD was especially subject to volatile movements yesterday as it was a national holiday.
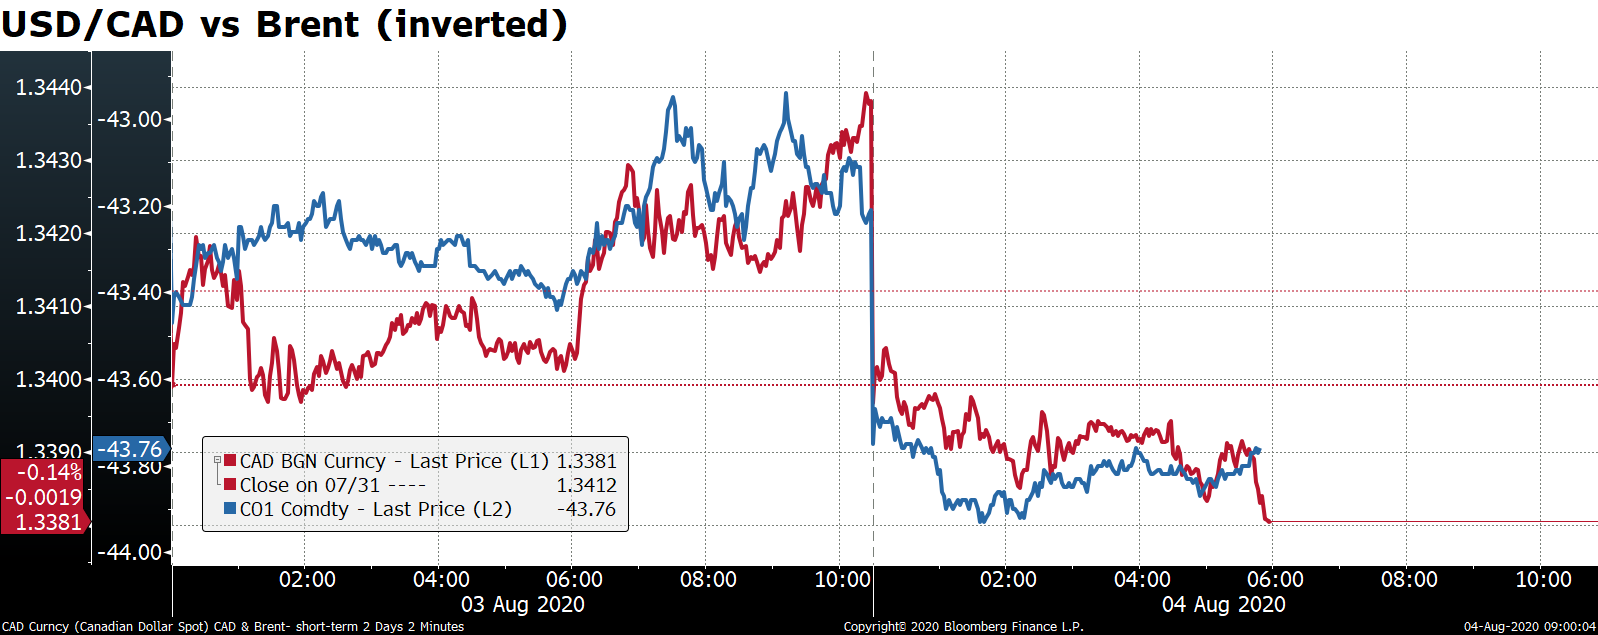
Also speculators are net short CAD, which may make them particularly sensitive to any good news for the currency.

The rise in oil prices is notable as it came just as OPEC+ begins ramping up its supply in August by 1.2mn barrels a day. Personally I doubt whether oil can continue to rise and I’m therefore skeptical about chasing this CAD rally.
The losers on the day were the safe-haven CHF and JPY, which fell as stock markets in Europe and the US gained.
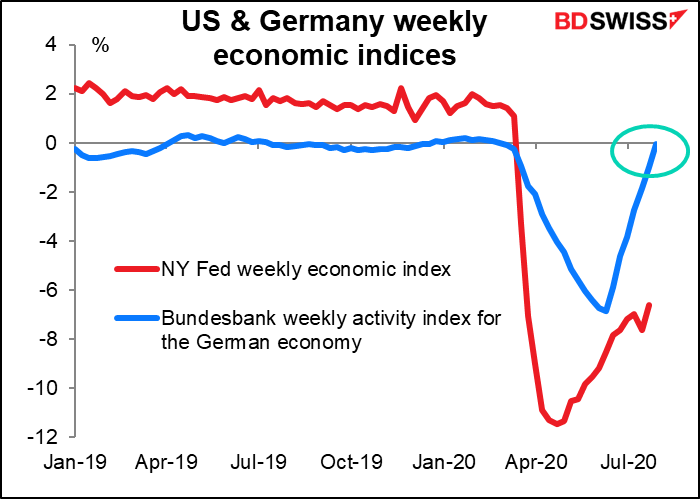
High-frequency indicators show Eurozone outpacing US
Germany’s Bundesbank yesterday updated its weekly activity index for the German economy. It continued to rise, to -0.06% from -0.97%. In other words, economic activity in Germany is almost back to normal! The Fed updates its weekly index today – any bets on whether that shows activity back to normal yet? Despite the 2Q GDP figures, which showed growth in the Eurozone collapsing more than in the US, I think the Eurozone recovery will be a lot faster than the US recovery and that growth differential will continue to drive EUR/USD higher.
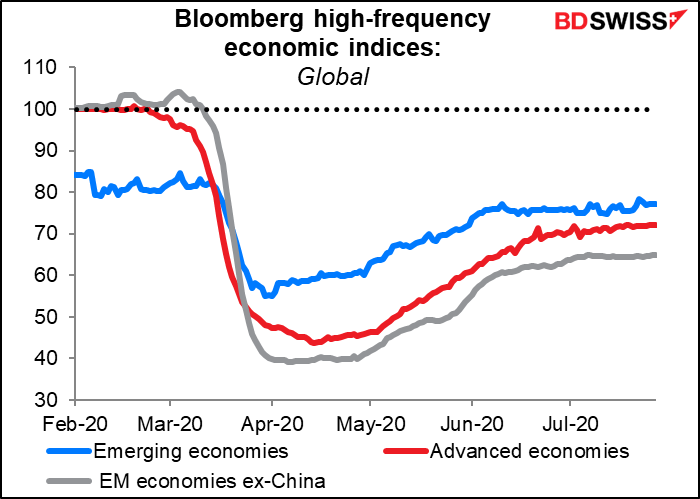
The Bloomberg Daily Activity Indices suggest that the recovery in the major advanced economies has stalled. According to Bloomberg, “Some countries have hit a ceiling on activity short of their pre-crisis level. Others face a drag from renewed outbreaks.Within that general trend, euro-area countries…along with Norway and Japan, have moved closest to their pre-crisis levels. The UK, US and Canada are still very far below their “normal” level of activity.” This just makes me wonder all the more why GBP is recovering so well.

Shadow policy rates
The “shadow” policy rates continued their decline as central banks mostly kept up their quantitative easing. The fall in Australian “shadow” rates over the last two months stands out particularly, which may explain some of the weakness in AUD.
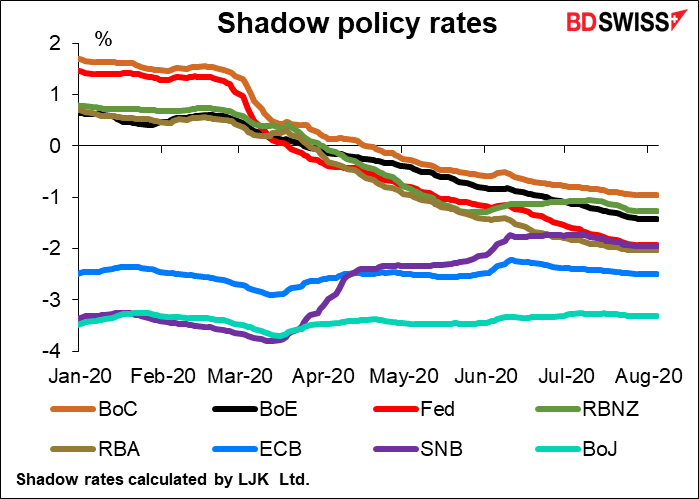
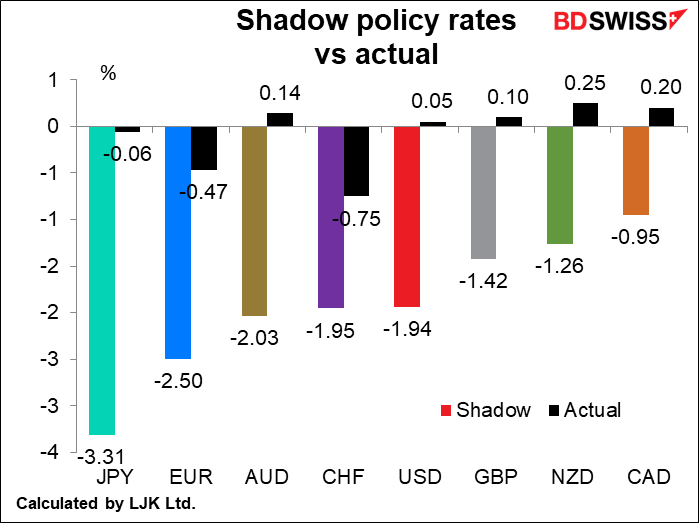

Explanation: “Shadow” policy rates are a way of quantifying the impact of extraordinary monetary policy measures, such as quantitative easing. They convert the impact of such measures on the yield curve into a figure equivalent to policy rates at the level necessary to cause a similar effect. They are therefore a better way of comparing various countries’ monetary policies than simply looking at the policy rate once the policy rates have hit the lower bound. The data are calculated by Leo Krippner, a researcher at the Reserve Bank of New Zealand, and published on his website, LJK Macro Finance Analysis.
Today’s market
Not a lot on the sked today.
I was surprised to note that the Markit Canada manufacturing purchasing managers’ index (PMI) has a very high Bloomberg score (90) but no forecast. So I’m putting it on the schedule but I won’t bother with a graph.
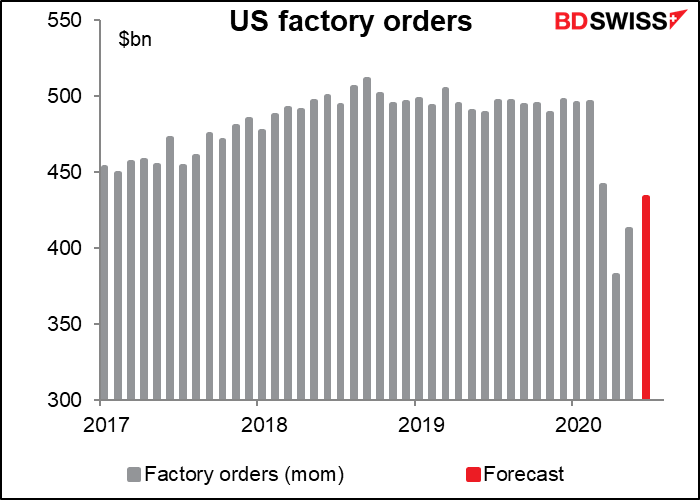
That leaves US factory orders during the European and US days, and that’s a second-tier indicator in my book, as it’s largely a function of durable goods orders, which are already out. In any case, they’re expected to be higher than April or May, but not yet back up to March’s level, much less the pre-pandemic level.
New Zealand is bracing for a record fall in employment of -2.0% qoq, a little bit worse than the current record (-1.8% qoq in 1Q 2009). The unemployment rate is expected to leap from 4.2% to 5.5%. That’s still below what they’ve had in the not-so-distant past. New Zealand has weathered the virus better than almost any country (it helps to be a small island far far away from anywhere else: 1,000 km south of New Caledonia, Fiji, and Tonga and 2,000km east of Australia) and so I would expect the rise in unemployment to be temporary.

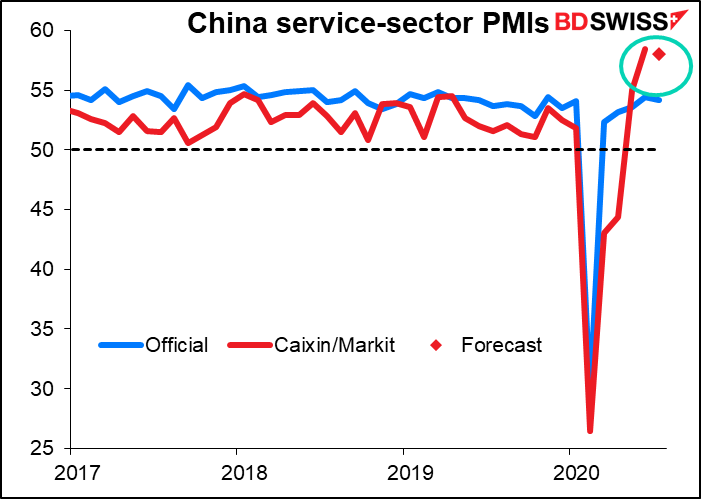
The Caixin China service-sector PMI is expected to fall back a bit from its surprisingly high level. Given that the official PMI also turned down during the month, this would be no surprise to anyone.