

Today, being the third day of the trading week, it’s an opportune moment to review the recent performance and current status of key financial instruments: XAUUSD (commodities), EURUSD (forex), BTCUSD (cryptocurrencies) and NVIDIA (stocks). This assessment can help anticipate potential changes before the end of the week.
XAUUSD
Sentimental Analysis 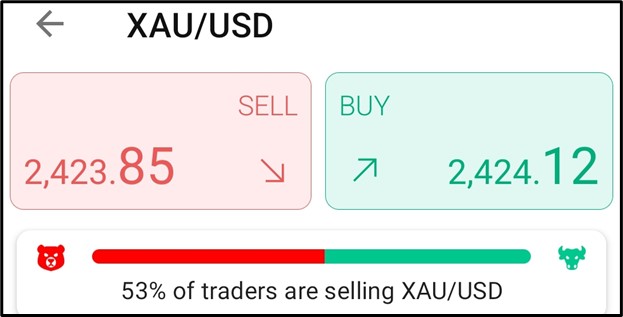
As of 2:29 am GMT, the BDSwiss mobile app shows that 53% of traders are shorting XAUUSD, while 47% are going long on XAUUSD.
Technical Analysis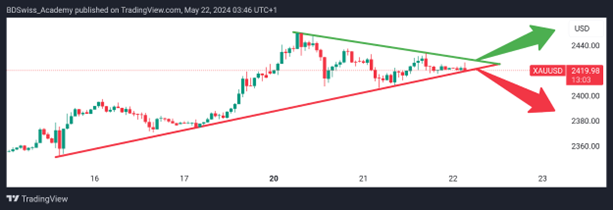
– The symmetrical triangle 1HR chart pattern for XAUUSD shows both the downtrend and uptrend losing momentum, indicating a high likelihood of a new trend emerging.
– An uptrend line drawn from $2351.05 rejected the price at $2375.16 after a retracement from $2394.03, continuing the uptrend to $2450.43 before retracing to the current price of $2419.54.
– A downtrend line drawn from $2450.43 rejected the price at $2434.00 after retracing from $2405.70, with price currently around $2419.54.
– If the downtrend line breaks to the upside, there is a high probability of further price increase.
– If the uptrend line breaks to the downside, there is a high probability of further price decline.
Fundamental Analysis
Gold prices are trading negatively in the early hours today after retreating from a record high on Monday. Federal Reserve members cautioned that the US central bank requires much more evidence of easing inflation before considering rate cuts, suggesting that rates are likely to remain higher for an extended period.
EURUSD
Sentimental Analysis 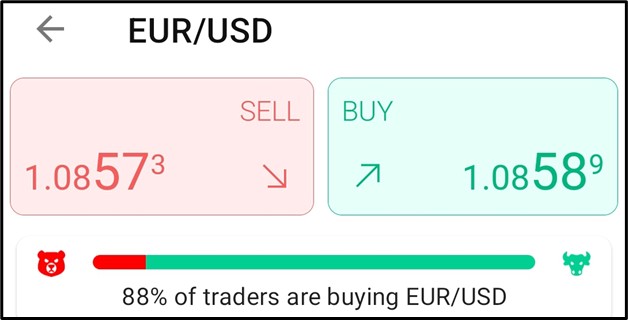
As of 3:08 am GMT, the BDSwiss mobile app shows that 88% of traders are long on EURUSD, while 12% are short on the pair.
Technical Analysis 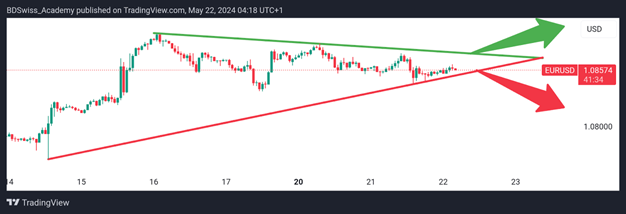
– Technical analysis of the 1 hour symmetrical triangle chart pattern for EURUSD indicates both the downtrend and uptrend are losing momentum, suggesting a high probability of a new trend emerging.
– An uptrend line from 1.07659 rejected the exchange rate at 1.08427 after retracing from 1.08951, with current exchange rate of 1.08574.
– A downtrend line from 1.08951 rejected the exchange rate at 1.08855 and continued downward to the current exchange rate of 1.08574.
– If the downtrend line breaks to the upside, there is a high likelihood of the exchange rate increasing further. Conversely, if the uptrend line breaks to the downside, the exchange rate is likely to decrease further.
Fundamental Analysis
On a quiet Wednesday market session, EURUSD remained within familiar ranges. Despite headlines dominated by remarks from Fed officials, there was little fresh information for investors to process. This lack of new insights kept risk appetite subdued, with bids remaining near opening levels.
BTCUSD
Sentimental Analysis
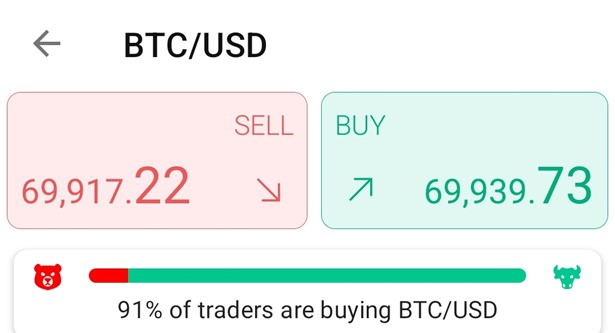
At 3:51 am GMT, according to the BDSwiss mobile app, 91% of traders are in a long position on BTCUSD, while 9% have taken a short position on the pair.
Technical Analysis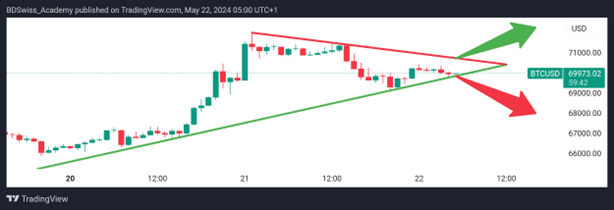
– Technical analysis of the 1hour symmetrical triangle chart pattern for BTCUSD indicates a loss of momentum in both the downtrend and uptrend movements, suggesting a higher probability of a new trend emerging.
– An uptrend line drawn from $66,758.35 rejected the price at $69,101.30 after retracing from $71,972.43, with the current price around $69,973.02.
– A downtrend line drawn from $71,972.43 rejected the price at $71,000.00, with the current price also around $69,973.02.
– If the downtrend line is breached to the upside, there is a high likelihood of the price increasing further. Conversely, if the uptrend line is broken to the downside, the price is likely to decline further.
Fundamental Analysis
A spot ether ETF approval this week would boost cryptocurrency credibility, benefiting bitcoin, predicts analyst Geoff Kendrick from Standard Chartered Bank, foreseeing a potential new all-time high above $73,798 for bitcoin by the weekend.
NVIDIA
Sentimental Analysis
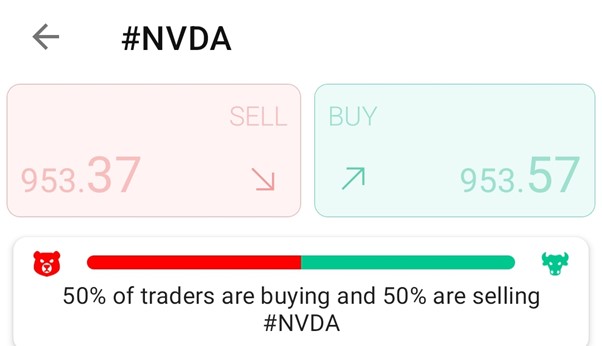
At 4:37 am GMT, according to the BDSwiss mobile app, there is an equal split among traders, with 50% taking short positions on NVIDIA and 50% opting for long positions on NVIDIA.
Technical Analysis 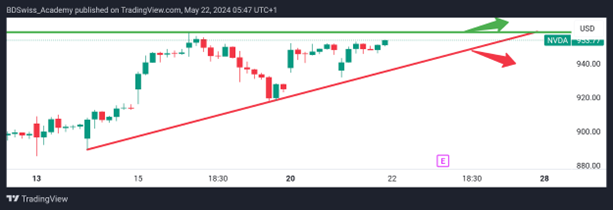
– The 1hour ascending triangle chart pattern for NVIDIA indicates an upward trend.
– An uptrend line from $889.38 rejected the price at $917.77 after retracing from $958.58, which currently serves as resistance.
– The price continued upward after the rejection and is now around $953.77.
– If the uptrend line rejection holds, the price is likely to rise to the resistance level, and breaking the resistance could push the price higher.
– If the uptrendline rejection fails and the uptrendline breaks to the downside, the price is likely to decline further.
Fundamental Analysis
Nvidia (NVDA) is poised to release its first-quarter earnings after the bell on Wednesday, marking one of the most significant reports for investors this year. Wall Street anticipates Nvidia’s revenue and profits to have surged over 200% and 400%, respectively, from the same period last year, driven by soaring demand for its chips amid the AI boom.
Sources:
BDSwiss Academy Page on Tradingview ( https://www.tradingview.com/u/BDSwiss_Academy/ )
BDSwiss Mobile App
https://www.fxstreet.com/markets/commodities/metals/gold


