

Previous Trading Day’s Events (20.05.2024)
______________________________________________________________________
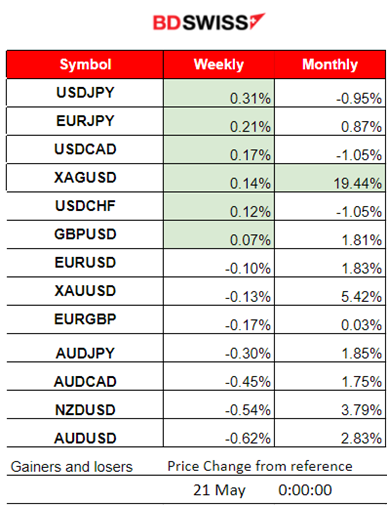
Winners vs Losers
USDJPY steps up to the top of the winner’s list with 0.31% gains followed by EURJPY giving a hint that the JPY started to depreciate heavily. The dollar has also indeed strengthened. Silver remains at the top of the month’s list with nearly 19.5% gains.
 ______________________________________________________________________
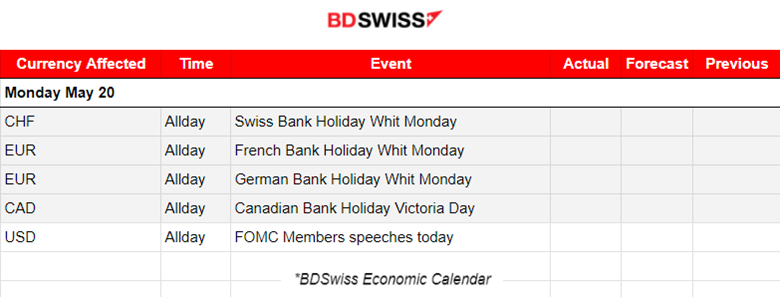
News Reports Monitor – Previous Trading Day (18.05.2024)
Server Time / Timezone EEST (UTC+03:00)
- Midnight – Night Session (Asian)
No major news announcements, no major figure releases.
- Morning – Day Session (European and N. American Session)
No major news announcements, no major figure releases. During the third Conference on the International Roles of the U.S. Dollar Fed’s Waller did not comment on the monetary policy or the economic outlook.
General Verdict:
 __________________________________________________________________
FOREX MARKETS MONITOR
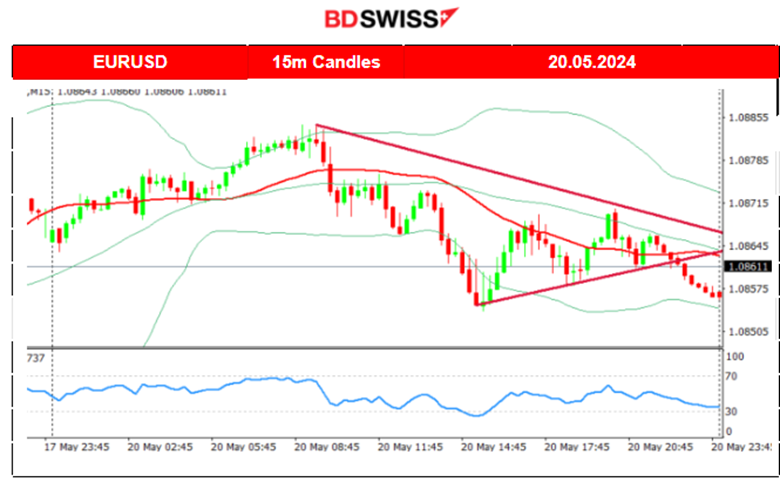
EURUSD (20.05.2024) 15m Chart Summary
Server Time / Timezone EEST (UTC+03:00)
Price Movement
EURUSD moved significantly after the start of the European session, crossing the 30-period MA on its way down and moving steadily until the support level near 1.08540. That was obviously the result of dollar appreciation. With volatility levels remaining low and the absence of significant figure releases, the pair moved sideways and stayed close to the 30-period MA until the end of the trading day.
 ___________________________________________________________________
CRYPTO MARKETS MONITOR
BTCUSD (Bitcoin) Chart Summary 1H
Server Time / Timezone EEST (UTC+03:00)
Price Movement
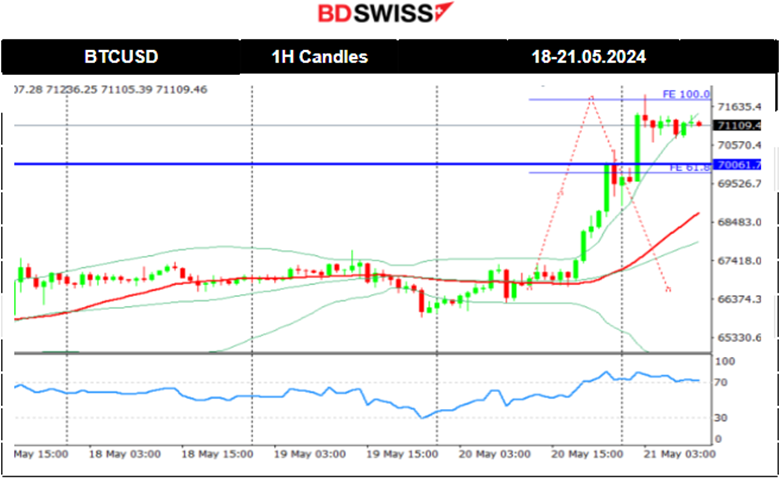
Bitcoin enthusiasts are now gaining confidence that Bitcoin is returning to the upside. The CPI news obviously triggered the jump. As mentioned in our analysis last time, retracement followed eventually with Bitcoin returning to the 61.8 Fibo level before again moving upwards.
On the 17th of May, the price eventually moved upwards, crossing over the 67K USD level but remained close. Since that day a consolidation phase took place with the 30-period MA to turn sideways and the mean to remain at 67K USD. The price tested that resistance many times without success.
A jump occurred yesterday with the price reaching 70K as mentioned in our previous analysis. It actually saw a further increase today with the price reaching a peak at 72K. We are looking at an upward movement with an emerging opportunity for a retracement. Overbought territory on the H1 Chart with RSI 14 with a 61.8 Fibo target back on the 70K level.
 Crypto sorted by Highest Market Cap:
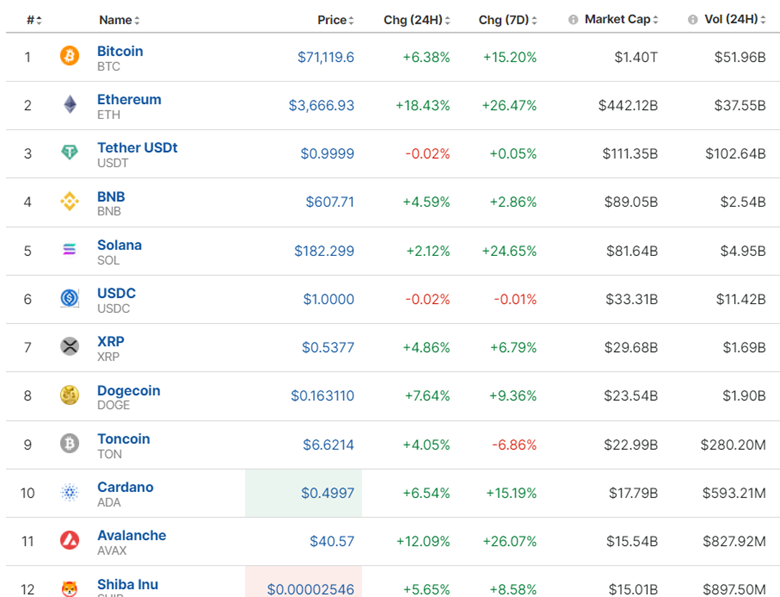
The market got a boost yesterday. Ethereum jumped with gains of 18.43% in 24 hours. Retracement could take place today for Cryptos that experienced a sharp jump.
Source: https://www.investing.com/crypto/currencies
______________________________________________________________________
EQUITY MARKETS MONITOR
S&P500 (SPX500) 4-Day Chart Summary
Server Time / Timezone EEST (UTC+03:00)
Price Movement
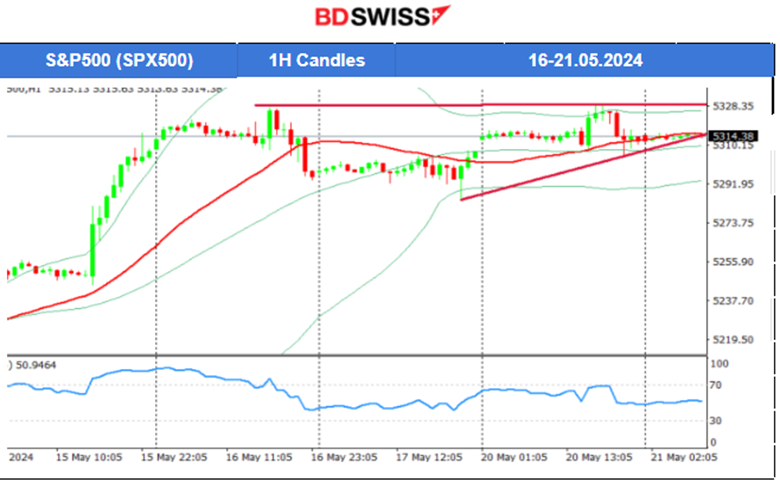
On the 15th of May, the U.S. CPI report caused dollar depreciation and a jump in U.S. stocks. On the 16th of May, the index moved upwards again until it found strong resistance that marked the reversal to the downside. Dollar strengthening and not-so-interesting unemployment claims figures pushed the index to cross the 30-period MA and to settle at the 61.8 Fibo level. On the 17th of May, the index moved with low volatility on the sideways and around the MA with a mean of 5,300 USD. On the 20th of May, the index saw a very volatile start to the stock market session moving to the upside, however, it reversed later rapidly back to the intraday MA and closed flat. We experienced mixed price path data for U.S. indices yesterday. Very strange and rare to look at all three indices closing the sessions in 3 different directions. NAS100 jumped and closed higher while the SPX500 closed flat after a similar volatile session. US30 (Dow Jones) dropped instead.
 ______________________________________________________________________
COMMODITIES MARKETS MONITOR
USOIL (WTI) 4-Day Chart Summary
Server Time / Timezone EEST (UTC+03:00)
Price Movement
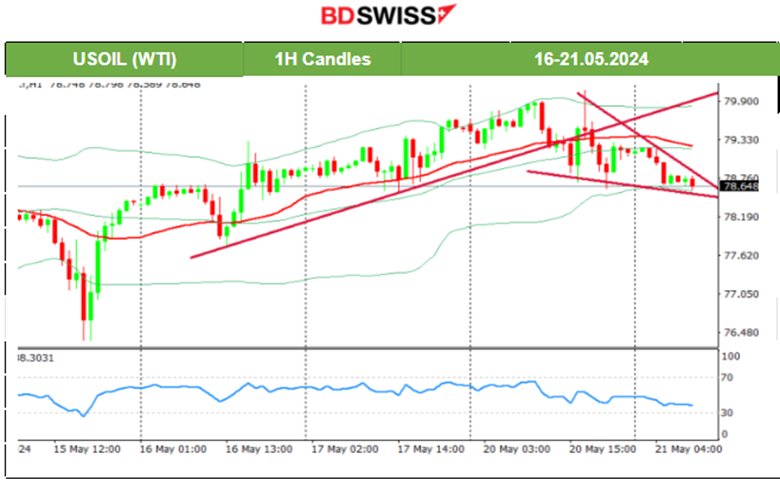
After the news on the 16th of May, Crude oil started a steady path to the upside remaining above the MA. As mentioned in our previous analysis, the path looked like an upward wedge, if not a channel, that the price followed as it moved to the upside and a potential opportunity to trade upon breakout was taking place. The price eventually experienced a breakout to the downside moving away from the wedge and indicating the end of the uptrend. A triangle formation is now in place, with emerging opportunities for a breakout in either direction. 79.90 USD/b seems to be the target resistance level if a breakout to the upside occurs.
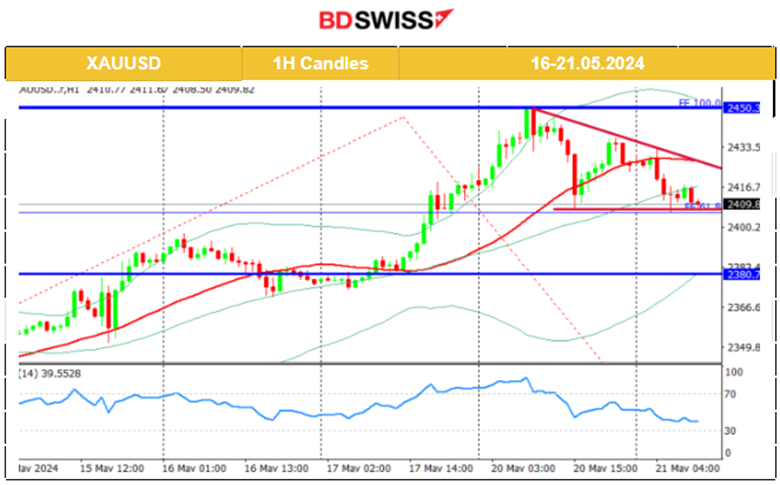
 XAUUSD (Gold) 4-Day Chart Summary
Server Time / Timezone EEST (UTC+03:00)
Price Movement
On the 17th of May, Gold moved to the upside after gaining strong momentum confirming the continuation of an uptrend. Iran’s hardliner President Ebrahim Raisi was killed in a helicopter crash, the country’s state media has said. On Monday, the Iranian Red Crescent confirmed the bodies of the president and others who died in the crash had some bullish impact on Gold. The demand for bullion assets was further bolstered by heightened military action between Russia and Ukraine. Both nations launched strikes against one another over the weekend. On the 20th the price indeed continued with an upward and rapid movement but after reaching the peak of 2,450 USD/oz and in an overbought territory, the market decided to sell. The 61.8 Fibo level was reached as the price returned to the 2,400 USD/oz level. A triangle formation now indicates the important support at 2,400 USD/oz and the potential to move to the downside upon breakout, to the 2,380 USD/oz level. Gold has however shown great potential for an upside movement and trend with a potential to break the triangle to the upside instead and test again that 2,450 USD/oz level in the future.
 ______________________________________________________________
News Reports Monitor – Today Trading Day (21 April 2024)
Server Time / Timezone EEST (UTC+03:00)
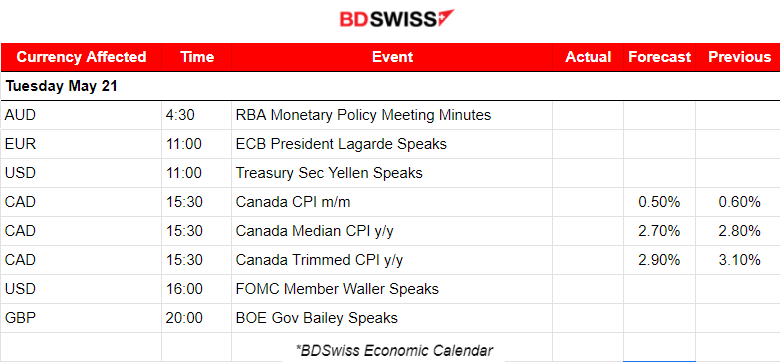
- Midnight – Night Session (Asian)
Minutes of the May 2024 Reserve Bank of Australia (RBA) meeting were released at 4:30. The Board agreed it was difficult to either rule in or rule out future changes in the cash rate. The flow of data had increased risks of inflation staying above target for longer and they expressed their limited tolerance for inflation returning to target later than 2026. The market reacted with an AUD depreciation at that time. AUDUSD dropped near 25 pips before retracing to the intraday MA.
- Morning – Day Session (European and N. American Session)
At 15:30 the CPI inflation data for Canada will be released and they are expected to show an inflation slowdown. Canada’s employment change figures are showing a hotter picture though this year with continuing average growth and that could make unlikely the event of a reduction in those numbers. The unemployment rate on the other hand rose but remained stable at 6.1% giving a mixed picture as far as the labour market is concerned. On a monthly basis, inflation does not seem to reduce and an upward surprise in the figures will potentially cause CAD appreciation at the time of the release.
General Verdict:
______________________________________________________________


