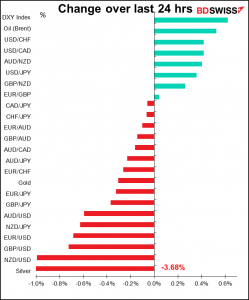
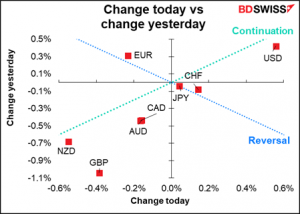
Rates as of 05:00 GMT
Market Recap
The dollar continued to rally despite – or because of? – the chaos with the US government. The strength of the dollar reminds me of what happened during the 2008/09 Global Financial Crisis, when the dollar soared even though the source of the world’s financial problems was the collapse of the US housing market and the ensuing crisis in the US “shadow banking” system. The US may be the source of the problems but it’s still the safest of the safe haven markets. JPY and CHF, the other safe-haven currencies, also strengthened, but only marginally.
There have been some signs of progress in averting a shutdown of the US government. Senate Majority Leader Schumer said that senators had agreed on a stopgap funding measure to fund the government through Dec. 3. The Senate will vote on the measure this morning. That’s great, but it won’t help if the debt ceiling isn’t removed and the government runs out of money on Oct. 18th. The House Wednesday approved an extension of the debt ceiling through 2022, but Republican opposition in the Senate will almost certainly doom the measure.
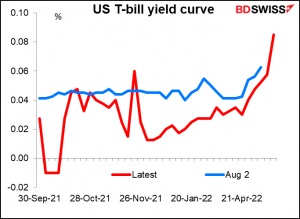
The T-bill market is still pricing in problems with the US government from Oct 18th to early November. Notice how the T-bills maturing by Oct. 12th have a negative yield – that means they’re trading at a premium because buyers can be assured that they’ll get their money back. But all of a sudden, the bills maturing Oct. 14th yield 0.028% and for Oct. 19th it jumps to 0.045% since they’re pricing in some risk of a delay in payment. Then once we get to Nov. 2nd it falls to 0.040%, then 0.035%, etc. as the market assumes the problems will be over by then (I don’t know why there’s a spike at Nov. 23rd but this does not appear to be a data error – it’s been that way for several days.)
Compare the current yield curve to the quite flat Aug. 2nd curve, before all these problems became evident, to see how the risk is distorting the pricing.
Elsewhere, GBP continues to decline as the market worries about the Bank of England getting forced into a policy mistake – having to hike rates due to higher inflation despite a weakening economy. The currency has given up all its year-to-date gains vs USD and is down 1.7% (but is still up 3.6% vs EUR).
EUR had been holding up well, especially as money coming out of GBP was going into EUR, but it fell sharply on Wednesday to hit an 11-month low. The question today will be whether 1.16 can hold. If it breaks, then we could be headed to the June 2020 lows around 1.12.
Today’s market

Note: The table above is updated before publication with the latest consensus forecasts. However, the text & charts are prepared ahead of time. Therefore there can be discrepancies between the forecasts given in the table above and in the text & charts.
It’s the last working day of the month so there will be some portfolio rebalancing at the close of the London and New York days. It looks like there could be some selling of JPY and buying of USD, EUR, and AUD. Some of this money was probably transacted yesterday though so the trades could settle before the end of the month.
The day starts with German employment data, which I discussed yesterday. It’s expected to show a small decline in the number of unemployed but no change in the unemployment rate. The European Central Bank doesn’t take employment into account the way other central banks do so a not-particularly-dramatic reading like this probably won’t have much impact on the currency.

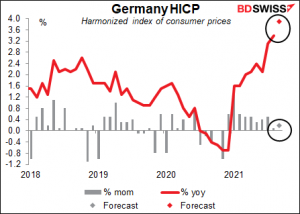
Then the German harmonized index of consumer prices (HICP). The yoy rate of change is expected to accelerate notably, but the mom change is forecast to be a modest +0.2%., indicating that a lot of the yoy rise still has a lot to do with base effects. Still, it appears that the market pays a bit more attention to the mom rate of change than the yoy rate and so the faster inflation could be positive for EUR.
When the US opens for business, we get two indicators at the same time: the final estimate of Q2 GDP and the initial jobless claims. By this time the GDP figures are old history, especially with the virus distorting activity; meanwhile, all eyes are on the labor market as the main factor the Fed is watching to determine if they can start tapering down their bond purchases in November. I therefore think the jobless claims are likely to be the more important indicator.
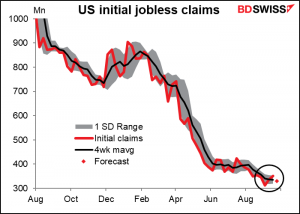
Initial jobless claims are expected to be down 21k, which would be a big relief after two consecutive weeks of increase (three out of the last five weeks).
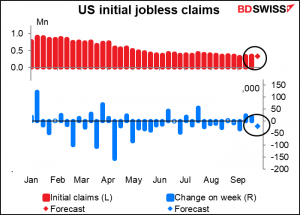
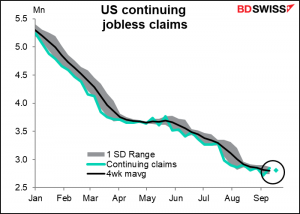
Initial claims are back up to where they were a month ago…not good.
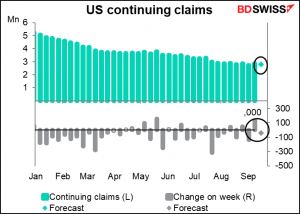
Continuing claims also rose last week – is something happening with the labor market? This week they’re expected to decline by 55k.
US Treasury Secretary Yellen and Fed Chair Powell reprise their Tom-and-Jerry act for the House Financial Services Committee. They testified before the Senate on Tuesday. Policy isn’t the focus of these hearings and given that they just testified on the same subject, I don’t expect anything new. But you never know.
Then overnight we get a number of important Japanese indicators. The most important one is the Bank of Japan’s Quarterly Survey of Short-Term Economic Conditions, known universally by its Japanese acronym, the Tankan (also Friday).
The forecasts are pretty grim. Both the large manufacturers & non-manufacturers diffusion indices (Dis) are expected to be down 1 point from Q2. They’ve steadily increased since the pandemic sent them plunging in Q2 last year – this would be the first decline. And forecasts for Q4 are barely any better, up 1 point for manufacturers and 2 points for non-manufacturers. Protracted cuts in un auto production are hurting manufacturing, while the outbreak of the delta variant has dampened private consumption and kept Japan’s service sector in contraction, a global outlier.
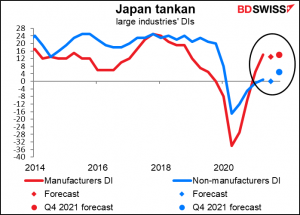
The impact of the tankan on the exchange rate is hard to predict. That’s because the determining factor may be how the figures affect the stock market. A good figure that boosts the stock market could result in a “risk-on” sentiment that depresses the yen, contrary to what one might expect. So watch the stock market as well as the currency when the figures come out.
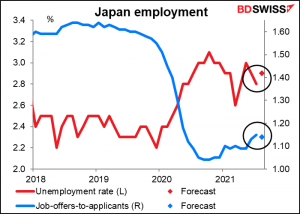
Japan’s unemployment rate is expected to tick up one tick, while the job-offers-to-applicants ratio is forecast to fall one tick. So not good. But whatever impact this might have will probably be overshadowed by the tankan.
Then we start with the final manufacturing purchasing managers’ indices (PMIs). All of them were in the “decelerating expansion” quadrant – that is, they’re still in expansionary territory but not as much as they were three months ago. Japan looks particularly vulnerable.

