

Previous Trading Day’s Events (26 Feb 2024)
The gains came on the back of MicroStrategy disclosing another large purchase of about 3,000 bitcoins for $155 million.
Recent analysis shows that there is a surge of funds into bitcoin ETFs. another factor that explains the bullish phenomenon is the upcoming “halving event”
Source:
https://www.cnbc.com/2024/02/27/bitcoin-surpasses-56000-benchmark-in-latest-rally.html
______________________________________________________________________
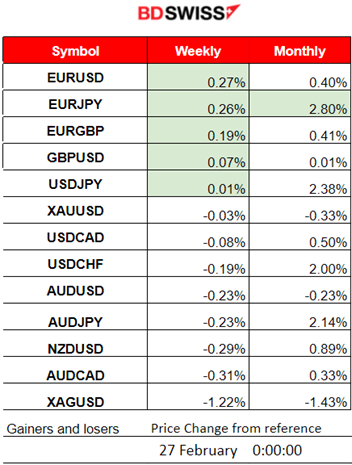
Winners vs Losers
EURUSD is on the top with 0.27% gains for this week as the dollar has weakened significantly in the last few days. EURJPY remains on the top of the month’s winners with 2.80% gains as the JPY weakens further.
 ______________________________________________________________________
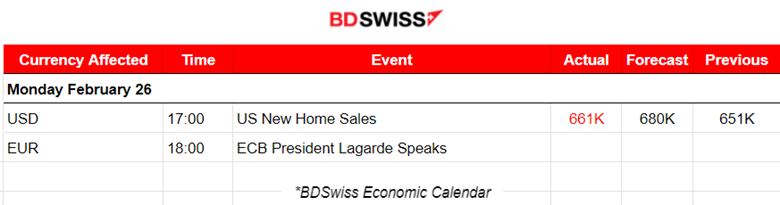
News Reports Monitor – Previous Trading Day (23 Feb 2024)
Server Time / Timezone EEST (UTC+02:00)
- Midnight – Night Session (Asian)
No important announcements, no special scheduled releases.
- Morning – Day Session (European and N. American Session)
No important announcements, no special scheduled releases.
General Verdict:
 ____________________________________________________________________
FOREX MARKETS MONITOR
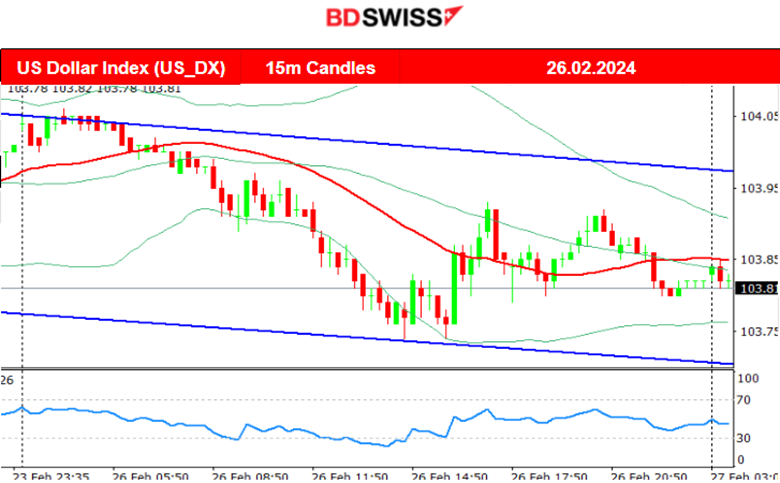
EURUSD (26.02.2024) 15m Chart Summary
Server Time / Timezone EEST (UTC+02:00)
Price Movement
Low volatility during the Asian session kept the pair on the sideways path. At the start of the European session, the pair moved rapidly to the upside until it found resistance near 1.08580. That was the end of the movement and retracement back to the 30-period MA and the 61.8 Fibo level followed. EURUSD remained on the sideways, close to the mean, experiencing lower volatility until the end of the trading day.
 ___________________________________________________________________
CRYPTO MARKETS MONITOR
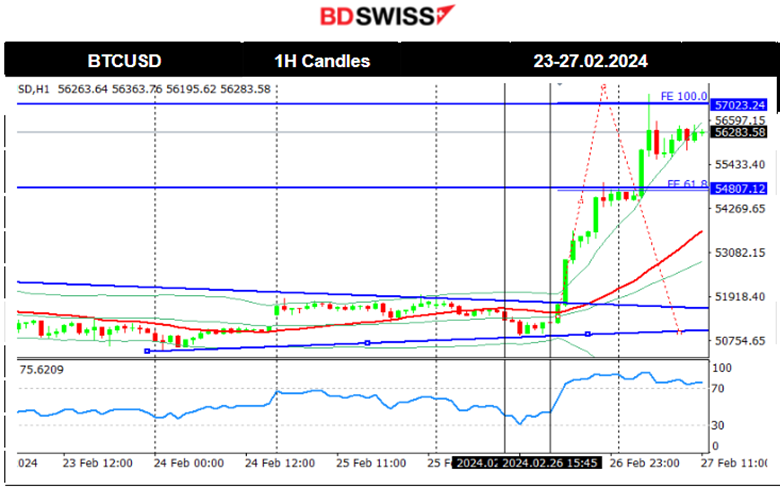
BTCUSD (Bitcoin) Chart Summary
Server Time / Timezone EEST (UTC+02:00)
Price Movement
Bitcoin settled sideways for now but is governed with high volatility on its way around the 30-period MA. 52,000 USD seems to be the important resistance level. The support is apparently at 50,500 USD. On the 24th Feb, the price moved to the upside, reversing from the previous drop and after the retracement it settled near the 61.8 Fibo level near 51,450 USD. Bitcoin saw a surprise jump on the 26th Feb. The annualised funding rate in bitcoin perpetual futures listed on Binance surpassed 100% for the first time in at least a year. An upward shock took place with a chance of retracement. it reached 57,000 USD in a very short period of time from the mean near 51,500 USD. This could be an opportunity for traders to short-sell. The next possible support at 54,800 USD.
Related article:
 Crypto sorted by Highest Market Cap:
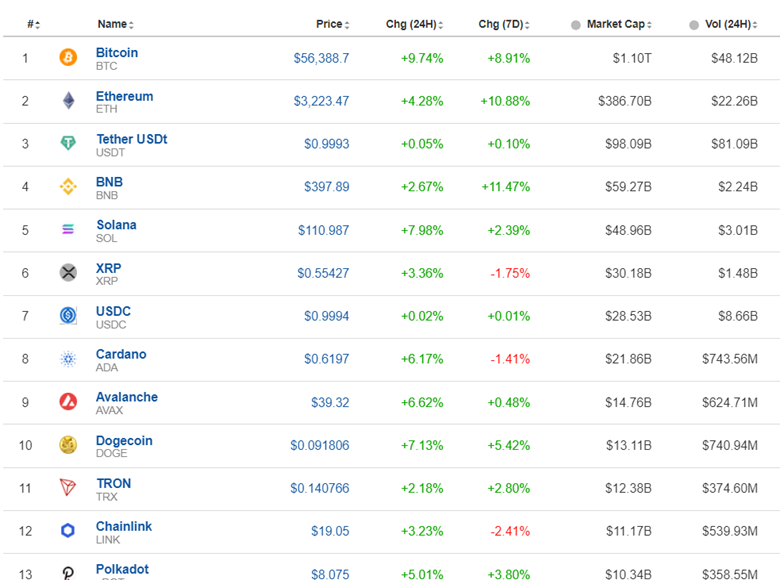
The crypto market gains activity and volume with assets gaining significantly. Bitcoin’s price grew over 10% over two days yesterday. Analysts see a surge of funds into bitcoin ETFs and the asset’s upcoming “halving event” as other bullish factors.
Source: https://www.investing.com/crypto/currencies
https://www.cnbc.com/2024/02/27/bitcoin-surpasses-56000-benchmark-in-latest-rally.html
______________________________________________________________________
EQUITY MARKETS MONITOR
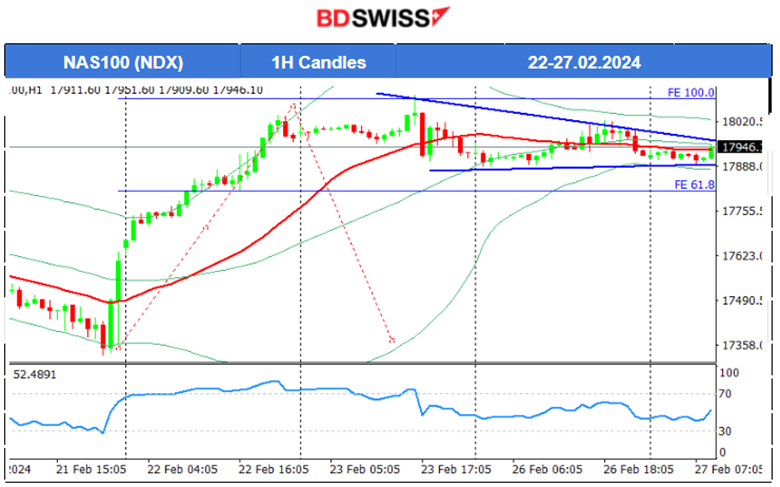
NAS100 (NDX) 4-Day Chart Summary
Server Time / Timezone EEST (UTC+02:00)
Price Movement
Global stocks rallied on the 21st Feb and after 22:00. All U.S. indices experienced a big jump to the upside. The tech-heavy Nasdaq 100 index jumped over 1.8%. The boss of Nvidia said artificial intelligence (AI) is at a “tipping point” as it announced record sales. It reported that revenues surged by 265% in the three months to 28th January, compared to a year earlier. On the 23rd Feb, the index moved to the upside further, breaking the 18,000 USD resistance level and reaching the one near the 18,100 USD before retracement took place. Even though the resistance was identified correctly, the retracement is not completed yet, moving back to the 61.8 Fibo level. As time goes by it is more and more unlikely that it will happen, thus we could see indices rising instead as more fundamental factors and reports take place.
 ______________________________________________________________________
COMMODITIES MARKETS MONITOR
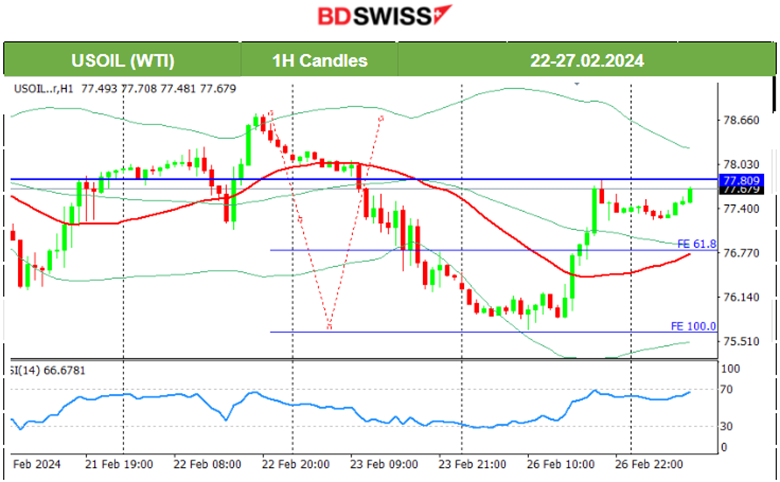
USOIL (WTI) 4-Day Chart Summary
Server Time / Timezone EEST (UTC+02:00)
Price Movement
On the 21st the price continued with the drop but stopped when it reached the support near the 76.20 USD/b level. It soon reversed to the upside heavily, crossing the 30-period MA on its way up and reaching above 78 USD/b. The 22nd Feb was quite volatile. The price reached the resistance near 78.7 USD/b before reversing fully to the downside. On the 23rd Feb, the price moved below the MA and dropped heavily, reaching the support near 75.85 USD/b. The retracement happened eventually on the 26th Feb, as stated in our previous report. Crude oil reversed and even crossed the MA on its way up. Currently, it seems that it is seeking to break higher levels.
TradingView Analysis:
https://www.tradingview.com/chart/USOIL/BC3M2BwO-USOIL-Post-Reversal-26-02-2024/
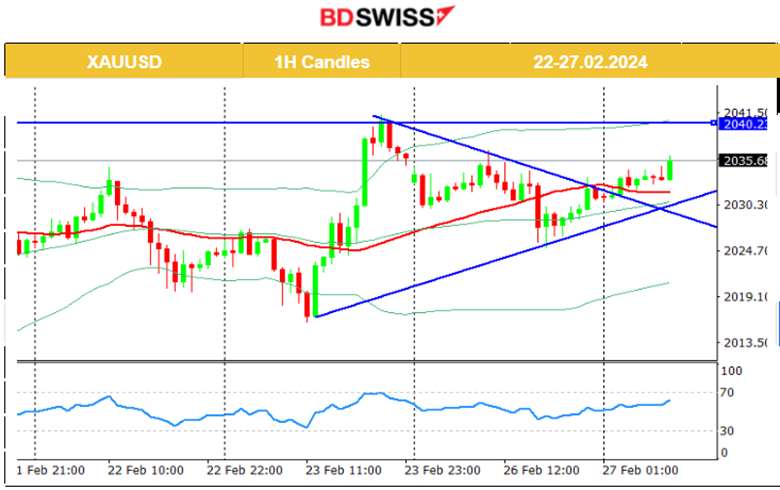
 XAUUSD (Gold) 4-Day Chart Summary
Server Time / Timezone EEST (UTC+02:00)
Price Movement
The divergence eventually led to a drop back to 2020 USD/oz on the 21st Feb as stated in our previous analysis. After the drop, Gold reversed to the upside as the dollar depreciated heavily. On the 22nd, Gold experienced a significant drop, finally settling below the MA signalling finally the end of the uptrend. However, on the 23rd Feb, Gold moved to the downside, finding support at 2016 USD/oz and in a short period of time reversed significantly to the upside crossing the 30-period MA on its way up reaching the resistance at 2041 USD/oz. That signalled a new uptrend perhaps. The market opening found the price at the retracement level of 61.8 Fibo near 2033 USD/oz.
 ______________________________________________________________
News Reports Monitor – Today Trading Day (27 Feb 2024)
Server Time / Timezone EEST (UTC+02:00)

- Midnight – Night Session (Asian)
No important announcements, no special scheduled releases.
- Morning – Day Session (European and N. American Session)
Durable goods orders for the U.S. will be reported on the 27th Feb at 15:30 and will probably cause a moderate intraday shock affecting the USD The lower expected figure reflects the expectation of an easing in spending. Higher than expected figure release could push USD appreciation during that time.
At 17:00 the CB Consumer Confidence report will shed light on how the consumers are forming expectations, taking into consideration the recent developments in regards to inflation figures and expectations about short-term interest rates. The Richmond Manufacturing index is expected to see an improvement to a less negative figure.
General Verdict:
______________________________________________________________


