

Previous Trading Day’s Events (26 Jan 2024)
“The inflation trajectory is improving, giving the Fed leeway to cut rates this year,” said Jeffrey Roach, chief economist at LPL Financial in Charlotte, North Carolina. “However, the Fed has further work to do and should not be tempted to declare ‘mission accomplished.'”
Excluding the volatile food and energy components, the PCE price index climbed 0.2% after rising 0.1% in November. The so-called core PCE price index increased 2.9% year-on-year, the smallest gain since March 2021, after rising 3.2% in November.
The Fed tracks the PCE price measures for its 2% inflation target. Monthly inflation readings of 0.2% over time are necessary to bring inflation back to target.
“Inflation at 2.0% on a quarter-on-quarter basis, for two quarters in a row, is a good reason to start cutting rates,” said Chris Low, chief economist at FHN Financial in New York. “The year-on-year core CPI at 2.9% gives the Fed cover to wait a few months longer and still fulfil (Chair Jerome) Powell’s prediction the Fed will cut rates before inflation reaches 2%.”
______________________________________________________________________
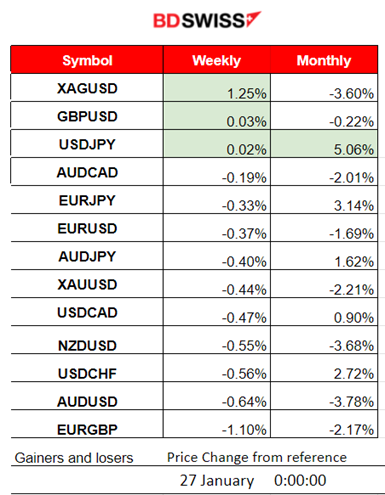
Winners vs Losers
Silver (XAGUSD) led last week with 1.25% gains. USDJPY remains the top winner for the month with 5.00% gains. Unusual performance for Silver, and Gold remains low. The USD remained at the same level yesterday.
 ______________________________________________________________________
News Reports Monitor – Previous Trading Day (26 Jan 2024)
Server Time / Timezone EEST (UTC+02:00)
- Midnight – Night Session (Asian)
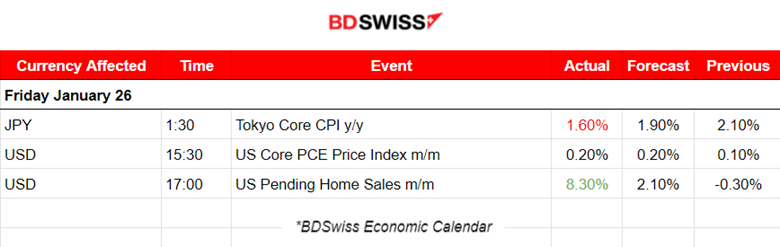
According to the report at 1:30, Tokyo inflation was reported lower than expected at 1.6%. The figure was the weakest since March 2022 resulting from falls in the cost of energy and from less gains in the prices of accommodation and processed food. At the time of the release, the market reacted with JPY depreciation. The USDJPY jumped near 30 pips before retracement followed.
- Morning–Day Session (European and N. American Session)
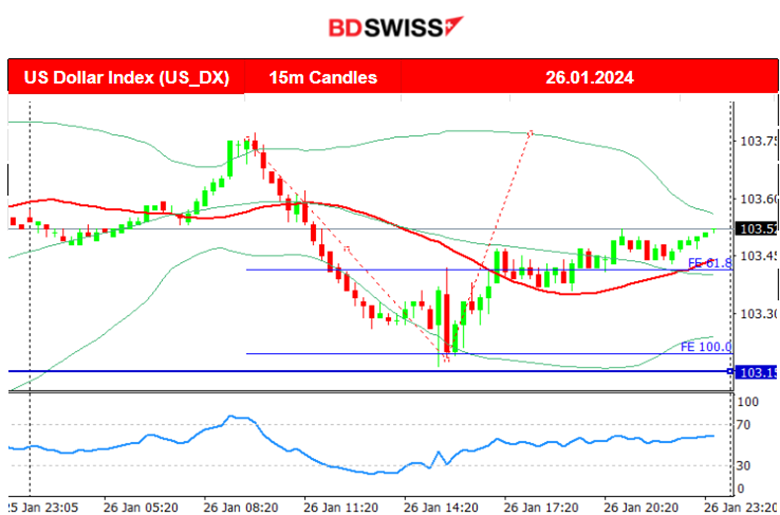
At 15:30, the U.S. Core PCE Price Index figure was reported the same as expected, 0.2%. This measure of inflation strips out volatile energy and food prices. Despite the significant reduction, achieved by keeping interest rates elevated, it fell to a 2.9% year-over-year rate but inflation is still running above the Fed’s goal of 2% annual price growth. Despite that, the Fed is eying rate cuts soon. The market reacted with an intraday shock at that time and no clear direction. The USD found resistance in weakening further and found more strength after the report, with the dollar index returning back to the intraday MA.
General Verdict:
 ____________________________________________________________________
FOREX MARKETS MONITOR
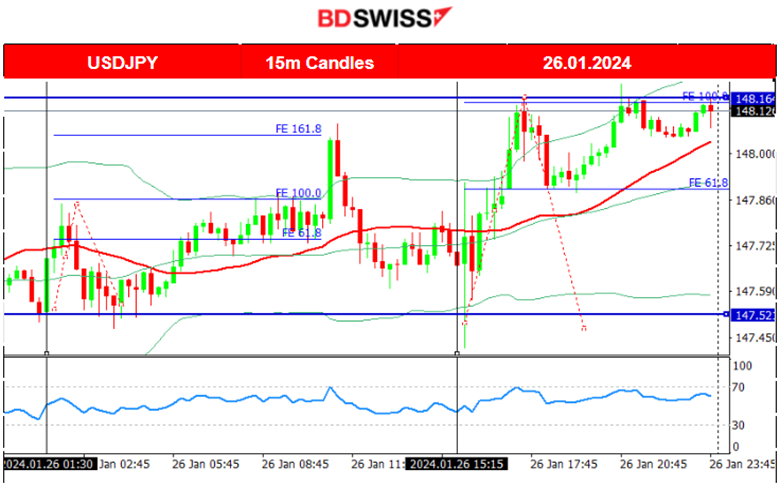
USDJPY (26.01.2024) 15m Chart Summary
Server Time / Timezone EEST (UTC+02:00)
Price Movement
The pair experienced a moderate jump after the release of the Tokyo inflation news and reversed back to 147.5 support before initiating an upward long path. After breaking the resistance at 147.8 it moved further upwards before reversing again. The price was very close to the 30-period MA when the U.S. Core PCE Price Index figure was released causing USD depreciation and the USDJPY to drop sharply before reversing immediately after the drop. After that, USD strengthened and JPY weakened causing the pair to move significantly on the upside, closing the day higher.
 ___________________________________________________________________
CRYPTO MARKETS MONITOR
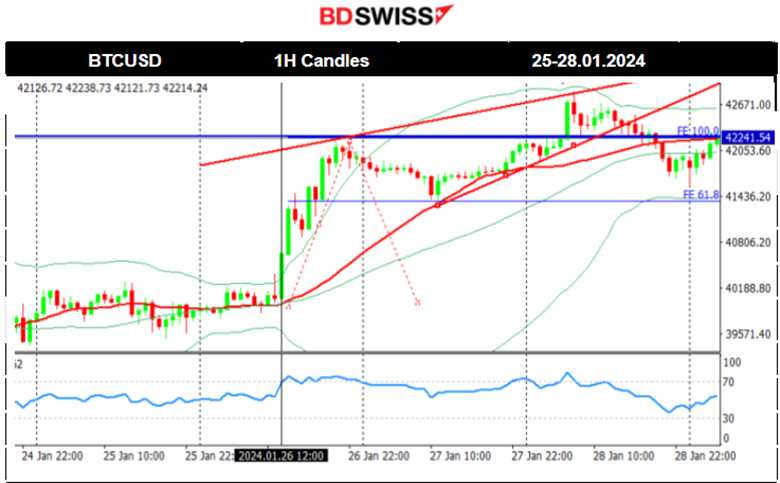
BTCUSD (Bitcoin) Chart Summary 1H Timeframe
Server Time / Timezone EEST (UTC+02:00)
Price Movement
Bitcoin started to recover slowly from the recent downturn that followed after the long-awaited ETF approval from the U.S. regulator for some major asset managers. On the 26th Jan, it recorded a rapid price movement to the upside, leaving from the 40,000 USD mean, and reaching the resistance 42,250 USD. Retracement followed back to the 61.8 Fibo level that coincides with the 30-period MA. The price continued upwards steadily breaking that resistance and reaching the next at 42,800 USD before it reversed back to the MA and finally settled near the 42,250 USD level.
Crypto sorted by Highest Market Cap:
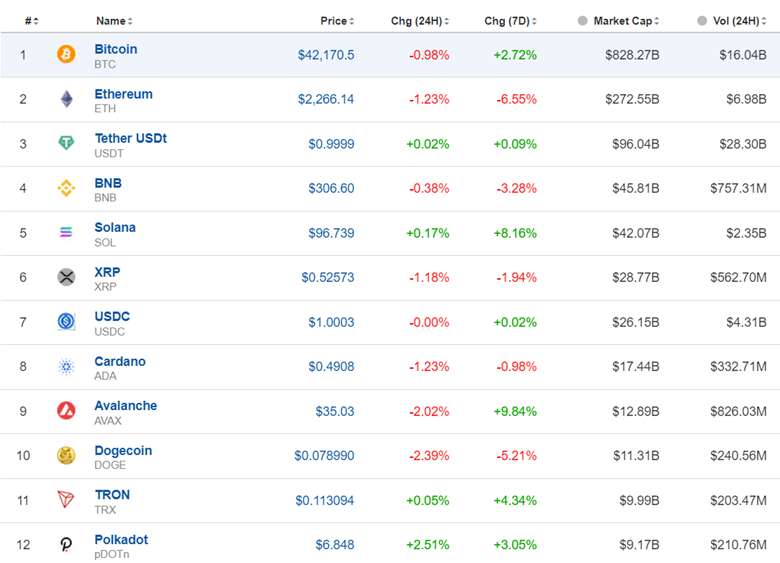
Obviously, the market is experiencing some recovery. Bitcoin, Solana, Avalanche, and Tron above are gainers for the last 7 days, however other crypto show losses. There is mixed data for now.
Source: https://www.investing.com/crypto/currencies
______________________________________________________________________
EQUITY MARKETS MONITOR
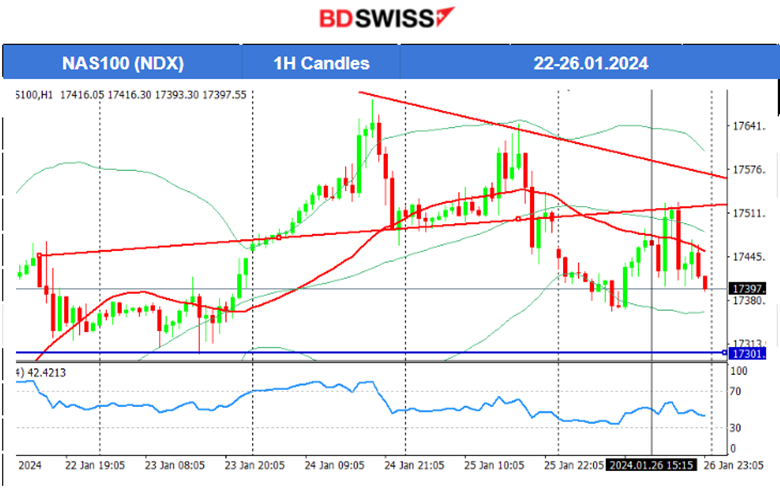
NAS100 (NDX) and S&P500 (SPX500) 4-Day Chart Summary
Server Time / Timezone EEST (UTC+02:00)
Price Movement
On the 24th June, the market conditions changed with the stock market showing signs of uncertainty and investors’ risk appetite to change. The NAS100 index experienced phases of huge drops last week, bringing it down below the 30-period MA and giving signals that an uptrend no longer holds. It seems that it will further test the lows and after breaking the support near 17360 USD, it might drop further to 17300 USD.
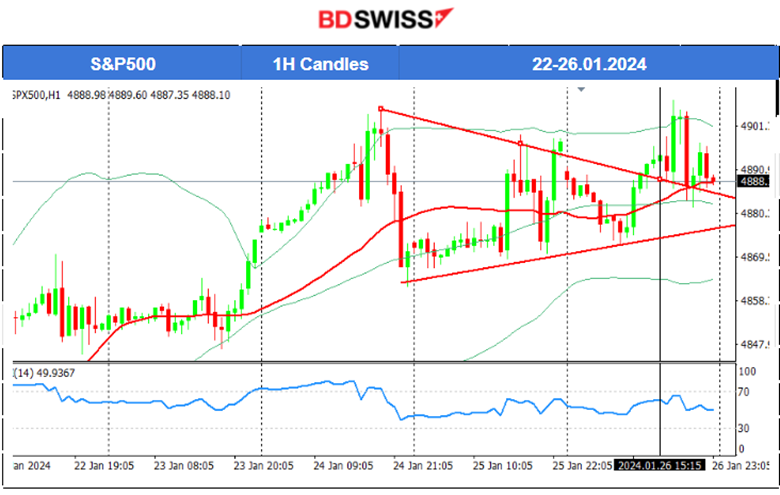
Stocks in the more diversified S&P 500 index, remain higher, experiencing more resilience. The index formed a triangle that was broken on the upside on the 26th Jan. The index jumped higher after the breakout but found resistance near 4908 USD and reversed soon after back to the MA. The market is quite volatile and remains uncertain. There is no clear one-sided path at the moment.
 ______________________________________________________________________
COMMODITIES MARKETS MONITOR
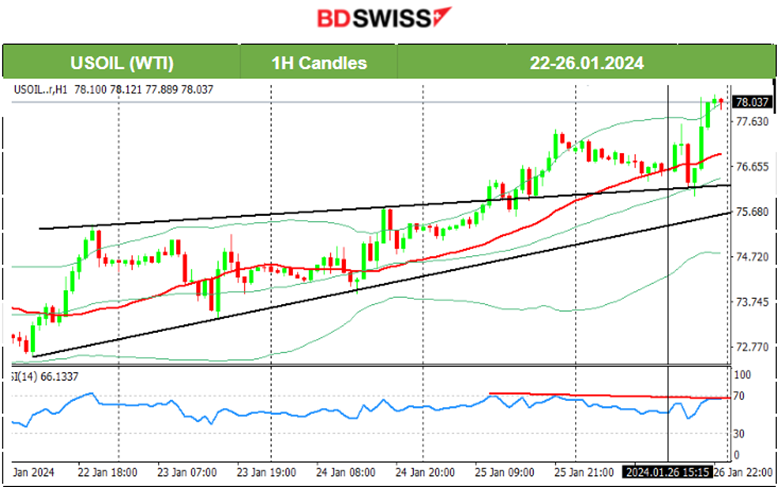
USOIL (WTI) 4-Day Chart Summary
Server Time / Timezone EEST (UTC+02:00)
Price Movement
Crude oil moved higher, as mentioned in our previous report since technicals were strongly supporting an upward movement. During last week the price had steadily formed an upward wedge that was broken to the upside on the 25th. Crude oil moved upwards to find resistance at near 77.5 USD/b before retracing to the 30-period MA and bouncing upwards until it reached 78 USD/b.
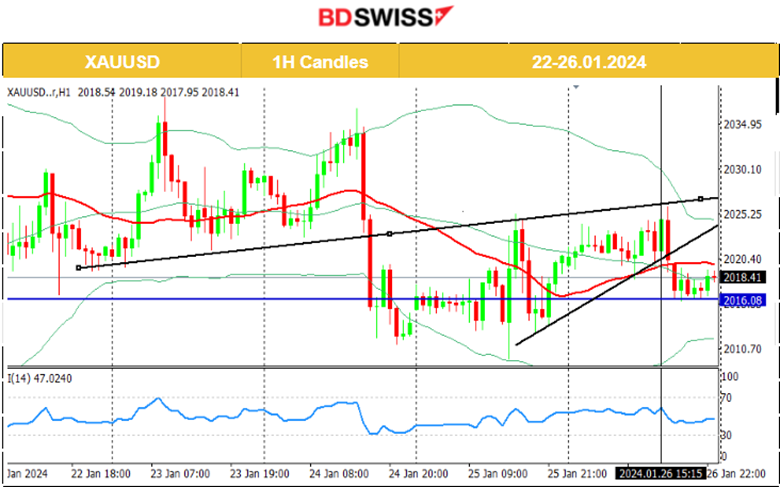
XAUUSD (Gold) 4-Day Chart Summary
Server Time / Timezone EEST (UTC+02:00)
Price Movement
A triangle formation was apparent on the 24th Jan. The price dropped heavily breaking the triangle formation and moving to the 2010 USD/oz support level. Retracement followed back to 2020 USD/oz and the 61.8 Fibo level. On the 25th, gold experienced high volatility but the path remained sideways overall. That day it reached the resistance of 2025 USD/oz when it jumped after the ECB news, and reversal followed soon after back to the lows. It finally retraced later back to 2020 USD/oz. On the 26th Gold tested the resistance at near 2025 USD/oz without success during the volatile moves that took place, caused by the U.S. PCE Price Index news. It reversed immediately back to the MA continuing with the path around it and settled near the range 2018-2020 USD/oz once more.
 ______________________________________________________________
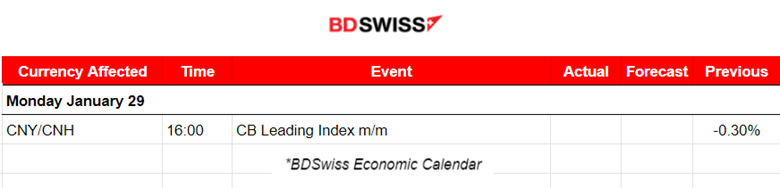
News Reports Monitor – Today Trading Day (29 Jan 2024)
Server Time / Timezone EEST (UTC+02:00)
- Midnight – Night Session (Asian)
No important news announcements, no major scheduled figure releases.
- Morning–Day Session (European and N. American Session)
No important news announcements, no major scheduled figure releases.
General Verdict:
______________________________________________________________


