

Previous Trading Day’s Events (16 Feb 2024)
The above-expectations rise in consumer prices in January shift bets that the Federal Reserve would start cutting interest rates in June instead of May.
“The Fed isn’t losing the inflation fight, but they aren’t winning either,” said Christopher Rupkey, chief economist at FWDBONDS in New York. “The data are consistent, that January is a problematic month for inflation. There could be some seasonal adjustment problems as prices move up the most each year in the dead of winter.”
Services increased 0.6%, the largest rise since July 2023.
“We would not dismiss strength in January services prices as a one-off phenomenon,” said Veronica Clark, an economist at Citigroup in New York. “This upward pressure can continue, especially for sectors like medical services that still face tight labor markets.”
Source: https://www.reuters.com/markets/us/us-producer-prices-rise-more-than-expected-january-2024-02-16/
______________________________________________________________________
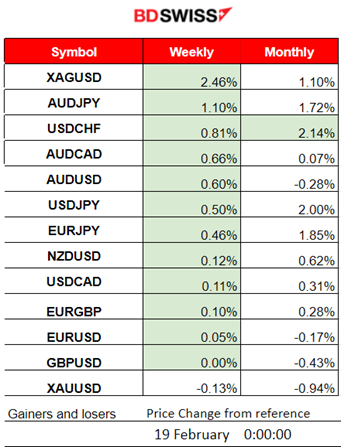
Winners vs Losers
Silver (XAGUSD) remains on the lead with 2.46% gains last week. The USDCHF is on the top for the month with 2.14% gains so far.
 ______________________________________________________________________
News Reports Monitor – Previous Trading Day (16 Feb 2024)
Server Time / Timezone EEST (UTC+02:00)
- Midnight – Night Session (Asian)
No important announcements, no special scheduled releases.
- Morning – Day Session (European and N. American Session)
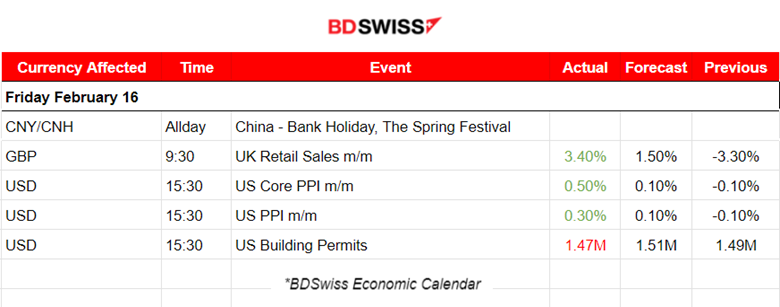
In the U.K. strong retail sales reported at 9:00. This was the largest monthly rise since April 2021 and returned volumes to November 2023 levels. The market reacted with a moderate shock, GBP appreciating momentarily but the effect faded soon.
The PPI data at 15:30 showed that the Producer Price Index for final demand increased 0.3% in January, beating expectations. The Corre PPI increased 0.5%, beating expectations as well for a just 0.1% increase. The market reacted with USD appreciation at the time of the release. The EURUSD dropped near 30 pips before reversing back to the mean.
General Verdict:
 ____________________________________________________________________
FOREX MARKETS MONITOR
EURUSD (16.02.2024) 15m Chart Summary
Server Time / Timezone EEST (UTC+02:00)
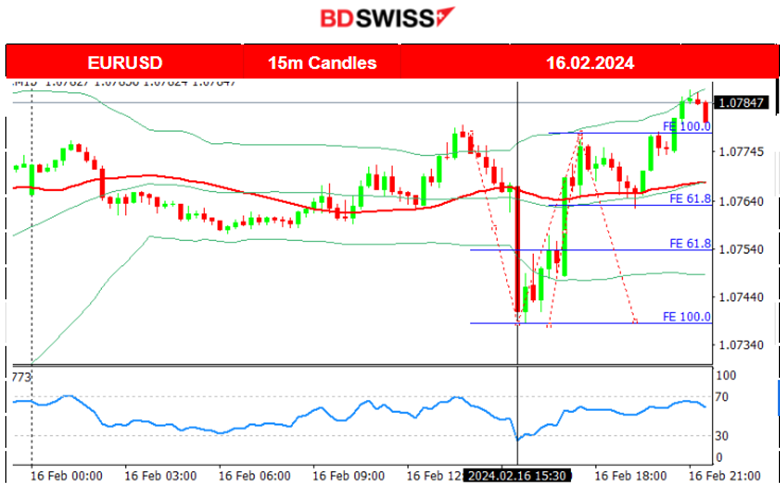
Price Movement
The pair was moving sideways with low volatility until the start of the European session. Volatility started to pick up soon but at 15:30 the PPI news caused USD appreciation and the pair to drop heavily and rapidly, reaching the support near 1.07390. The USD started to depreciate soon after the drop causing the pair to reverse back to the 30-period MA. On its way up it crossed the MA and moved further to the upside finding resistance near 1.07800 before retracing to the MA again and later continuing with upward movement.
 ___________________________________________________________________
CRYPTO MARKETS MONITOR
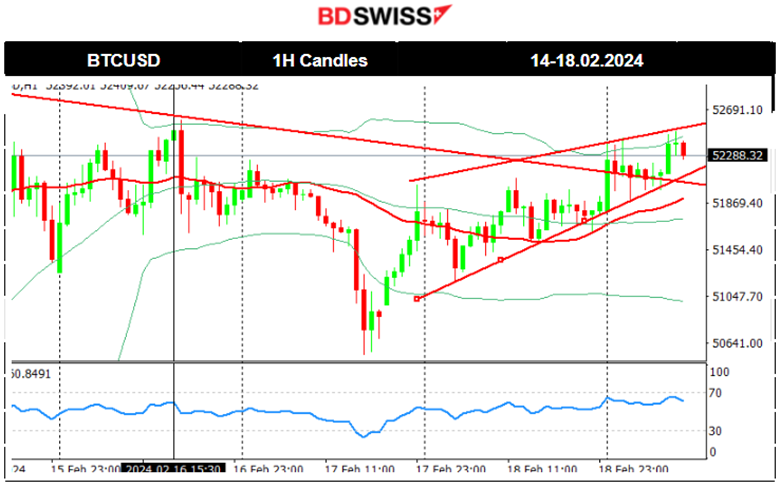
BTCUSD (Bitcoin) Chart Summary
Server Time / Timezone EEST (UTC+02:00)
Price Movement
Early on the 14th Feb, Bitcoin climbed again aggressively reaching up to 52,600 USD on the 14th and even reached 52.800 USD on the 15th Feb before retracing. On the 17th Feb Bitcoin fell rapidly reaching support near 50,550 USD before reversing fully back to the 30-period MA. Since the 17th Feb, it has been on an upward path that forms an upward wedge and is on the way to test more resistance. 52,600 USD seems to be a significant resistance level.
 Crypto sorted by Highest Market Cap:
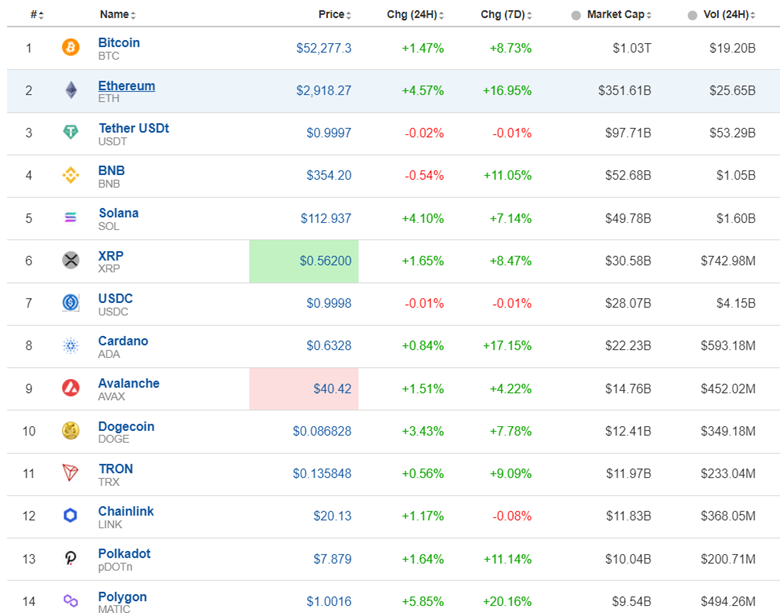
Cryptos still remain high. Currently, the market is trending in the short-term and tests the highs. More breakouts to the upside could spark more investment, thus more gains this week.
Source: https://www.investing.com/crypto/currencies
______________________________________________________________________
EQUITY MARKETS MONITOR
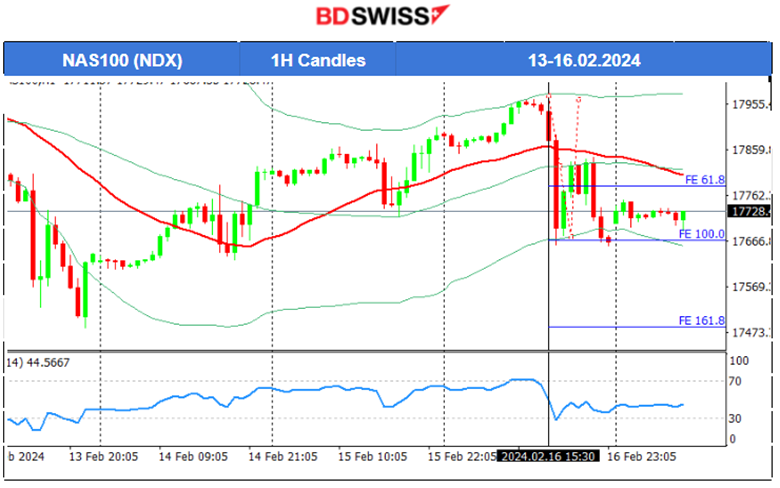
NAS100 (NDX) 4-Day Chart Summary
Server Time / Timezone EEST (UTC+02:00)
Price Movement
On the 14th Feb and 15th Feb, the index climbed further. All three U.S. benchmark indices experienced the same path. On the 16th the index found resistance at 17,970 USD and immediately dropped with the PPI data release for the U.S. The index found support at that time near 17,660 USD before retracing to the 61.8 Fibo level and later back to the 30-period MA. Another drop followed causing the index to close lower and remain close to 17.700 USD. This signals the end of the uptrend and possible sideways but volatile movement if no breakouts to the downside occur soon.
 ______________________________________________________________________
COMMODITIES MARKETS MONITOR
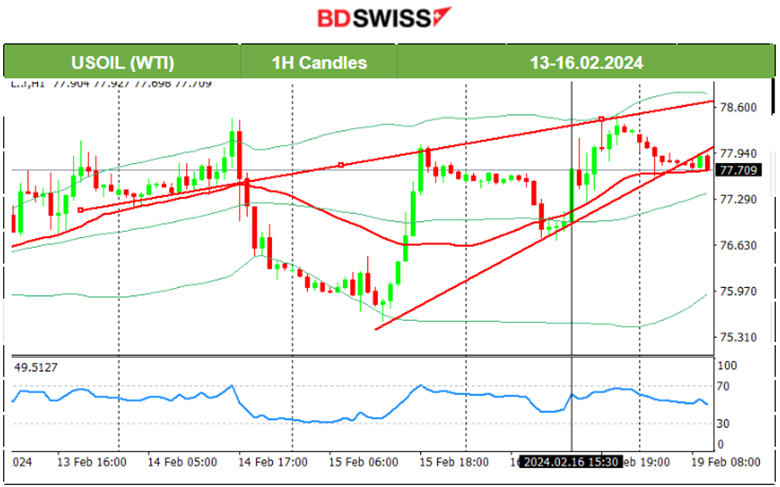
USOIL (WTI) 4-Day Chart Summary
Server Time / Timezone EEST (UTC+02:00)
Price Movement
On the 14th Feb, the release of the Crude oil inventories report at 17:30 caused a price drop that extended until the end of the trading day, about 18 USD drop. The reported figure was indeed a high number, 12M barrels, a huge Crude build. U.S. production is back at record highs. On the 15th Feb correction took place, with the price to reverse almost fully. On the way up, Crude oil crossed the 30-period MA and reached a resistance near 78 USD/b. It soon retraced to the mean on the 16th Feb but bounced back to the upside eventually reaching the resistance at 78.50 USD/b.
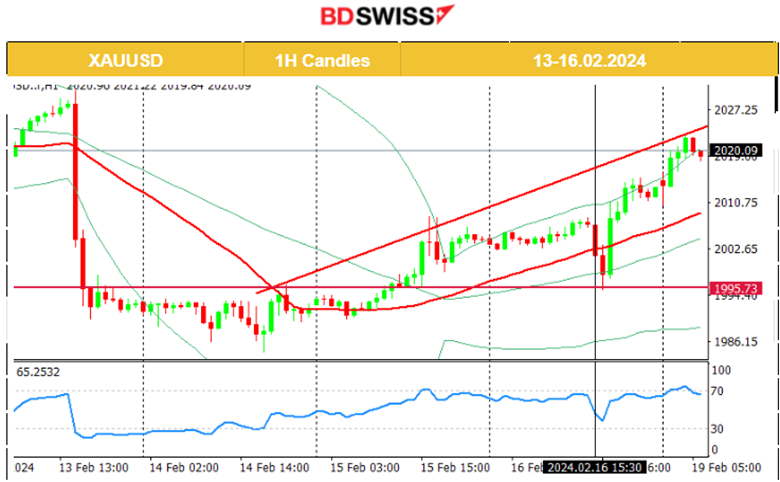
XAUUSD (Gold) 4-Day Chart Summary
Server Time / Timezone EEST (UTC+02:00)
Price Movement
On the 13th Feb, after 15:30, the more-than-expected inflation figure caused USD heavy appreciation and a sharp drop for Gold, passing the support at 2000 USD/oz, moving further downwards until the next support near 1990 USD/oz. Surprisingly, on the 14th Feb, Gold remained in consolidation. Retracement eventually took place yesterday back to the upside, supported by the weak sales report for the U.S. and causing the price to reach just above the 2K USD level. On the 16th Feb the price dropped after the PPI news and USD appreciation, reaching support at near 1995 USD/oz before reversing to the upside. The USD currently experiences weakness and is one major factor that pushes Gold’s price more to the upside. Currently Gold settled near 2020 USD/oz. No signals for any change in trend currently.
 ______________________________________________________________
News Reports Monitor – Today Trading Day (19 Feb 2024)
Server Time / Timezone EEST (UTC+02:00)
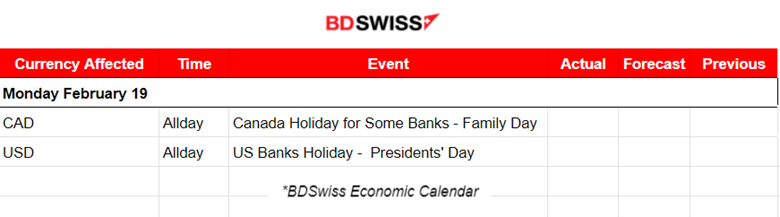
- Midnight – Night Session (Asian)
No important announcements, no special scheduled releases.
- Morning – Day Session (European and N. American Session)
No important announcements, no special scheduled releases.
General Verdict:
______________________________________________________________


