

After the Bitcoin spot ETF got the green light on January 10, 2024, all eyes are now on the Ethereum spot ETF to see if it’ll get the thumbs up too.
Franklin Templeton, one of the major investors behind a Bitcoin ETF, just jumped into the Ethereum ETF showdown. It’s like watching a friendly competition between crypto cousins.

The interest in Bitcoin exchange-traded funds (ETFs) has surged, with investors putting in over $2.2 billion into these products by the week ending February. 16. This is the highest weekly investment ever seen for Bitcoin ETFs, according to Bloomberg and BitMEX Research data.
However, the only Bitcoin ETF experiencing money outflows is Grayscale’s GBTC, losing $624 million last week. GBTC used to be a big player in the market, but it’s now losing ground due to its high fees and discounts. With a 2% annual fee and trading at a 9% discount to its net asset value, GBTC is less attractive compared to ETFs with fees ranging between 0.4% and 0.95%. Since transitioning from an over-the-counter product to an ETF on Jan. 10, GBTC has seen over $7 billion in outflows.
The increase in Bitcoin ETF investments aligns with the upward trend in Bitcoin prices, which have risen by 91% in the last four months. The surge in the cryptocurrency’s value is driven by growing institutional and individual adoption, as well as the positive sentiment surrounding ETFs.

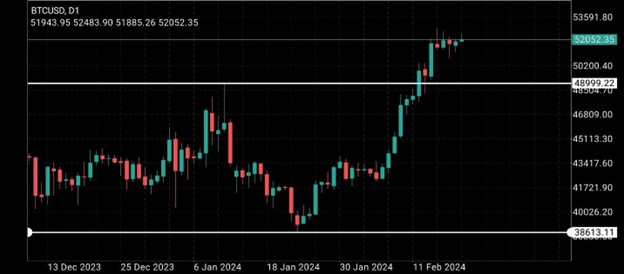
Looking at the technical analysis, Bitcoin moved between $48,999.2 as a resistance level and $38,613.11 as a support level in the BTCUSD daily chart . The resistance was broken, and it’s now acting as a new support level. If the price falls below this support, it could indicate a return to the previous range and a drop towards the 2024 low at $38,613.11.
On the 4-hour timeframe of BTCUSD , a trendline starting from $48,318.99 shows that the price rose to $52,832.99, considered as resistance, before falling back. The downward movement was stopped by the trendline at $50,773.78, and the price is currently moving upward around $52,053.33. Breaking below the trendline could indicate a price drop, while being rejected by the trendline could lead to further upward movement, potentially surpassing the $52,832.99 resistance level.

Sources :
ETFs flows between Feb.12 – Feb.16. Source: Bloomberg Intelligence/Eric Balchunas
Metatrader 4 Charts ( Daily and 4 HR )

 FY2025 Q1 Earnings Release: Market Insights, Analyst Forecasts, and Technical Analysis")
