

Previous Trading Day’s Events (04 Dec 2023)
Inflation has actually increased by 1.4% compared to the same month last year (yearly comparison) according to the Federal Statistical Office (FSO).
The 0.2% is due to several factors including lower prices for hotels and international package holidays. Prices for fuels, heating oil and fruiting vegetables also fell. In contrast, housing rentals and imputed rents for owner-occupied dwellings increased.
Source: https://www.bfs.admin.ch/bfs/en/home/statistics/prices/consumer-price-index.html
______________________________________________________________________
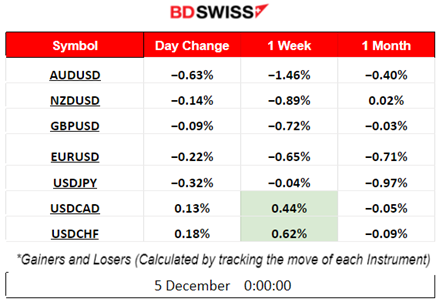
Winners vs Losers
 ______________________________________________________________________
News Reports Monitor – Previous Trading Day (04 Dec 2023)
Server Time / Timezone EEST (UTC+02:00)
- Midnight – Night Session (Asian)
No significant news announcements, no special scheduled releases.
- Morning–Day Session (European and N. American Session)
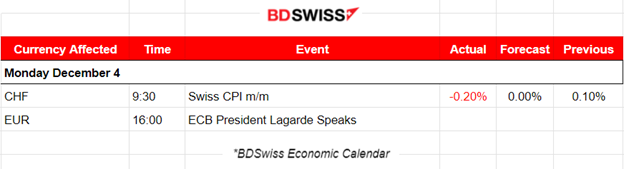
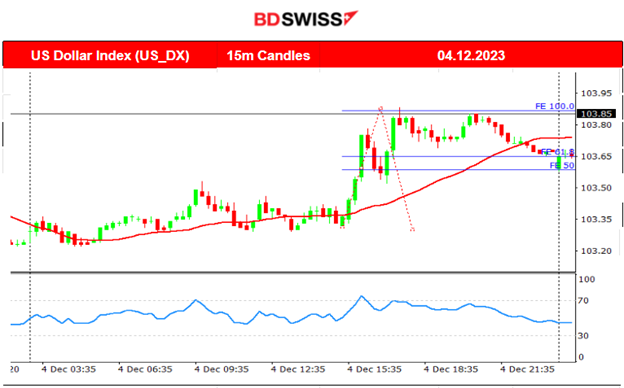
Swiss consumer prices fell by 0.2% in November according to the report released at 9:30. This fall is due to several factors including lower prices for hotels and international package holidays. Falling prices were recorded also for fuels, heating oil and fruiting vegetables. The market reacted with CHF depreciation causing some moderate moves for pairs. USDCHF jumped 40 near pips before reversing soon after.
General Verdict:
 ____________________________________________________________________
FOREX MARKETS MONITOR
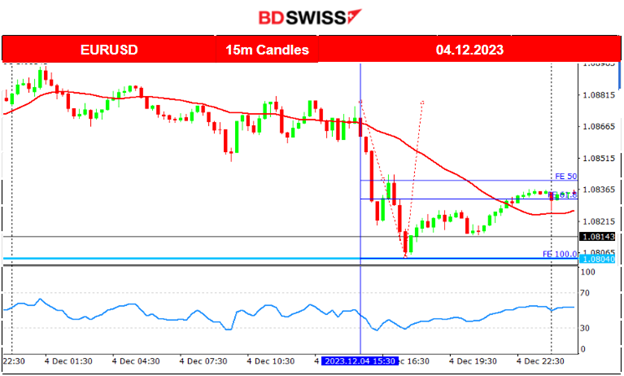
EURUSD (04.12.2023) Chart Summary
Server Time / Timezone EEST (UTC+02:00)
Price Movement
The pair was moving sideways with low volatility until 15:30 when the pair experienced a rapid fall. This was due to the heavy USD appreciation against other currencies that caused the pair to deviate from the 30-period MA greatly reaching the support at 1.080. There were no major scheduled releases, retracement followed and it was back to the 61.8 Fibo level.
 ___________________________________________________________________
CRYPTO MARKETS MONITOR
BTCUSD (Bitcoin) 4-Day Chart Summary
Server Time / Timezone EEST (UTC+02:00)
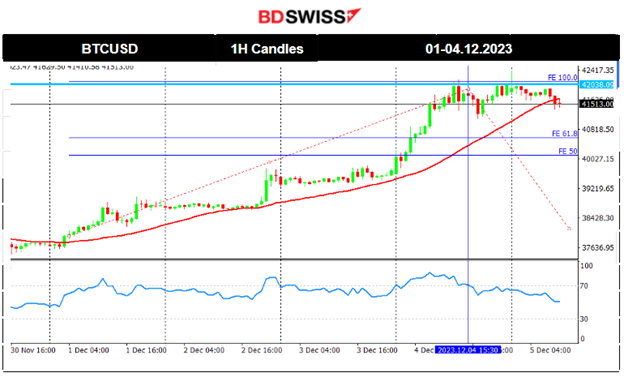
Price Movement
Bitcoin settled near 42K USD after a long path to the upside. Mainly due to fundamental factors and expectations, its value increases as more investors are optimistic about the related decisions from regulators that will soon approve exchange-traded spot bitcoin funds. Now, technically, the RSI shows bearish divergence and the bitcoin price has not yet dropped significantly with a retracement, which is quite probable after we see some breakouts to the downside.
Crypto sorted by Highest Market Cap:
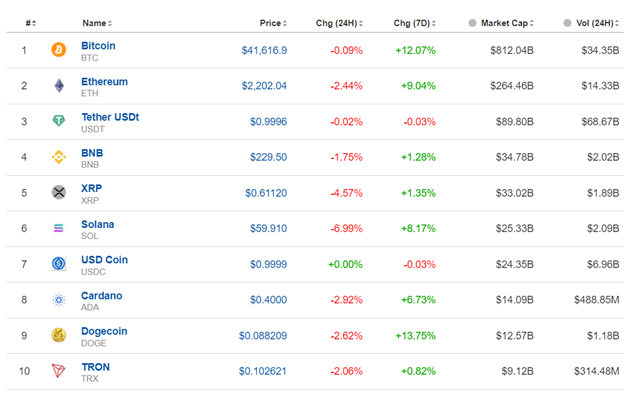
Most Crypto reversed after the surge. The last 24 hours performance is negative with Solana suffering the most, having 7% losses. Dogecoin and Bitcoin remain the top winners for the last 7 days with over 10% gains each.
Source: https://www.investing.com/crypto/currencies
______________________________________________________________________
EQUITY MARKETS MONITOR
NAS100 (NDX) 4Hour Timeframe Chart Summary
Server Time / Timezone EEST (UTC+02:00)
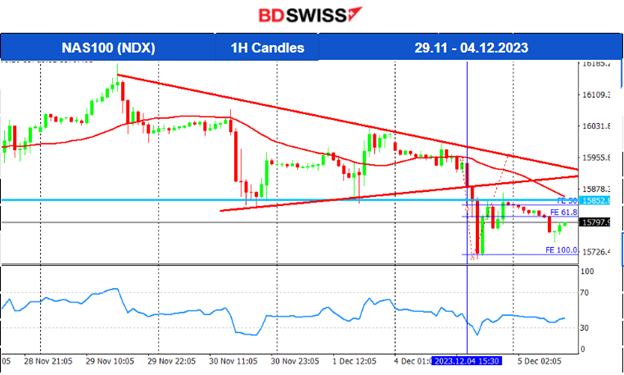
Price Movement
A period of consolidation followed after a high trend upward. The index started to move sideways but with high volatility last week. Even though it experienced some support breakouts we see resilience currently, pushing it to the upside and to remain in range. An apparent triangle formation is depicted on the chart below. The triangle was broken yesterday and the price moved rapidly downwards reaching the next support at near 15700 before eventually retracing back to the 61.8 Fibo level as depicted on the chart. This is the first big breakout and the index could see a further sharp drop when the support breaks further. Currently, both benchmark indices, the S&P500 and the NAS100 follow the same downward path but the US30 shows resilience, remaining still on high levels.
 ______________________________________________________________________
COMMODITIES MARKETS MONITOR
USOIL (WTI) 4-Day Chart Summary
Server Time / Timezone EEST (UTC+02:00)
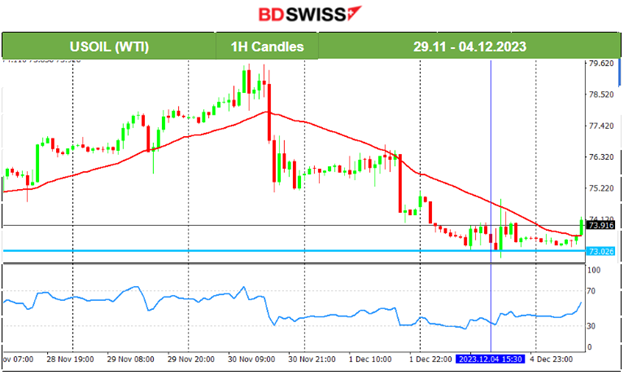
Price Movement
Crude experienced a short uptrend from the 28th to the 30th of Nov. It reached the resistance near 79.5 USD/b and dropped suddenly after it was announced that the OPEC+ producers agreed to voluntary oil output cuts for the first quarter of next year that fell short of market expectations. Price dropped sharply on the 30th Nov reaching the support near 75 USD/b, where it stayed in consolidation until experiencing the retracement back to the mean. It later experienced another drop on the 1st Dec breaking the support and reaching the next at nearly 74 USD/b. After breaking that too it reached the next at near 73 USD/b where it settled. It is currently showing signs of retracing. The RSI signals a bullish divergence showing that it is more possible for Crude oil’s price to move higher soon.
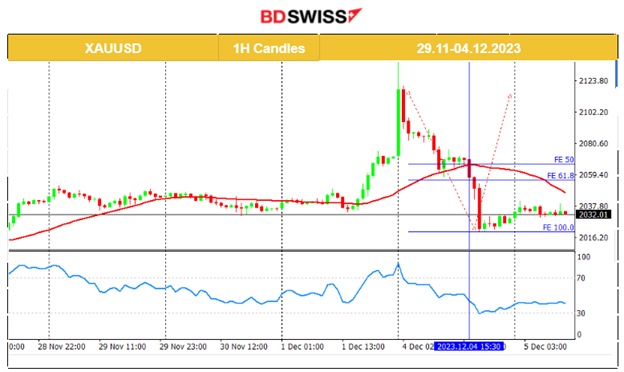
XAUUSD (Gold) 4-Day Chart Summary
Server Time / Timezone EEST (UTC+02:00)
Price Movement
Gold broke the range mentioned in our previous reports and moved to the upside on Friday, 1st Dec. The jump was reinforced with a sudden surge in price after the market opening today. A near 70-dollar move before reversing back to the mean. A record with a price above 2100 USD/oz, driven by a weaker U.S. dollar and the revising Federal Reserve interest rate expectations. The market is betting that the Federal Reserve will hold interest rates steady at next week’s policy meeting and consider cuts in the first half of next year. Yesterday, the price dropped heavily crossing the 30-period MA and reaching the support at 2020 USD/oz before correcting. Retracement though has not fully taken place after this reversal and probably has room for the price to move further to the upside to reach the mean.
 ______________________________________________________________
News Reports Monitor – Today Trading Day (05 Dec 2023)
Server Time / Timezone EEST (UTC+02:00)
- Midnight – Night Session (Asian)
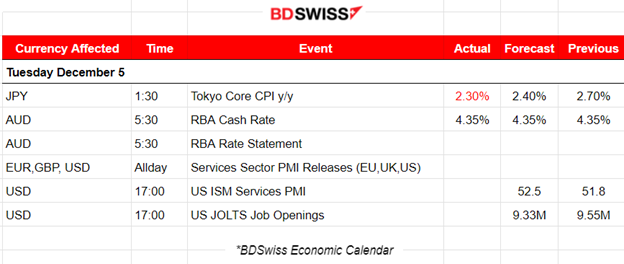
The Tokyo Core CPI yearly change was reported lower than expected at 2.3%. JPY experienced moderate depreciation at that time. USDJPY jumped near 30 pips before retracing to the mean following a volatile path around the MA near the time of the release.
The Reserve Bank of Australia (RBA) decided to leave rates unchanged. Cash Rate remains at 4.35%. The Mon. Report stated; “Whether further tightening of monetary policy is required to ensure that inflation returns to target in a reasonable timeframe will depend upon the data and the evolving assessment of risks”, further stating that they remain determined to return inflation to 2-3% target level. The market’s reaction was AUD depreciation. AUDUSD fell near 30 pips before retracing to the 30-period MA.
- Morning–Day Session (European and N. American Session)
The PMI releases for the Services sector are taking place today and are expected to increase volatility causing possible movement in one direction for EUR, GBP and USD pairs. Possible high deviations from the mean followed by retracements.
One important figure that might cause a moderate intraday shock, affecting the USD pairs, is the ISM Services PMI figure. The services sector has shown better business conditions than the manufacturing sector, especially in the U.S. A higher figure is expected this time. The release might not have a high effect on the market due to the fact that traders await the NFP release on Friday.
The JOLTS Job Openings report might cause the market to react with a shock affecting the USD pairs. This figure is important for the Fed as it currently assesses the labour market situation. Expecting lower Job openings is normal while elevated rates are affecting the markets, demand, sales and business decisions, especially for hiring.
General Verdict:
______________________________________________________________


