During my career, I’ve often felt like Sisyphus: the fellow in Greek mythology doomed to roll a boulder up a hill, only to find that inches before he reaches the top, the boulder slips away and rolls back down to the bottom. Forecasting the economic indicators and creating trading strategies around them…so many times the boulder has slipped away before I could reach the top. Then the same indicator came around the next month and it was time to do it all over again.
But never before did I feel I was rolling the boulder up the wrong hill! Nowadays though the traditional economic indicators are much less important than before. The reason for looking at these indicators is to try to discern a trend, or more precisely, a change in the trend. Usually, economies don’t change track all that quickly, so monthly data, even monthly data a few weeks old, is quite sufficient. But what are we to make of indicators that are down 22% mom one month and up 44% mom the next month (US pending home sales)? Or up 8.5% mom one month, down 11.7% the next, and up 16.9% the month after that (Australian retail sales)? We’ve seen moves of such volatility that, according to statistics, they should only occur every few billion years.
Moreover, the traditional factors that guide currencies are fairly useless nowadays. The most important economic fundamentals guiding currencies in the short term are interest rates, which depend on inflation and central bank policy. But right now the interest rate differentials among the major countries are the smallest that I can remember, both at the policy rate and the 10-year level.
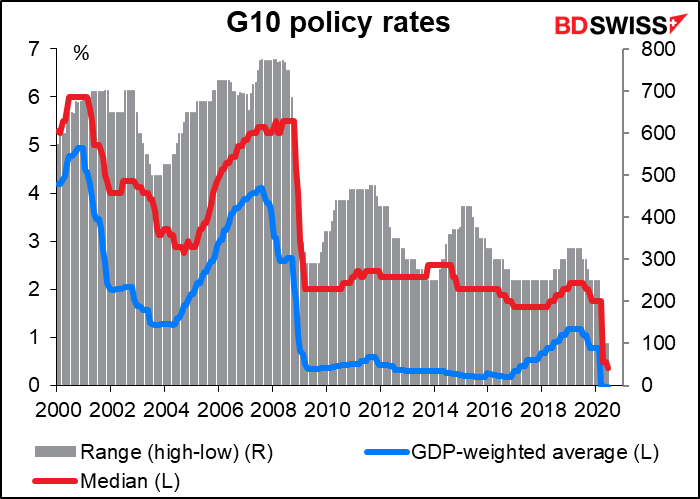
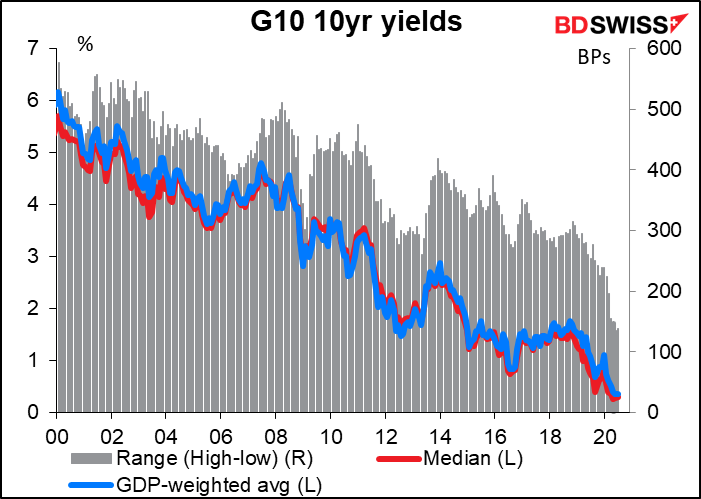
And every major central bank is on hold indefinitely – even those that might change policy have little room to do so. So there’s not much to choose from among currencies. What’s the point of a carry trade that nets you less pick-up in yield annually than the average weekly volatility of the currency pair?
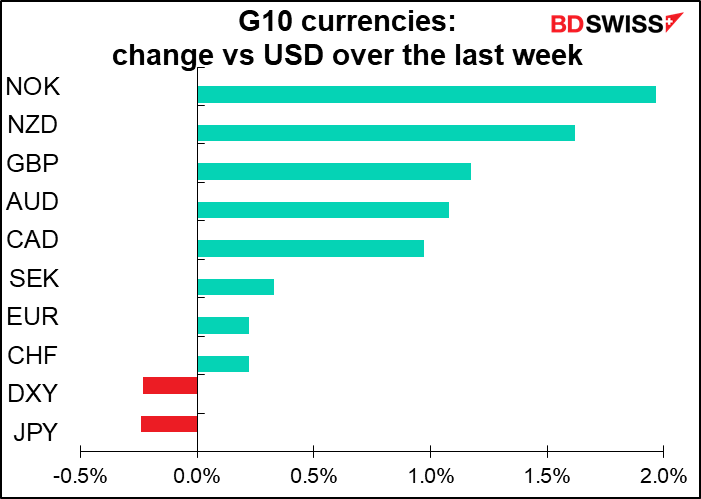
Against this background, we have to look for new drivers of currencies and indicators to measure them. The conclusion I’ve come to from watching the markets is that people are looking for indications of future growth. How quickly and effectively will a country emerge from lockdown, and how quickly will its economy recover? Look at how GBP gained on Wednesday after Bank of England Monetary Policy Committee member J. Haskel said the UK economic activity is returning faster than anticipated. That’s what people are trying to figure out.
Fortunately, suitable new indicators have appeared. There are now numerous indicators of activity that harvest data from widely used apps and present it on a nearly real-time basis. I don’t have access to all of them by any means – some of them are proprietary and cost money, others are quite specialized. Here are the ones that I could find that are publicly available. Several of these indices measure how many people are moving around. This is a key metric to judge how much activity has returned to normal.
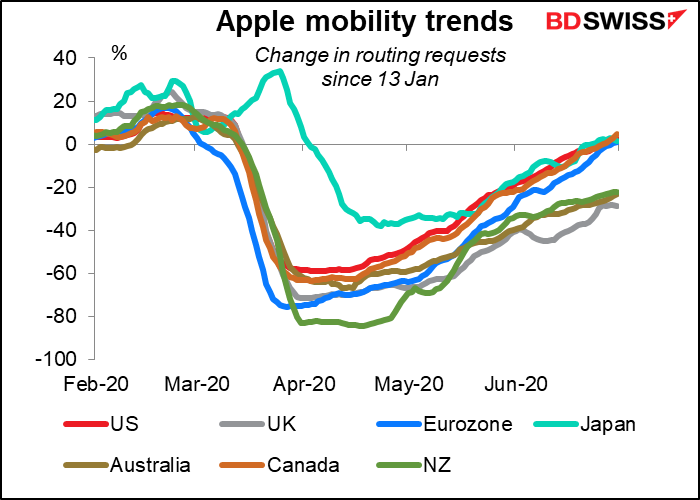
Apple mobility trends is a daily database of requests for directions in Apple Maps. This is an extremely detailed database, down to the individual city level, but fortunately Apple aggregates the data by country as well. Data is given for requests by walking, driving and public transport. I take an average of the three and then a 7-day rolling average of that. For the Eurozone, I use a population-weighted average of Germany, France, Italy and Spain. The results are somewhat surprising: I would’ve thought New Zealand and Australia, where the virus has been dampened considerably and lockdown fairly well ended, would’ve been higher. Maybe that’s exactly why the virus is less prevalent there.
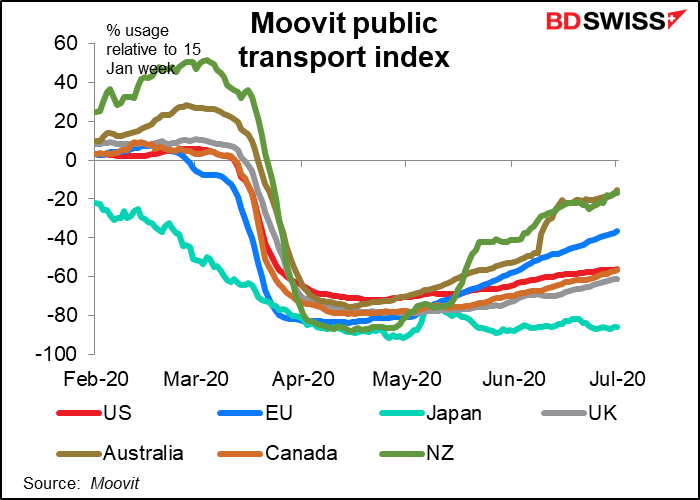
Moovit Public Transit Index: Similar data is available from Moovit, an app that specializes in public transportation. They don’t give national figures, just city figures. I take a simple average of all the cities that they give in each country. This data gives a very different picture than the Apple data. Perhaps people are avoiding public transport and driving more?
In this data, Australia and New Zealand are indeed ahead of the other countries, as I would expect. But the big slump in Japan puzzles me, because Japan has had relatively low levels of people working form home and almost no one lives close enough to their workplace to bicycle or drive. I noticed that the decline in Japan started almost immediately. It may be that activity in the week in question was unusually high – it included “Coming of Age Day,” a national holiday in which all the people who turn 20 that year get dressed up and attend various official celebrations (sort of a national birthday party). Then again, while there would’ve been a lot of 20-year-olds moving around, there would’ve been few if any commuters that day.
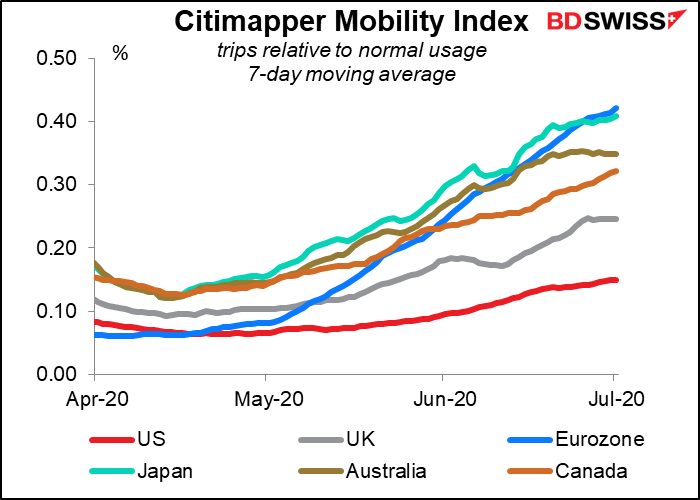
Citimapper, a route-planning app with some 20mn users, has created a “mobility index” that estimates how much people are moving around compared with a typical day. The index is based on users’ journeys by foot and on public transport (but not by car). I’ve averaged out the figures for all the cities in each relevant country, without trying to weight them by population.
The data show the US lagging far behind all the other countries, with the UK also lagging. Japan and the Eurozone are on top, but still at only 40% of normal. This data indicates that activity is still quite subdued despite some eyepopping numbers in percentage terms that we’re getting for some statistics.
Google has similar data in its Community Mobility Reports, but they’re way too detailed for me. They give data on requests for six categories: retail and recreation, grocery and pharmacy, parks, transit stations, workplaces, and residential, and does it for I don’t know how many countries, states, cities etc. Once you get down to Zimbabwe Midlands Province at the bottom of the spreadsheet, you’ve got 606,468 rows of data. I think this is for IT professionals.
The problem, as you can see, is that the conclusions of these apps don’t all agree with each other. Is Japan the least-active country, as Moovit makes it out to be, or the most active, as Citimapper says? (Apple agrees more with Citimapper.) Is New Zealand towards the bottom of the pack in getting back to normal, as Apple implies, or is it the top, as Moovit would say? I tend to think Apple is more reliable, for two reasons. One, they track all sorts of journeys – by foot, car and train, not just public transportation. So even if people change their mode of transportation in response to the virus, their activity may still register. Two, an awful lot of people have Apple products, probably more than are using the Moovit app.
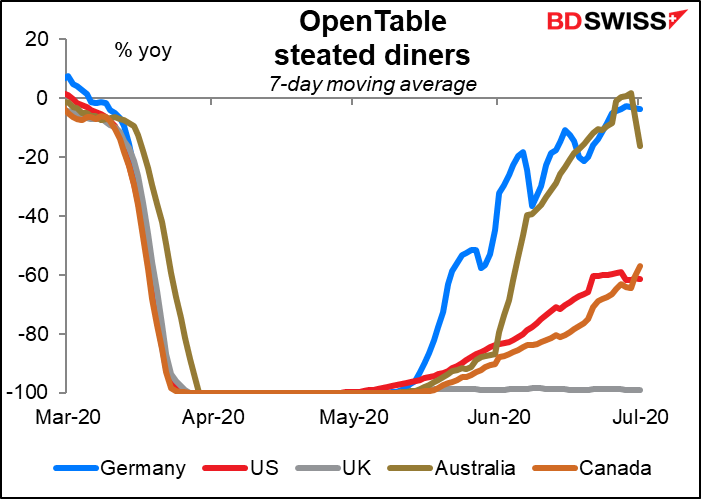
Open Table, a restaurant booking service, offers data on restaurant reservations. Its data is incredibly valuable now, because so much of the lockdown is focused on restaurants, bars and other areas of entertainment. It’s like a daily service-sector purchasing managers’ index. Unfortunately Open Table only covers a small number of countries: Ireland and Mexico as well as the five shown in the graph.
The Oxford Virus Government Response Index To quote from their website, “This tool aims to track and compare policy responses around the world, rigorously and consistently. The Oxford COVID-19 Government Response Tracker (OxCGRT) systematically collects information on several different common policy responses that governments have taken to respond to the pandemic on 17 indicators such as school closures and travel restrictions.” They have data on 177 countries from Aruba to Zimbabwe.
They sum up their conclusion with a “stringency index.” I’m waiting to see the stringency index for any country starts to turn back up. That will be a significant change that could be market-affecting.
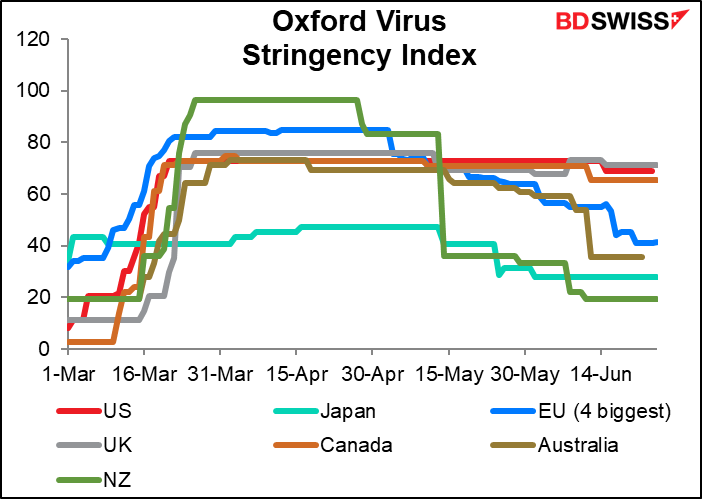
Note though that this data too doesn’t fit in with some of the other data – again, New Zealand is an enigma. It had the most stringent lockdown and now has the loosest. So one might expect its transportation data to have picked up – but it hasn’t, at least not according to Apple. Perhaps though that’s the secret of their low virus count: maybe people are still being careful.
The Oxford website has a variety of other data, such as confirmed deaths. Also an Economic Support Index, which is useful too, since it’s hard to keep track of everything that all the countries are doing.
Do you know of any more? Please let me know if you do.
Of course, the most important point to watch is the virus itself: new cases, deaths, and all the other myriad ways of looking at that data. There are many many sources for that. Probably the best thing is just to read your local newspaper. One website I would recommend is the COVID-19 Dashboard by the Center for Systems Science and Engineering (CSSE) at Johns Hopkins University (JHU). There’s also Avi Schifmann’s COVID-19 Dashboard. Young Mr. Avi is a 17-year-old whizz kid who’s built one of the best websites for following the data.
Week ahead: Reserve Bank of Australia and much else on the schedule
One of the reasons why I wrote so much about these alternative indicators this week is because there aren’t so many of the usual indicators out next week, and I have to write something since I get paid by the word. The second week of the month is usually slow, but this month it’s even slower than usual: it doesn’t even have the usual highlight of the US consumer price index, which is coming out on the 14th.
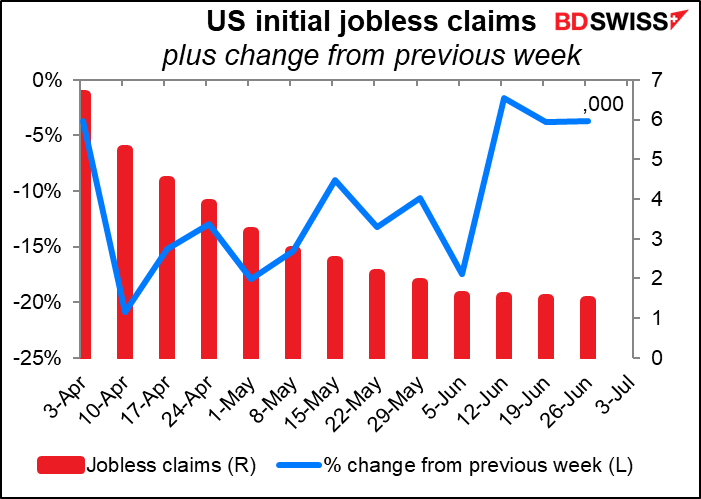
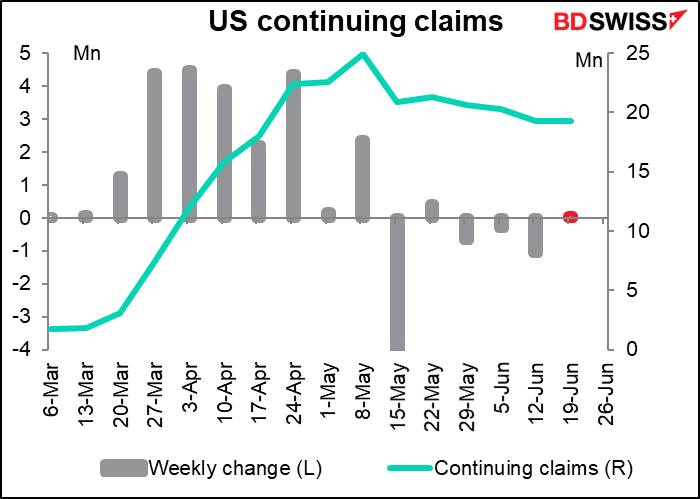
For the US, the focus will be on Thursday’s weekly jobless claims. Claims have started to flatten out – they’re falling by less and less each week (2%, 4% and 4% for the last three weeks, vs double-digit declines for most of the previous weeks). That’s worrisome. After 15 weeks, shouldn’t it be the opposite? Shouldn’t there be fewer and fewer job losses every week? And continuing claims aren’t falling by much, either.
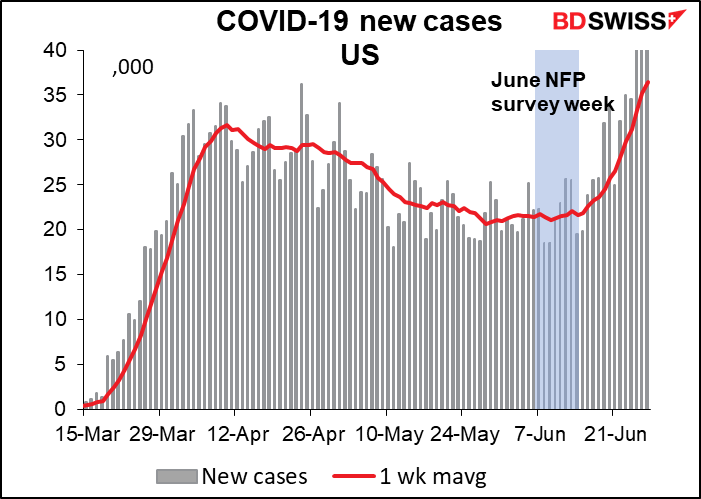
This makes me think that yesterday’s surprisingly good US nonfarm payroll figures were probably more of a function of when the survey was taken rather than any real change in the employment picture. The survey week, the week containing the 12th of the month, was the recent low point for new virus cases in the US. Since then the virus has picked up again and probably a lot of the businesses that reopened are shutting down again.
Other than that, there’s the JOLTS (Job Openings and Labor Turnover Survey) report on Tuesday, which isn’t so market-affecting but I find interesting nonetheless, and producer price index on Friday (but that’s of more interest to equity market participants as an indicator of corporate profit margins).
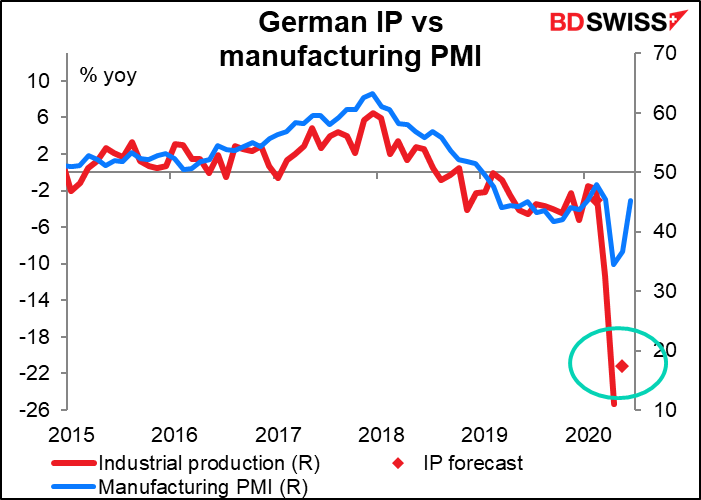
In Europe, Germany announces its factory orders on Monday and industrial production on Tuesday. Being for May, they’re both expected to show a big bounce-back after April’s shocking decline (+10% mom for factory orders vs -25.8%, +8.0% mom for IP vs -17.9%). Nonetheless they’re expected to be down considerably from the like year-ago level, albeit not as much as in the previous month. In any case I think the data should corroborate the dominant narrative that April was the trough and things are recovering gradually.
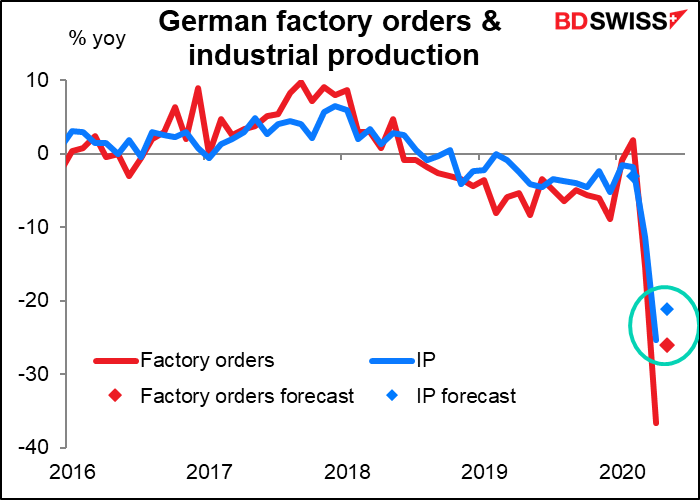
In any case, the rebound shouldn’t surprise anyone who’s following the German manufacturing PMI.
Eurozone retail sales are coming out on Wednesday. No forecast is yet available. I don’t normally cover this indicator, which is normally of only marginal interest, but “normally” is the operative word here. Today’s world is far from normal and people are interesting in finding out how the consumer is holding up.
Also in Europe, there are more Brexit talks scheduled between the UK and the EU.. No progress made so far, no progress likely.
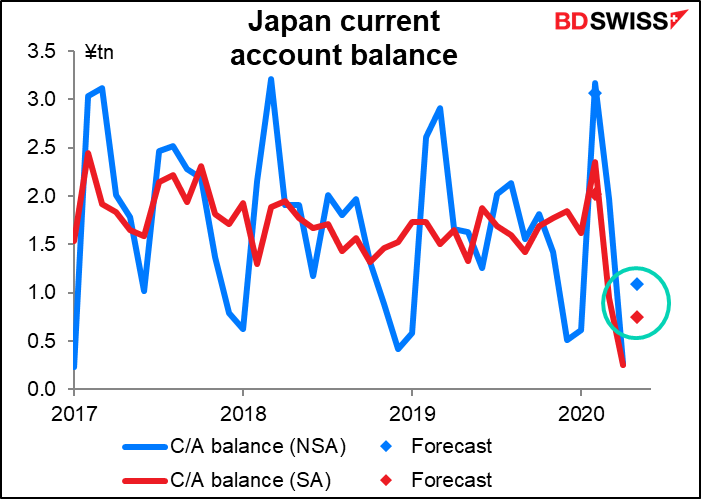
Japan has two indicators of interest coming out: the current account balance on Wednesday and machinery orders on Thursday.
Japan’s current account surplus is expected to be modestly higher. That’s fairly good, considering how exports have been plunging (-28% yoy). I’m not sure whether it will be a significant-enough difference to boost the yen however.
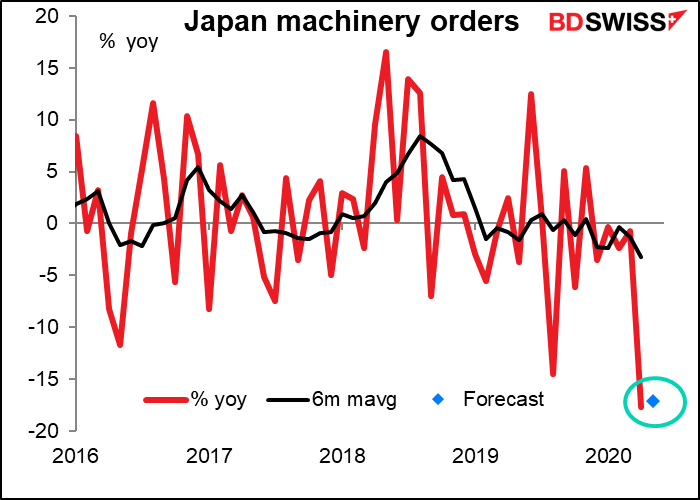
Japan’s machinery orders are one of the most closely watched indicators out of the country, but for the life of me I can’t understand why – the mom figure, which is the one most closely watched, doesn’t seem to trend at all, so I can’t get very much information from them. Besides, the “forecasts” for this indicator are total guesses (I know, I used to work next to guys who made the forecasts) and so whether the number misses or beats the forecasts has no information, either.
In any event, May’s figure is expected to be down less on a mom basis but still down nonetheless, which is disappointing after the sharp drop in April.

The yoy orate of decline is expected to bottom out Here one cane discern a glimmer of a trend in the data, and in this case it’s not a good one.
RBA meeting: little excitement likely
The only major central bank meeting during the coming week is the Reserve Bank of Australia (RBA). I’m going to do something I’ve always wanted to do: save myself some time and use the same comment over again. This is what I said before their June meeting:
The RBA meeting should be relatively uneventful. The Board has pledged not to increase the cash rate target “until progress is being made towards full employment and it is confident that inflation will be sustainably within the 2–3 per cent target band.” On the other hand, Gov. Lowe has said it was “extraordinarily unlikely” that the RBA would implement negative rates; instead, they would first choose to increase their bond purchases. But as the graph above shows, in fact they have reduced the size of their balance sheet from the recent peak. With tightening ruled out for now and no sign that they think further loosening is required, the RBA seems likely to be on hold for the indefinite future. This is indeed what the market is pricing in – no change in rates as far as the eye can see (which is December). I would expect a statement similar to May’s with again a pledge “to do what it can to support jobs, incomes and businesses during this difficult period…” but no new initiatives at this time. Accordingly, I would expect little if any reaction from the FX market.
To tell the truth, I was wrong: the RBA was more optimistic than expected and AUD rocketed after the meeting. Specifically, they said:
…it is possible that the depth of the downturn will be less than earlier expected. The rate of new infections has declined significantly and some restrictions have been eased earlier than was previously thought likely. And there are signs that hours worked stabilised in early May, after the earlier very sharp decline. There has also been a pick-up in some forms of consumer spending.
Given the sharp 16.9% rebound in retail sales in May, which brought sales back to above where they were before the virus hit, and the country’s success in quelling the virus, they may be even more optimistic this time. I could be wrong again and AUD could get a further boost.